

 |
 |
|
 |
||
|
|
||
|
|
|
| food outlook | |
| No. 1 | Rome, April 2004 |
|
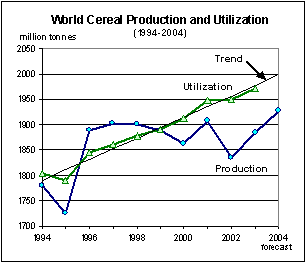
Cereal Supply/Demand RoundupGlobal cereal output to increase in 2004 FAO’s first forecast of global cereal output in 2004 is 2 131 million tonnes (including rice in paddy terms), which would be 2.4 percent up from the previous year and almost 3 percent above the average of the past 5 years. The bulk of the increase is expected in wheat, production of which is forecast to reach 596 million tonnes, 6.6 percent up from 2003 and well above the average of the past five years. This increase mostly reflects a sharp recovery in Europe’s output after drought in the preceding year, which would more than offset reductions expected in China, the United States and Australia. By contrast, the early outlook for coarse grains points to a slight reduction in global output in 2004, by 1 percent to about 922 million tonnes. Reductions forecast in Africa and North America would more than offset an increase expected in Europe. This first forecast for coarse grains is very tentative, however, as the bulk of the world’s crops have yet to be planted in the main producing northern hemisphere countries, where the current forecasts assume normal weather and take into account latest indications of planting intentions. As for coarse grains, the main season in the major paddy producing countries, mostly located in the northern hemisphere, has yet to begin later in the year. However, given the good results from the crops already being harvested in the southern hemisphere and early expectations of increases in the rest of the world, the global paddy output in 2004 is expected to increase by about 3.8 percent to almost 613 million tonnes. World Cereal Production
Source: FAO 1/ Milled rice. 2/ including milled rice. Note: Totals computed from unrounded data.
 The increase in global cereal output forecast for 2004 would come as a very welcome development for global food supply and could likely reduce a little further the shortfall in production compared to utilization, which has existed since 2000 and was especially large in 2002. The continued tightening of global cereal supplies for four successive years since 1999/2000 has brought international cereal prices under significant upward pressure in the past months. GLOBAL OUTLOOK1/
 stable stable  up up  down - - not available down - - not available These signs refer only to the direction of change from the previous season.
1/ Production refers to the first year; stocks refer to crop seasons ending in the second year; trade and prices for wheat and coarse grains refer to July/June and for rice refer to the second year.
Total cereal utilization expands World cereal utilization in 2003/04 is forecast at 1 971 million tonnes, up 1 percent from 2002/03 but still slightly below the 10-year trend. In spite of a significant increase in international cereal prices and major animal disease outbreaks in the second half of the season, global cereal utilization is expected to rise above the previous season because of strong demand for feed and industrial use, especially in the United States. Global cereal stocks fall sharply Since the previous report in November, the FAO forecast for global end-of-season cereal stocks in 2004 has been raised by 11 million tonnes to 393 million tonnes, but is still down 89 million tonnes, or 18 percent, from their opening levels. Upward adjustments to forecasts for wheat inventories in several countries in Africa, Asia and a number of major exporting countries are the main reasons for this month’s higher estimates. The anticipated sharp decline in cereal stocks from the previous season would be mainly due to China although substantial cutbacks are also anticipated in India, the Russian Federation, Ukraine, and the EU, mostly driven by reductions in their 2003 cereal production. World Cereal Production, Supplies, Trade and Stocks
Source: FAO
1/ Data refer to calendar year of the first year shown. Rice in milled equivalent.
2/ Production plus opening stocks.
3/ July/June basis for wheat and coarse grains and calendar year (second year shown) for rice.
4/ May not equal the difference between supply and utilization due to differences in individual country marketing years.
Cereal prices on the increase International prices of most cereals have strengthened since the previous report in November. Export prices for wheat, maize and rice all registered strong gains, reflecting tight market conditions. While early prospects for wheat crops are favourable and hence some easing of wheat prices could be anticipated as the harvest approaches in the northern hemisphere in the coming months, export prices for coarse grains and rice are unlikely to recede any time soon based on current supply and demand prospects. Cereal Export Prices *
* Prices refer to the monthly average. For sources see Appendix Tables A.6 and A.8.
Trade in cereals contracts The FAO forecast for world cereal trade in 2003/04 has been raised by 3 million tonnes since November to 230 million tonnes, still 12 million tonnes, or 5 percent, below the previous year’s level. This large contraction is mostly accounted for by reduced wheat and rice trade, while coarse grain trade is forecast to remain largely unchanged from the previous season. For wheat, sharply reduced imports are forecast by the EU, Brazil and several countries in North Africa as well as in Asia. Regarding rice, the most significant cutbacks are expected in imports by Bangladesh, Indonesia, and Brazil. |
|||||||||||||||||||||||||||||||||||||||||||||||||||||||||||||||||||||||||||||||||||||||||||||||||||||||||||||||||||||||||||||||||||||||||||||||||||||||||||||||||||||||||||||||||||||||||||||||||||||||||||||||||||||||||||||||||||||||||||||||||||||||||||||||||||||||||||||||||||||||||||||