4.1 Fishing fleets
4.2 Available statistics
4.3 Catch rates
4.4 Sizes of shrimps caught
Several fleets exploit the stocks being studied:
|
STOCKS |
FLEETS |
|
IVORY COAST |
Ivorian, occasionally Liberian |
|
GHANA |
Ghanaian and sporadically Ivorian and Benin flag
vessels |
|
TOGO |
No information, insignificant fishery |
|
BENIN |
Occasionally by Benin and Ivorian flag vessels |
|
NIGERIA |
Nigerian, Cameroonian fleet and occasionally by Benin and
Ivorian flag vessels |
|
CAMEROON |
Cameroonian, Nigerian |
|
EQUATORIAL GUINEA |
No information |
|
GABON |
Gabonese survey in 1969. Stock unexploited ever
since |
|
CONGO |
Incidental catches by the Congolese trawlers |
4.2.1 Ivory Coast
Ivorian catch and effort statistics have existed since the beginning of the fishery; in particular the catches made by the artisanal fishery are roughly known (Table 2). Until 1968, shrimps were exploited only by conventional types of trawlers, some of which searched for them particularly during the good season. From 1969 onwards, specialized shrimping developed. From June 1969 to June 1970, the fleet increased from 3 to 23 boats; for various reasons the number of boats declined after 1970 and, since late 1975, the number has been stable with six 380 HP vessels.
At the same time the embryonic artisanal fishery was limited to the Aby lagoon until 1966. It developed in the three lagoons from 1967 onwards. The fishing effort increased very rapidly until 1974 and appears to have become stable ever since. The data are found in Table 2.
Table 2
CATCHES OF SHRIMPERS IN IVORIAN WATERS AND THOSE OF ARTISANAL FISHERMEN IN LAGOONS
|
YEAR |
SEA |
LAGOON |
TOTAL |
YEAR |
SEA |
LAGOON |
TOTAL |
|
1955 |
15 |
100 1/ |
115 |
1966 |
160 |
100 |
260 |
|
1956 |
20 |
100 |
120 |
1967 |
170 |
320 2/ |
490 |
|
1957 |
20 |
100 |
120 |
1968 |
? |
340 |
? |
|
1958 |
35 |
100 |
135 |
1969 |
490 |
290 |
780 |
|
1959 |
90 |
100 |
190 |
1970 |
620 |
310 |
930 |
|
1960 |
55 |
100 |
155 |
1971 |
710 |
620 |
1 330 |
|
1961 |
20 |
100 |
120 |
1972 |
480 |
480 |
960 |
|
1962 |
15 |
100 |
115 |
1973 |
460 |
520 |
980 |
|
1963 |
? |
100 |
? |
1974 |
280 |
630 |
910 |
|
1964 |
160 |
100 |
260 |
1975 |
390 |
780 |
1 170 |
|
1965 |
150 |
100 |
250 |
1976 |
480 |
630 |
1 110 |
|
|
|
|
|
1977 |
460 |
620 |
1 080 |
1/ Estimated value4.2.2 Ghana
2/ Beginning of industrialization of lagoon fishery
Industrial and artisanal catch statistics could be reconstructed from 1967. Species breakdown has not always been possible but it should be observed that, unlike other countries, the predominant species is the small coastal shrimp Parapenaeopsis atlantica. The stock of P. duorarum had only a transient existence linked to the artificial and temporary opening of the lagoon in 1967 and 1969. The available statistics are found in Table 3. No measure of effort is available.
Table 3
CATCHES OF SHRIMPS IN GHANA FROM 1967 TO 1976
|
Year |
P. duorarum |
Mixed 1/ |
Total |
|
1967 |
0 |
240 |
240 |
|
1968 |
0 |
250 |
250 |
|
1969 |
40 |
570 |
610 |
|
1970 |
190 |
280 |
470 |
|
1971 |
0 |
470 |
470 |
|
1972 |
20 |
580 |
600 |
|
1973 |
80 |
400 |
480 |
|
1974 |
90 |
700 |
790 |
|
1975 |
10 |
410 |
420 |
|
1976 |
10 |
730 |
740 |
1/ Including mainly the P. atlantica4.2.3 Togo
Fishing grounds located off Togo are extremely limited and there does not exist any significant shrimp fishery (landings under 5 tons a year).
4.2.4 Benin, Nigeria, Cameroon
The most important portion of the stock is located around the Niger delta. The whole of the area is fished by the fleet of the three coastal countries and it has not been possible to break down catches by fishing areas with sufficient accuracy in order to be able to deal separately with the various stocks probably existing in this sector.
Table 4
CATCHES OF SHRIMPS IN THE BENIN - CAMEROON AREA
|
|
1970 |
1971 |
1972 |
1973 |
1974 |
1975 |
1976 |
1977 |
|
Nigeria 1/ |
912 |
1 345 |
1 245 |
1 359 |
2 021 |
2 139 |
2 213 |
|
|
Cameroon 2/ |
(295) 4/ |
859 |
1 018 |
972 |
1 114 |
1 001 |
882 |
831 |
|
Benin 3/ |
3 |
47 |
218 |
465 |
502 |
237 |
4 |
|
|
TOTAL |
(1 210) 4/ |
2 251 |
2 481 |
2 796 |
3 637 |
3 377 |
3 099 |
|
1/ Bayagbona’s data (1976)It is not impossible that the catches recorded in Table 4 may contain a small proportion of related species, e.g. P. atlantica and P. longirostris.
2/ Everett’s data (1978), corrected by the Working Group
3/ CECAF data
4/ Incomplete data
4.2.5 Gabon
Data obtained from a survey carried out in Gabon by a single boat are the only ones available (Fontana and Bâ, 1972). Thirteen tons of tails were caught, the stock has probably remained unexploited over since.
4.2.6 Congo
Catches of P. duorarum are practically non-existent (a few tons), and artisanal catches are very limited (a few hundred kilogrammes).
4.2.7 Angola
Although interesting catch rates were obtained on some grounds, no specialized exploitation seems to exist.
4.2.8 Remarks
With the exception of Ivory Coast, information on the artisanal fishery is nonexistent in the whole sector. However, this fishery is probably developed in Benin, Nigeria and Cameroon.
4.3.1 Ivory Coast
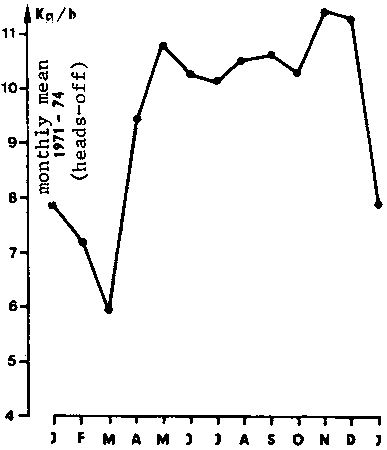
The highest catch rates are obtained from May to October and reach 11 kg/h (heads-off, for 250 HP standardized boat); they are low from January to March: 6 to 8 kg/h (Figure 3a, Garcia, 1977). From 1970 to 1975, catch rates fluctuated between 140 and 290 kg/day. During the first year of exploitation, during 1969, catch rates reached 435 kg/day.
4.3.2 Ghana
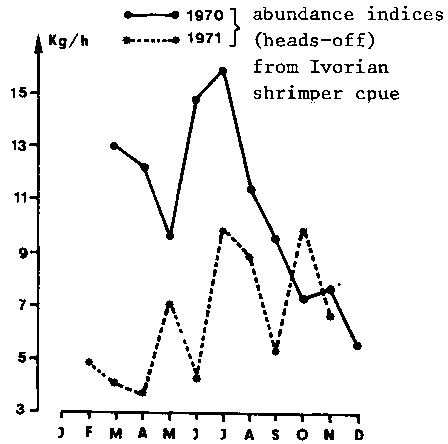
According to Jones (1970), an average catch rate of 370 kg/day was obtained throughout 1969 during the first commercial surveys. In 1969 catches exceeding 1.5 t/day were made in February/March by a 1 200 HP boat. The catch rates obtained by the Ivorian fleet operating in Ghanaian waters fluctuated between 6 and 16 kg/h in 1970 and between 4 and 10 kg/h in 1971. After 1971 and following the closure of the Keta lagoon, successive bankruptcies of shrimp boat owners suggest that catch rates have declined dramatically. In 1970, the highest catch rates were obtained from March to July and, in 1971, from July to November (Figure 3b).
4.3.3 Togo
The Ivorian fleet surveyed Togolese shrimping grounds very occasionally between August 1970 and March 1971. The catch rates recorded are the following (in kg/h heads-off for a 250 HP standardized shrimp boat):
|
August 1970 |
11 kg/h |
|
September 1970 |
7 kg/h |
|
October 1970 |
8.8 kg/h |
|
March 1971 |
4.9 kg/h |
Catch rates of 5 to 7 kg/h (heads-off for 250 HP boat) were obtained between November 1970 and March 1971 by the Ivorian fleet. Catch rates of 3 to 10 kg/h were recorded in the last quarter of 1971.
4.3.5 Nigeria
The first surveys carried out in 1963 by the research vessel RV KIARA obtained catch rates of 90 to 500 kg/h (maximum values). These results actually are for mixed P. duorarum and P. atlantica. The surveys carried out in 1970 by two 25 m commercial vessels obtained catch rates ranging from 3 to 51 kg/h (heads-on shrimps) Bayagbona et al., 1971).
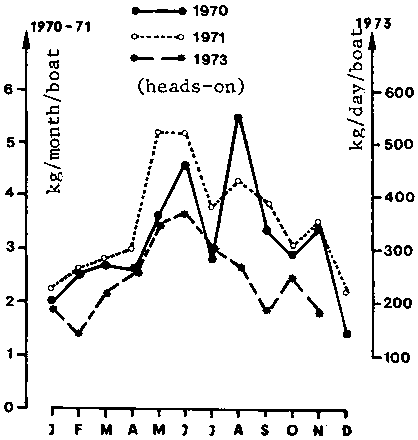
From 1970 to 1974, the Lagos shrimpers obtained catch rates ranging from 200 to 250 kg of heads-on shrimps per day absent from the port. The Ivorian fleet fishing in the same area obtained catch rates ranging from 7 to 20 kg/h in 1971 (heads-off, for 250 HP boat). From May to December 1973, catch rates obtained ranged from 6 to 16 kg/h. Low catch rates are recorded from September to April and high rates from May to August (Figure 3c).
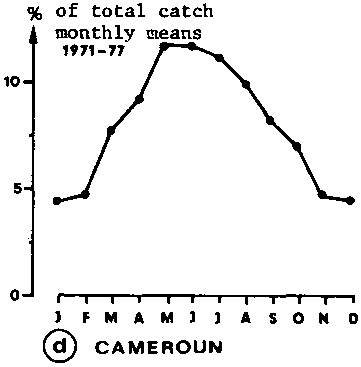
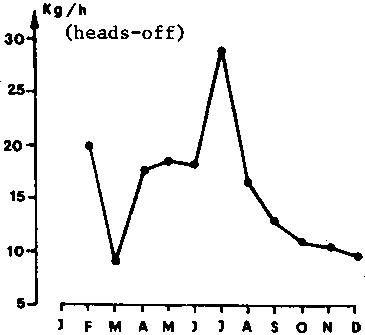
Fig. 3 - Seasonal variations of the index of abundance for different fishing grounds (a, b, c, d, e)
a. IVORY COAST
b. GHANA
c. NIGERIA
d. CAMEROUN
e. GABON
Sources:4.3.6 CameroonIVORY COAST: Garcia, 1974
GHANA: C.R.O. Abidjan
NIGERIA: Fed. Dept. of Fish Reports
GABON: Fontana, Ba, 1972
CAMEROUN: Everett, 1977
From 1970 to 1977, the Douala-based fleet obtained, on their shrimping grounds, catch rates ranging from 120 to 675 kg/day at sea (heads-on shrimps). The average monthly catch rates for the period 1970/1976 are low from October to March (245 to 350 kg/day) and high from April to September (450 to 520 kg/day) (Figure 3d).
4.3.7 Gabon
Catch rates in Gabon are high from April to August (about 20 kg/h, heads-off for 650 HP boat) and low from September to March (10 to 14 kg/h) (Figure 3e).
4.4.1 Ivory Coast
Three sets of data are available:
- The annual histogram of catches made by a research vessel during systematic surveys carried out in 1966/67 and 1969/70 throughout a whole year off Grand-Bassam. The mode of males ranges from 28 to 30 mm (carapace length). Females ranging from 30 to 40 mm predominate (Figures 4 and 5).4.4.2 Nigeria (Figure 8)- The annual histogram of catches by commercial shrimpers in 1973. The mode of males averages 27 mm and that of females ranges from 20 to 30 mm. The result of the intensive exploitation of the stock after 1969 appears clearly in the increasing number of young shrimps found in the catches, and this is more perceptible with females (Figure 6).
- The composition of catches of an Ivorian Shrimp Company (SICRUS) by commercial categories for the last quarter of 1970 and the years 1971 and 1973. A heavy decline in abundance of large-sized shrimps (U15) and a simultaneous increase of small-sized ones (51 to 70) were recorded in 1971, a year when exploitation was at its height (Figure 7).
Bayagbona et al., (1971) found that the main mode of males is near 30 mm and that of females is near 42 mm. Actually the available histogram concerns a mixing of males and females; it is thus difficult to be very accurate.
4.4.3 Gabon
The only available data are those given by Fontana and Bâ (1972) on the virgin stock off Gabon. They reveal a very small percentage of small shrimps (5 to 10 percent) and a high percentage of big ones (20 to 50 percent, according to the season).