5.1 Ivory Coast
5.2 Ghana
5.3 Togo
5.4 Benin, Nigeria, Cameroon
5.6 Conclusions
With the data available, only a global approach is possible. This consists of analysing the evolution of the catch per unit effort when the fishing effort increases. One can thus calculate the average maximum and optimum potential catch over a long period, together with the corresponding fishing effort. This method implies that the variations of the catch are essentially linked to the variations of fishing effort at sea. It is obvious that the variations of the fishing effort in the lagoon also affect the size of the adult stock at sea. In order to use a production model for the evaluation of the stocks at sea, the level of exploitation in the lagoon must therefore remain stable during the period considered. It follows that the evaluation thus obtained is valid only for the observed level of exploitation in the lagoon. If exploitation in the lagoon is intensified, the potential of marine stock will decrease; on the other hand, a decline of the lagoon fishery will bring about an increase of potential catch at sea.
Fig. 4 - Length frequency polygon of shrimps caught on the Grand-Bassam fishing ground (Ivory Coast) in 1966/67 by the research trawler “Reine Pokou”
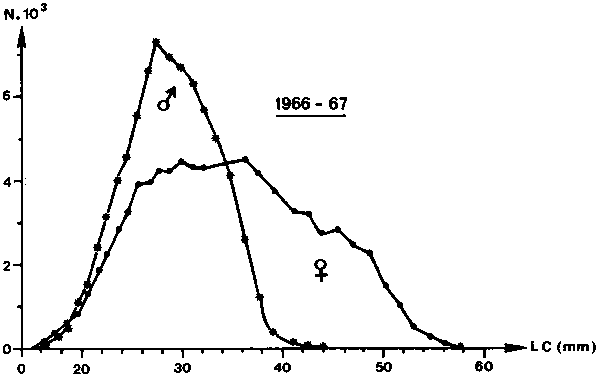
Fig. 5 - Length frequency polygon of shrimps caught on the Grand-Bassam fishing ground (Ivory Coast) in 1969/70 by the research trawler “Reine Pokou”
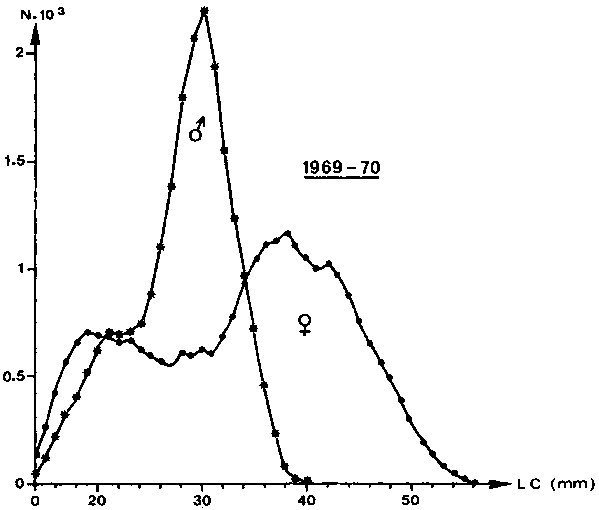
Fig. 6 - Length frequency polygon of shrimps caught on the Ivorian shelf by the Abidjan shrimp fleet in 1973
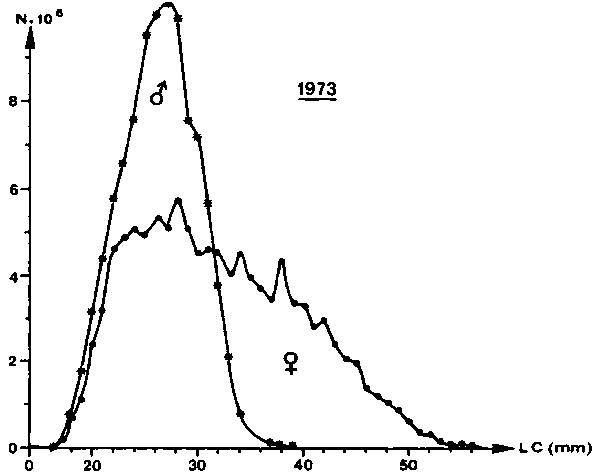
Fig. 7 - Composition of the landings of SICRUS by commercial categories (tails) in the Ivory Coast (Garcia’s unpublished data)
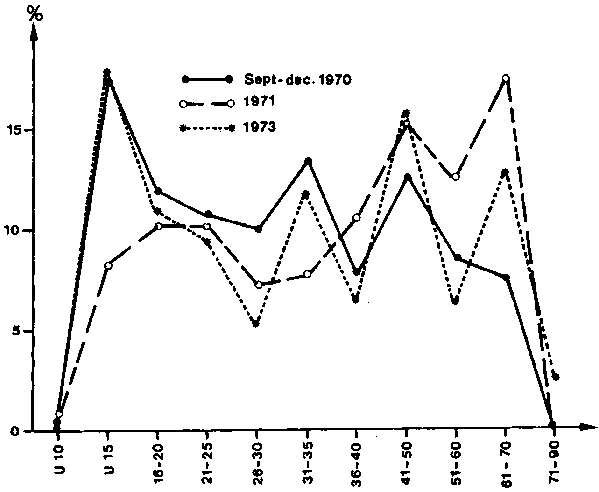
Fig. 8 - Length frequency distribution of P. duorarum caught in Nigerian waters (after Bayagbona and Afinowi, 1971)
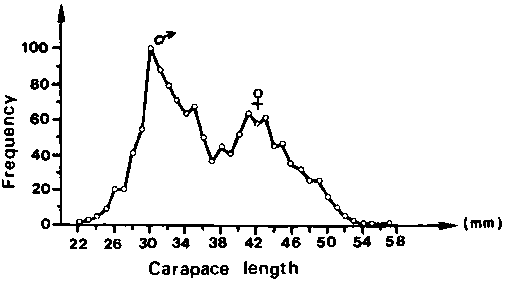
Fig. 9 - Percentage size composition of catches in Gabonese waters (after Fontana and Bâ, 1972)
Fig. 10 - Evolution of mean length of female P. duorarum in the Keta and Sakumo lagoons (Ghana)
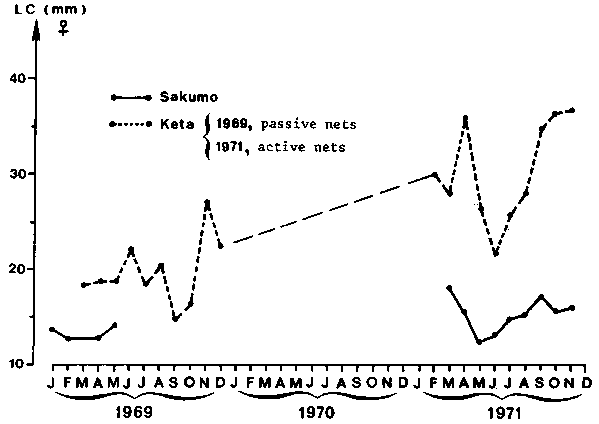
The lagoon artisanal fishery did not develop until 1967. This fishery rapidly developed from 1969 to 1974 and, perhaps, subsequently. Production model is not, therefore, applicable to the uncorrected catch and effort data. The combined use of production model, as well as structural model and simulation techniques, enabled Garcia (1978) to overcome this difficulty. It has thus been possible to evaluate the marine stock, without the lagoon fishery on the one hand and for various levels of exploitation of the latter on the other hand.
The following results were obtained without considering the lagoon fishery:
|
Maximum values (MSY) |
|
|
|
|
|
Average maximum potential catch |
1 295 t |
|
Corresponding effort |
3 571 fishing days (250 HP shrimp boat) |
|
Corresponding cpue |
362 kg/fishing day |
|
|
|
|
Optimum values (F0.1) 1/ |
|
|
|
|
|
Average optimum potential catch |
1 260 t |
|
Optimum effort |
2 810 fishing days (250 HP shrimp boat) |
|
Corresponding cpue |
448 kg/fishing day |
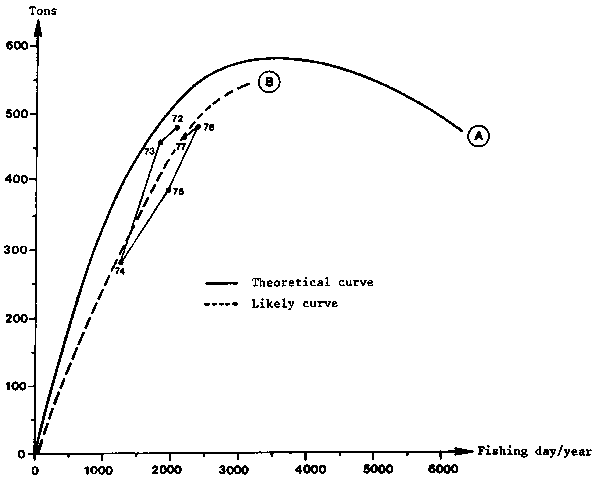
1/ The optimum exploitation level is arbitrarily defined as one for which the marginal catch rate (increase in catches for an increase in effort by one unit) is equal to 1/10 of the catch per unit effort on the virgin stock (Gulland and Boerema, 1973).At the rate of exploitation in lagoon observed in 1973 (55 percent), the maximum catch is 580 tons with a catch rate of 163 kg/day and the optimum catch is 570 tons with a catch rate of 202 kg/day. The corresponding theoretical yield curve at sea is represented on Figure 11 (Curve A). On the same figure have been represented the catch-effort figures observed since 1972 (a date which can be considered to mark practically the end of the expansion of the artisanal fishery). All the points are clearly below the theoretical curve; the curve (B) fitting these points has been traced in dots. The difference between these two curves amounts to 75 tons; it could mean that the level of exploitation in the lagoon has slightly increased since 1973. This assumption is confirmed by the fact that average catches in lagoon increased from 490 tons in 1972 and 1973, to 680 tons from 1974 to 1977.
Fig. 11 - Theoretical yield curve (Fox’s model) at sea for a lagoon exploitation rate of 55 percent (1973 level) and observed catches from 1972 to 1977 in the Ivory Coast
In the light of the latest data available, it thus appears that the preceding evaluation should be reduced by about 30 percent, i.e.:
|
Maximum catch |
505 tons |
|
Corresponding cpue |
142 kg/day’s fishing |
|
Optimum catch |
495 tons |
|
Corresponding cpue |
176 kg/day’s fishing |
Table 5
CATCHES AT SEA AND FISHING EFFORT IN IVORY COAST
|
|
1972 |
1973 |
1974 |
1975 |
1976 |
19.77 |
|
Catch |
477 |
457 |
278 |
387 |
480 |
460 |
|
Effort (day’s fishing), 250 HP shrimp boat |
2 053 |
1 846 |
1 244 |
1 946 |
2 410 |
2 203 |
|
Cpue (kg/day’s fishing) |
232 |
248 |
223 |
199 |
199 |
209 |
The Group did not have sufficient statistics at their disposal to make a conventional evaluation. If one assumes that the two neighbouring areas have similar productivity, one can make comparisons with the fishery in the Ivory Coast. In the absence of artisanal fishery, the productivity of Ivorian grounds is 1 296 t/390 mi2. The area of the Ghanaian fishing grounds being 200 mi2, their potential is supposed to be about 600 t. From this same principle, and comparing Ghana’s fishing grounds with those of the Tortugas, Jones (1970) estimated 410 t as the potential catch of the first sector. However, according to the few fragmentary data available (Appendix 4), the abundance of P. duorarum in Ghana is supposed to depend narrowly on the artificial opening of the Kera lagoon. This lagoon appears to be definitively closed and, ever since, the successive bankruptcies of shrimp boat owners indicate that the stock may be insufficient to allow commercial exploitation.
The total absence of catch statistics relative to Togolese fishing grounds allows only an indirect approach by comparison with Ivory Coast. The area considered for the fishing grounds is 90 mi2 but perhaps this value may be overestimated. With a productivity similar to that of Ivory Coast, the maximum potential in the absence of artisanal fishery is assumed to be about 300 t. If there exists an artisanal fishery, which is likely, the marine stock potential is assumed to be low.
The major part of the shrimp resources of the whole sector is located in this area. The fishing grounds of the three fleets overlap considerably. Only statistics for the Nigerian fleet were available (Bayagbona, 1976). The catch per unit effort calculated by this author for the Nigerian fleet tend rather to increase from 1970 to 1974 (220 to 240 kg/sea-day) despite a doubling of the effort (4 000 to 8 000 days at sea). The author infers that the stock may not be fully exploited.
Garcia and Lhomme (1977) re-examined this preliminary conclusion and observed that the 1970/1974 average cpue was 220 kg/day. This value is significantly lower than catch rates obtained for lower levels of exploitation on the grounds off St. Louis, Senegal (532 kg/day in 1966/67), Roxo-Bissagos (700 kg/day in 1967/68), Sierra Leone/Liberia (554 kg/day in 1970/71) and off Ivory Coast (435 kg/day in 1969). Besides, catch rates observed these last years in Nigeria are lower than the cpue corresponding to the average maximum catch in other sectors: 276 kg/day off St. Louis, 339 kg/day off Roxo-Bissagos, 380 kg/day off Sierra Leone/Liberia and 367 kg/day off Ivory Coast (this last value implies a non-existent lagoon fishery; in reality, with 55 percent of lagoon exploitation, the present catch rates of the fleet are about 200 kg/day). If one assumes that the average composition of the Nigerian fleet is comparable to that of the other areas and if one takes into account the fact that the effort is expressed in days at sea and not in days fishing, the correction to be made to the Nigerian cpue would most likely be below 30 percent, which would reduce it very considerably to the level of the cpue that correspond to the maximum yield of neighbouring stocks. Following these observations, no substantial increase in yield should therefore be expected from this stock.
The reconstructed statistics for Cameroon, using Everett’s data (1978), are interesting:
|
Year |
Number of boats |
Catch |
cpue |
cpue |
|
1970 |
10 |
(295) 1/ |
260 |
|
|
1971 |
10 |
859 |
379 |
85.9 |
|
1972 |
10 |
1 018 |
398 |
101.8 |
|
1973 |
13 |
972 |
342 |
74.6 |
|
1974 |
17 |
1 114 |
291 |
65.5 |
|
1975 |
17 |
1 001 |
267 |
58.9 |
|
1976 |
? |
882 |
222 |
? |
|
1977 |
? |
831 |
? |
? |
1/ Incomplete dataThe cpue expressed in tons/boat/year or in kg/day at sea decreased significantly from 1971 to 1976. The catch rates indicated are close to those observed at present on the other grounds off West Africa. This set of data thus appears to reflect better the evolution of the stock and its exploiting than the Nigerian set.
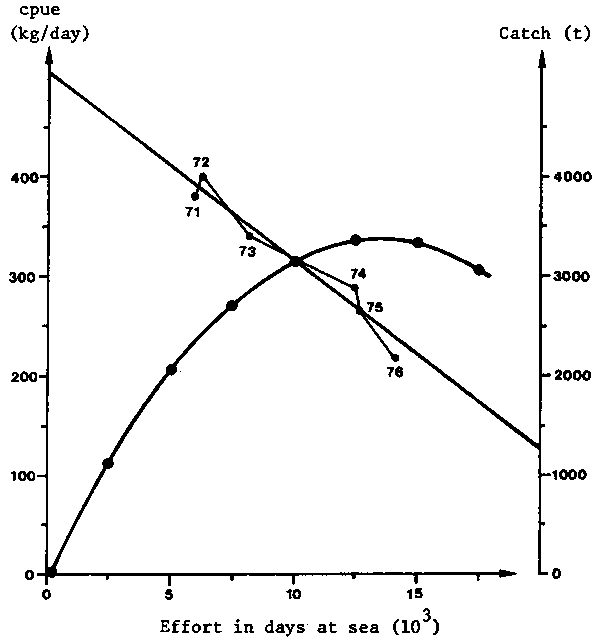
The Cameroonian cpue series were used to calculate total effort because the three fleet fish frequently on the same grounds:
|
Year |
Cameroon cpue |
Total catch Benin-Nigeria-Cameroon (t) |
Estimated total effort (d) |
|
1971 |
379 |
2 251 |
5 939 |
|
1972 |
398 |
2 481 |
6 234 |
|
1973 |
342 |
2 796 |
8 175 |
|
1974 |
291 |
3 637 |
12 498 |
|
1975 |
267 |
3 377 |
12 648 |
|
1976 |
222 |
3 099 |
13 959 |
|
Maximum values (MSY) |
|
|
|
|
|
Average maximum potential catch |
3 370 t |
|
Corresponding effort |
13 400 days at sea |
|
Corresponding cpue |
250 kg/day |
|
|
|
|
Optimum values (F0.1) |
|
|
|
|
|
Average optimum potential catch |
3 340 t |
|
Corresponding effort |
12 200 days at sea |
|
Corresponding cpue |
274 kg/day |
IMPORTANT REMARK
Scattered information suggest that the grounds of the area have been sporadically exploited by fleets which do not make their data available. Although this exploitation remained marginal, there is a risk that the total catch statistics used could be appreciably underestimated and the same holds true, consequently, for the potential catch calculated above.
5.5 Gabon
The statistics available are inadequate. The hydrography of the region is too unusual to make an indirect evaluation by comparing with fishing grounds further north. Commercial surveys made in 1969 by a single 650 HP boat (Fontana and Bâ, 1972), concluded that an average annual catch rate of 23 kg/h (heads-on shrimps) was possible, which corresponds to about 15 kg/h for a 250 HP shrimp boat (Garcia, 1977). The catch rate is low for a still virgin stock and indicates a limited potential in the range of 150 to 300 t.
Fig. 12 - Production model for the Benin-Nigeria-Cameroon stocks
For the marine stocks extending from Cape Palmas (Ivory Coast) to Angola, two assessments have been made, either by applying a production model or by combining a structural and production model. These assessments concern stocks of Ivory Coast and those from Benin to Cameroon. The potential of shrimps of Congo and Angola is considered negligible and the stocks of Ghana, Togo and Gabon small. Nothing is known about resources of Equatorial Guinea.
The assessments made thus concern two of the most important stocks in the sector. The assessments made for Ivory Coast are the results of a comprehensive study of the life cycle of the species from 1968 to 1975. They should, therefore, be considered as reliable. The analysis made by the Working Group with recent data has led to a correction (-13 percent) of the marine potential calculated by Garcia (1978).
On the other hand, the data concerning the Benin-Nigeria-Cameroon stock should, for various reasons, be treated with caution:
- the Group has treated as a whole the data relative to exploitation throughout this vast area where more than one stock can be found;The various assessments obtained with the data available to the group are summarized in the following table:- the exploitation of the various unit stocks in this area by the three national fleets is certain to have been carried out according to a plan that has varied from one year to the other in an unknown way; the consequences of this fact on the assessment are difficult to determine;
- the total catch is not known with accuracy and it may be slightly underestimated;
- the Cameroonian cpue has been used as a index of abundance for the whole of the stock, although the activity of this fleet may not be uniformly spread over the whole area.
|
Countries |
|
Catch (t) |
|
|
|
|
Ivory Coast |
495 |
435 |
2 810 |
2 810 |
0.78 |
|
Ghana |
(400-600) 1/ |
10 |
7 |
negligible |
? |
|
Togo |
(300 max) 2/ |
7 |
7 |
negligible |
? |
|
Benin |
3 340 |
3 240 |
12 200 |
13 200 |
1.09 |
|
Nigeria |
3 340 |
3 240 |
12 200 |
13 200 |
1.09 |
|
Cameroon |
3 340 |
3 240 |
12 200 |
13 200 |
1.09 |
|
Equatorial Guinea |
? |
? |
? |
? |
? |
|
Gabon |
(150-300) 3/ |
nil |
? |
nil |
? |
|
Congo |
negligible |
? |
? |
nil |
? |
|
Angola |
negligible |
? |
? |
nil |
? |
|
TOTAL |
4 700-5 000 3/ |
? |
? |
? |
? |
1/ Valid only if lagoons are maintained open to sea.In conclusion, it appears that the stock of the Ivory Coast could bear an increase in fishing effort of about 20 percent. But the stock of Benin-Nigeria-Cameroon appears to be fully exploited at the present time. This conclusion contradicts that of the third Session of the CECAF Working Party on Resources Evaluation (Rome, February 1976). The Working Party recommended, after examining only Nigeria’s data, an optimum fleet of 100 boats. The evaluation of the optimum effort calculated by the group (12 200 days) corresponds actually to the activity of 50 boats operating about 245 days at sea/year each.2/ Indirect assessment by comparing area - valid in the absence of artisanal shrimping (unlikely).
3/ Rough evaluation.