![]()
![]()
![]()
by
| R.H. Gedrey | Yuang C. Shang |
| FAO Engineering Consultant | FAO Economic Consultant |
H.L. Cook
FAO/UNDP Team Leader
Coastal Aquaculture Project
Gelang Patah, Johor Bahru, Malaysia
| ABSTRACT |
| This is a case study to compare costs and management factors involved in a tidal water exchange aquaculture farm production system and a pumped water system. Two comparable farm production systems were analysed for lands on or adjacent to the Brackishwater Aquaculture Research Station at Gelang Patah in Johor Bahru, Malaysia. The study shows that a pump system offers many advantages in terms of lower costs and higher productivity. It also offers an important alternative to use of environmentally sensitive low elevation mangrove swamp areas for fishponds, by making possible use of land at higher levels. |
The development of traditional brackishwater tidal pond culture of shrimp and fish at the Brackishwater Aquaculture Research Centre in Gelang Patah, Malaysia has encountered some problems. The major problem is acidic rainwater runoff from the dikes to the ponds which lowers the pond water pH causing mortalities and retarding growth. The acidic runoff has a heavy load of dissolved iron. When this runoff mixes with higher pH pond water, the iron is no longer soluble and forms a floc or precipitate which coats the gills of shrimp resulting in their death. A lesser problem is entry of dissolved acid/iron from dike pore water during draining and refilling the ponds with tidal water. There is also some addition of acid/iron by seepage through the dikes. The problems associated with acid/iron can be attacked on two fronts (Cook, 1982).
(a) Elimination or reduction of the amount of acid/iron entering the pond. This can be accomplished by decreasing the surface area of the dike in relation to the volume of water in the ponds by:
The primary problem of accomplishing (i) and (ii) involves the elevation of the pond bottom. For pond construction, the earth excavated must either be put into large dikes or removed from the site. Large dikes reduce the effective area of the pond and increase the acid sulfate runoff into the pond. Removal from the pond site is costly. When ponds are constructed with the pond bottom too low, it is not possible to drain them. This makes harvesting difficult. If ponds are built with a higher bottom level, less excavation is required, but the supply of water by tidal action becomes inadequate. Water can be pumped into such ponds, but this would mean increased operating costs to pay for the cost of pumping. Increasing the size of ponds sufficiently to have an ameliorating effect (iii) might be difficult without also increasing the size of the dikes and increasing the number of sluice gates. The best way to reduce the fluctuation in water level (iv) is probably by using pumps.
(b) Minimizing the effect of acid/iron once it has entered a pond. The best way to reduce problems with acid/iron in a pond is to dilute it by exchanging a portion of the water in a pond. In tidal ponds, this is not always possible at the time required. Frequently it rains just after the ponds have been filled and water can not be exchanged until the next tidal cycle which is 12 hours later. Sometimes after very heavy rains, salinity in the inflow water is too low to permit change of water without killing the species in the pond. More commonly, when the heavy rains fall during neap tides, it is only possible to exchange a small percentage of water in the ponding system.
The previous discussion indicates that pumping may be a better alternative than relying on tidal water exchange. Ponds relying on pumping may not require wide dikes and may cost less for construction. Pond water can be exchanged almost any time it is necessary. Pumping, however, raises operating costs. This may be more than offset by reduced construction costs and by increased production. The comparative economics between tidal and pumped culture systems have not been previously studied.
The major objective of this study is to make a comparative assessment of costs and benefits of a tidal versus a pumped brackishwater fishpond culture system in Malaysia.
First, both tidal and pumped-operated pond culture systems were designed on land located at or near the Brackishwater Aquaculture Research Center, Gelang Patah, Johor Bahru. Second, detailed costs of construction and pumping were estimated and calculated based on the best information locally available. Contacts were made with fishpond contractors, equipment dealers, commercial banks, and government officials. Finally, an economic analysis was made.
A team was organized by the Food and Agriculture Organization (FAO) comprising the following three experts:
Robert H. Gedney, Consultant Engineer
Yung C. Shang, Consultant Economist
Harry L. Cook, Team Leader, FAO/UNDP Coastal Aquaculture
Development Project at Gelang Patah, Johor Bahru
The time available for this study was one month (October 23 to November 21, 1982).
The team wishes to express its appreciation to many people who have helped this study, particularly to those listed in Appendix 1.
The consultant economist was also requested to write a short document on pond record keeping and analysis. It is included in Appendix 2.
The layout and cost studies in this report are of reconnaissance or pre-feasibility coverage. They are not intended as suitable for a feasibility evaluation of production benefits relative to construction and operational costs. However, they are valid for the comparisons of direct construction costs and engineering features of the two different types of shrimp farm pond production systems described in the report.
The study presents engineering measurements basically in the English system, with SI (metric) equivalents, mainly because English units are the basis of existing maps and are in common use for construction in Malaysia.
Tidal data for the site at Gelang Patah were available from preceding studies used in planning the existing research station at Gelang Patah.
Briefly, the tides at the station were related to tides at Victoria Dock in Singapore. The tides are diurnal and include pronounced neap and spring tide characteristics. Because land surveys were in feet with a mean sea level (MSL) datum and tidal reference material is in meters related to a mean lower low water (MLLW) datum, it was necessary for the study to use tidal elevations in feet also referred to MSL. Reference tidal elevations for the study are:
| Highest actual tide, HAT | = + 9.9 | ft (3.0 m) |
| Mean higher high water, MHHW | = + 8 | ft (2.4 m) |
| Mean higher low water, MHLW | = + 4 | ft (1.2 m) |
| Mean lower high water, MLHW | = + 0.5 | ft (0.15 m) |
| Mean lower low water, MLLW | = - 1.5 | ft (0.46 m) |
Figures 1 and 2 show tidal occurrences at the site of the projects studied.
Figure 3 shows the sites developed for the pumping and the tidal exchange plans. The pumping plan site is on relatively high grounds northeast of the station, with elevations varying from + 6 ft (1.9 m) to 9 ft (2.7 m). The river (Sungai) at Gelang Patah is located along the northern boundaries of the sites.
The tidal exchange plan is identical in location with the ponds of the present Research Station at Gelang Patah. The ground elevations vary from about 1 ft (0.30 m) to a little above + 6 ft (1.8 m).
It was not necessary for this study to make an absolute evaluation of engineering considerations such as slope stability, consolidation and compaction factors and construction costs. The reason is that these aspects are being considered only on a comparative basis between the two plans studied and therefore the important matter is consistency between the studies.
2.4.1 Slopes, compaction and consolidation
A stable side slope of 1 on 2 was used for all embankment and cut slopes. An allowance of 20% was made for compaction and consolidation of earthwork from excavation to embankment.
Fig.1 TIDAL PARAMETERS (Sheet 1 of 2)
Fig.2 TIDAL PARAMETERS (Sheet 2 of 2)
Fig.3 GENERAL LOCATION PLAN
2.4.2 Costs1
Cost data for estimating purposes were obtained from a consulting firm in Singapore which is now in the process of constructing a large shrimp farm in Johor. In addition, a discussion of costs was held with a farm contractor on local costs of fishpond construction. From the above discussions, the following prices were derived for use in this study:
Land clearing, M$600/acre (M$1,500/ha) for machine clearing;
Excavation, M$3.00/cu.vd (M$3.92/cu.m) for single cast dragline excavation, assuming a 40 ft (12 m) radius of operation or a total of 80 ft (24 m) movement for single handling;
Excavation, M$5.00/cu.yd (M$6.53/cu.m) when double handling of excavated materials is required, i.e., the total casting exceeds 80 ft (24 m);
Piling costs are M$20/piece of Bakau (mangrove) piling, of 5 inch (12.7 m) diameter driven in place (subsequently it was learned that this price might only be M$10/piece);
Ordinary concrete in place including reinforcement, aggregate, cement and forming M$350/cu.yd (M$458/cu.m); concrete with heavy reinforcement and complex forming M$650/cu.yd (M$850/cu.m).
2.4.3 Pond effectiveness
The pond effectiveness is the ratio of water area for production to gross area of land required for a pond, or

This is a valuable measure to determine the extent of waste area in a pond system, particularly when overbuilding of dikes is necessary to dispose of excess excavation from pond construction.
2.4.4 Freeboard
The perimeter dike in each plan has a minimum elevation of + 11.5 ft (3.5 m), a freeboard of about 1.5 ft (0.5 m) above the HAT of + 9.9 ft (3.5 m) of the river. The perimeter dike may be higher if required to maintain pond freeboard, or because a higher elevation is needed to facilitate use of the dike for excess pond excavation.
The ponds were all considered to have a 2.6 ft (80 cm) operating depth in the main body of the pond and a 2 ft (0.6 m) freeboard requirement for any of the pond dikes. This was rounded to a minimum required height of any dike, of 4.5 ft (1.4 m) above the pond bottom.
The site used for the tidal study is the same area as the ponds occupy for the Gelang Patah Research Station, as shown in Figures 3 and 4. However, the study plan is based on the area being developed as 10 production ponds of about one hectare size. The study omits consideration of nursery ponds for both the tidal and pumping plants. A general contour map was available from a previous planning study for the Station.
As indicated by Figure 4, the ponds generally ranged from an average high ground elevation of + 5.5 ft (1.68 m) to + 3.5 ft (1.07 m). Spot elevations of + 1 (0.31 m) were shown on the base map, but disregarded for this study. The elevations represented are typical of many mangrove swamp areas.
The tidal plan pond analysis was made by analyzing excavation and embankment needs of Pond No. 1, which has the highest average ground elevation of + 5 ft (1.5 m) to + 6 ft (1.8 m) and Pond No. 8, which has the lowest elevation of + 3 ft (0.9 m) to 4 ft (1.2 m). All of the ponds in the tidal study have a bottom elevation of + 1 ft (0.3 m), this having been established by actual construction and operation of the Research Station ponds as the highest practicable elevation for filling the pond during neap tides and also the lowest to obtain acceptable drainage.
A series of trial and error analyses were made to balance excavation and embankment. The volumes of excavation1 for each pond studied were:
| Average natural | ||
| ground elevation | Excavation | |
| Pond No. 1 | + 5 ft to + 6 ft | 16,600 cu.yd (12,699 cu.m) |
| (1.5 m to 1.8 m) | ||
| Pond No. 8 | + 3.5 ft (1.1 m) | 12,500 cu.yd (9,562 cu.m) |
Figures 5 and 6 illustrate typical cross-sections for each pond and show demonstratively, by the large areas of cross hatching, the surplus excavation which went into embankment.
1 The excavation includes a 20% loss for shrinkage and compaction when placed in embankment.
Fig.4 TIDAL PLAN POND LAYOUT
Fig.5 POND SECTIONS FRO NATURAL GROUND AT EL +5(1.5) TO +6(1.8) TIDAL POND NO.1
Fig.6 POND SECTIONS FOR NATURAL GROUND AT EL.+ 3.5'(1.1) TIDAL PLAN-POND NO.8
In considering Pond No. 1, and to make a general case, no allowance was made for excavation which could have been disposed of in the old river channel.
Each of the ponds was considered to have separate inlet and outlet structures. Cost-wise each pond was prorated 1/10 the cost of a common headworks.
The inlet and outlet structures were 3 ft × 3 ft (0.92 m) × (0.92 m), reinforced concrete box culverts on Bakau piling. The size of structure required was derived from actual operating experience of the Research Station. Headgates and screening are included.
The headworks for the pond complex was a reinforced, concrete box culvert 5 ft (1.5 m) wide by 4 ft (1.2 m) high, on Bakau piling. Two side by side headgates are provided at the culvert entrance, along with provisions for screening.
An important factor which influenced the pond costs was the necessity of handling the excavation twice in order to place it in embankment. The outside width of the tidal ponds is 334 ft (102 m). The single handling limitation of draglines ordinarily available is about 160 ft (49 m) (2 passes of 80 ft) and therefore a double handling charge of M$2.00/cu.yd: (M$2.61/cu.m) is added to the basic excavation cost of M$3.00/cu.yd. The summarized cost estimates, Table 1, are:
Table 1. Construction costs - tidal ponds
| Item | Unit | Quantity | Unit cost | Cost |
| Pond No. 1 - Natural Ground Elevation + 5 ft to + 6 ft | ||||
| Excavation | cu. yd | 16,600 | M$ 5.00 | M$ 83,000 |
| Inlet structure | each | - | - | 25,000 |
| Outlet structure | each | - | - | 25,000 |
| Prorated headworks | each | 1/10th | - | 2,500 |
| T O T A L | M$135,500 | |||
| Pond No. 8 - Natural Ground Elevation + 3.5 ft | ||||
| Excavation | cu. yd | 12,500 | M$ 5.00 | M$ 62,500 |
| Inlet structure | each | 1 | - | 21,000 |
| Outlet structure | each | 1 | - | 21,000 |
| Prorated headworks | each | 1/10th | - | 2,500 |
| T O T A L | M$107,000 | |||
The overall dimensions of the 10 pond area are 380 m × 510 m to yield a total area of 19.4 ha. Each pond has an overall area of 1.94 ha. By reference to Figures 5 and 6, it is evident that the effectiveness of Ponds 1 and 8, i.e., the ratios of water area to gross area, are:

Water area = 1.14 ha
Water area = 1.30 ha
As a basis for further economic studies, the costs per hectare of Ponds 1 and 8 are:
A 15 unit pond development based on a pumped water supply was prepared for a site just north and east of the Gelang Patah Research Station, as shown by Figures 3 and 7. The principal difference between the tidal and pumping plans is that land elevations of the pump plan ponds range from + 6 ft (1.8 m) to + 9 ft (2.7 m), about 3 to 5 ft (0.9 to 1.5 m) higher than the tidal pond elevations. The varying land elevations can be accommodated in a pumped water supply by pumping to the highest level and using simple drop structures in the water supply canal to accommodate each lower level. Thus, the plan becomes more like an irrigation project with a water supply to the highest elevation and gravity flow to successive lower levels.
The total land requirement for the project is 14.7 ha. The ponds range in overall gross area from 0.6 to 1.4 ha. The smaller ponds could have been made larger by omitting some dikes dividing the ponds. This was not done in order to minimize land levelling costs. The overall requirements, operating depths and minimum freeboard were the same as for the tidal ponds.
Fig.7 PUMPING PLAN POND LAYOUT
Requirements of the pumping plan were that a minimum of 20% pond water volume should be changeable each day; that adequate reserve pumping capacity be available; and that the pumps be fully usable any time the tide level was at + 2 ft (0.6 m) or higher. This latter requirement makes at least 5 to 7 hours of pumping time available during the most critical neap tides and usually much more of the time.
Based on the 20% volume water change requirement, a 7-hour pumping period and an assumed 75% pond effectiveness factor (see para. 4.7) the required pump size would be:
| Volume to be pumped per day | =14.7 × 0.75 m × 0.8 × 10,000 × 0.2 |
| =17,640 cu.m |
Because the pumps considered were commercially rated in gallons per minute (GPM), the corresponding pumping capacity for a 7-hour period would be:

Liters per minute = 42,638
Therefore, use two 6,000 GPM pumps, plus one spare equals three 6,000 GPM pumps (22,740 1/m).
The range of heads to be encountered are:
Maximum static head, SHmax. = Pond elev. - tidal elev. (See Figs. 10 & 11)
SHmax = (+ 9) + 2.6 - (+ 2) = 9.6 ft (2.9 m)
SHav. = (+ 9) + 2.6 - (+ 4.8) = 6.8 ft (2.1 m)
Where + 4.8 ft is the average tidal elevation between MHHW and MLLW.
Assume 15 inch diameter outlet pipes, velocity head hv,
Friction loss for say 75' outlet pipe is about
| Total Dynamic Head TDHmax. | = SHmax. + hv + hf |
| = 9.6 + 2.5 + 1.9 | |
| = 14 ft (4.3 m) | |
| TDHav. = 6.8 + 2.5 + 2.9 | = 11.2 ft (3.4 m) |
Because of the high volume of flow and low head, a propeller type pump is required. Worthington Pump, 14 KLD, 1170 RPM, with characteristics indicated by Figure 8 was used. At the average head of 11.2 ft (3.41 m), the flow is about 6,500 GPM.
From Figure 8 and also by separate computation, a 25 to 30 horsepower engine is indicated. The Lister Stationery, air cooled diesel, Model HR3, described in Figure 9 would be satisfactory both with respect to power and speed.
A total of 3 pumps is proposed. Any two used over a 7-hour period would satisfy the project requirements. The flexibility of a third pump would provide a spare, as well as additional capacity, if needed for emergencies.
Figure 9 shows a fuel consumption curve in terms of grams per brake horsepower hour. For the 2 pumps selected, the fuel consumption for each would be 180 g/bhp/hr. Therefore, fuel consumption for 7 hours at 850 g/liter would be:

say 80 liters per day.
The pumping plant is shown in plan by Figure 10 and in detail by Figure 11. The plant consists of an 18-inch (50 cm) reinforced concrete slab base supported by Bakau piling. The load would be less than 1,000 pounds (455 ko) per pile, which is acceptable. The base would support 8–12 inch (30 cm) diameter reinforced concrete columns, which in turn support a 12-inch (30 cm) reinforced concrete slab deck which would support the pumps, motor and a sheltering building.
Each pump would discharge to the water supply canal. The discharge pipes could be either a 15-inch (38 cm) diameter asbestos cement pipe, structurally supported, or a 16-inch (41 cm) diameter steel pipe. Each pipe would have a flat valve to prevent backflow.
VERTICAL PUMP OPERATION, DENVER, COLORADO
| SPECIFICATION | 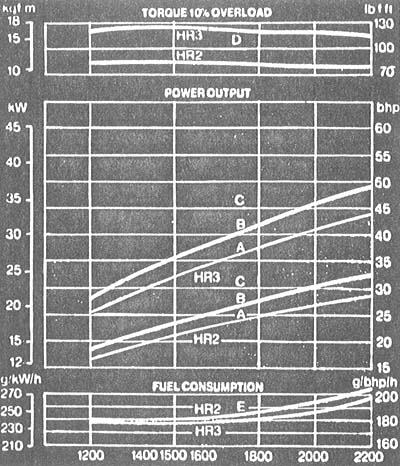 | |||||||||||||||||||||||||||||||||
| The Lister HR2 and HR3 air cooled diesel engines are available in 18 basic builds with a variety of easily added accessories to suit most applications. The maximum continuous rating is 29.5 bhp (22.0kW) for the HR2 and 44.25 bhp (33.0kW) for the HR3 at 2200 rev/min. | ||||||||||||||||||||||||||||||||||
| Cooling: Air cooling by flywheel mounted fan at all ambient temperatures up to 52°C (125°F). | ||||||||||||||||||||||||||||||||||
| Lubrication: A rotary pump supplies oil under pressure to all important bearing surfaces. Each engine is fitted with a full flow filter with replacable element. | ||||||||||||||||||||||||||||||||||
| Governing: Class A2 or Class B, according to build and application. | ||||||||||||||||||||||||||||||||||
| Crankcase: Cast iron of robust design. | ||||||||||||||||||||||||||||||||||
| Starting: Hand starting by means of a detachable handle on the Crankshaft extension. Electric starting is available at extra cost. | ||||||||||||||||||||||||||||||||||
| Power Take-Off: Full power may be taken from the flywheel end and from the gear end for approved applications. |
| |||||||||||||||||||||||||||||||||
| Rotation: Anti-clockwise looking on the flywheel. | ||||||||||||||||||||||||||||||||||
TECHNICAL DATA | RATING. BS 649/1958 (and Din 6270) This is the bhp which the engine is capable of delivering continuously at a stated crankshaft speed in accordance with the conditions specified in BS 649/ 1958 (Din `A'). The engine shall be capable of satisfactorily providing an output 10% in excess of the BS continuous rating at the same speed for one hour in any period of twelve hours consecutive running (Din `B') unless driving centrifugal water pumps, fans and other similar equipment when overload is not permitted. | |||||||||||||||||||||||||||||||||
| Power Output: | ||||||||||||||||||||||||||||||||||
| ||||||||||||||||||||||||||||||||||
| BMEP at 1500 rev/min: 6.13 bar (88.9 1bf/in2) Bore: 107.95 mm (4.25 in) Stroke: 114.3 mm (4.50 in) Humidity: up to a maximum of 6%.
Lubrication oil consumption: less than 0.75% of full load fuel consumption
|
Note that 10% overload and Din `B' ratings
apply only to a fully run-in engine. This
is normally attained after a period of
approximately 50 hours runnings, but if
specially negotiated, engines can be
supplied delivering these outputs ex works. DERATING. BS 649/1958 Altitude: 3 ½% for every 300 m (1000 ft) above 150 m (500 ft) above sea level. Air inlet temperature: 2% for every 5 ½°C (10°F) above 30°C (85°F). | |||||||||||||||||||||||||||||||||
Fig. 9
ENGINE CHARACTERISTICS: LISTER DIESELS
Fig.10 PUMPING STATION GENERAL PLAN
Fig.11 PUMPING STATION DETAILS
The original land area within each pond is nearly level, or at most has a differential grade of 2 ft (0.6 m). The land would be prepared by clearing and land levelling as needed. In general, the pond bottom soils would have a minimal amount of disturbance. The pond operating depth would be 80 cm, as for the tidal ponds.
The perimeter dike is at a minimum elevation of + 11.5 ft (3.5 m), approximately 1.5 ft (0.5 m) above HAT. The perimeter dikes are higher for ground elevations + 8 ft (2.5 m) and + 9 ft (2.8 m) where a minimum height of dike of 4.5 ft (1.4 m) above the pond bottom is required. The heights of pond dikes and water supply dikes are also governed by the 4.5 ft (1.4 m) requirement. Figure 12 shows diking section details. Because a mobile crane would be used for setting the pumps and engines, a perimeter dike width of 12 ft (3.7 m) is shown at the pumping plant, Figure 10, for connection to a project access road.
The dikes would all be constructed by shallow borrow of excavated pond bottom, or from excavation of drainage canals.
Figure 12 shows that all of the material excavated is used in the embankments. There is no waste excavation and hence the pond effectiveness is higher than for the tidal ponds. Using the example of Pond No. 3, Figure 12, the pond effectiveness is:

Six concrete drop structures are provided to lower the water supply canal bottom from + 9 ft (2.7 m) to + 8 ft (2.5 m) and successively to + 6 ft (1.8 m) in each branch of the water supply canal.
Each pond inlet, for a daily 20% volume change, would be provided by a 12 inch (30 cm) diameter pipe. The inlet would have a concrete structure on the water supply canal side with screens and an adjustable gate control and a concrete headworks on the pond side.
Each pond would have a separate outlet for draining. The structures are a 3 ft (0.9 m) by 3 ft (0.9 m) reinforced concrete box culvert on piling, as for the tidal ponds, but shorter because the embankments are narrower in cross-section.
Fig.12 TYPICAL POND SECTIONS PUMPING PLAN - POND NO.3
The following descriptive material supplements the costs and quantities in the cost estimate for the pumping station, Table 2.
Excavation. The station would be constructed in the dry by excavating with a clam shell, a hole 25 ft × 33 ft (7.6 m × 10.0 m). The hole would be kept dewatered by pumps. Temporary side slopes of 1 and 1.5 were assumed. There would also be some hand excavation for the base slab. Quantities and costs are shown in the estimate.
Piling. An estimated 255 pieces of 5 inch (12.7 cm) Bakau piling would be required under the base slab.
Concrete footing. The footing would be moderately reinforced. Because of the cost of handling of the concrete from the surface to the bottom of the excavation, the unit cost of concrete was increased to M$450/cu.yd (M$588/cu.m).
Columns and deck. The concrete would be heavily reinforced and require supportive framing for the formwork. Accordingly, a unit cost of M$650/cu.yd (M$850/cu.m) was used.
Pumps and engines. The cost of 6,000 GPM (22,740 rpm) pump, Worthington 14 KLD, 1170 RPM, and an HR3, Lister air cooled diesel engine, 1200 RPM, FOB Singapore, was quoted to be US$24,851 or M$57,157. The pump alone was US$15,371, or M$35,353. The quoted cost includes the column gear head and joints and drive to make the engine connection. The pump would have special corrosion resistant fittings suitable for brackishwater usage. No import duty cost was assumed because it is understood that shrimp farming is an exempted pioneer industry.
An allowance of M$19,000 was included to cover transportation to the site and installation. Additional items in the estimate related to the station are a fuel tank, a building to house the engines, an access ramp, the entrance channel and a floating drift collector in the approach channel.
In addition to the Pump Station, the elements described below are included in the Pumping Plan.
Land clearing. A total of 37 acres (14.7 ha) is included for machine clearing.
Land levelling. All of the pond areas would be levelled by bulldozer, or by dozer and scrapers to 4 uniform levels at + 9 ft (2.8 m), + 8 ft (2.5 m), + 7 ft (2.1 m), and + 6 ft (1.8 m). The cost of this land levelling has been estimated on the high side, to be M$87,410, based on the land area and cutting required to level each pond.
Embankments. There is no pond excavation in this project. After land levelling is completed, the pond bottom would be ready to use. Borrow for construction of embankments would be obtained from shallow trenches adjacent to the dikes. The volume of embankment for each dike usage was determined by scaling the lengths from the plan, Figure 7, and using finished grade land elevation.
Other structure. Estimates for other structures are based on criteria in paras. 4.8 to 4.10.
Table 2. Cost estimate for pumping station (Floating Pile Design)
| Item | Unit | Quantity | Unit cost | Cost |
| (M$) | (M$) | |||
| Excavation, machine | cu. yd | 1,202 | 6.00 | 7,212 |
| hand | cu. yd | 30 | 8.00 | 240 |
| Dewatering | lump sum | 60 days | 150/day | 9,000 |
| Piling | piece | 255 | 20 | 5,100 |
| Footing concrete | cu. yd | 27 | 450 | 12,150 |
| Columns and deck | cu. yd | 25 | 650 | 16,250 |
| Pumps and diesel motors | each | 3 | 57,157 | 171,471 |
| Delivery and installation | l.s. | 1 | - | 19,000 |
| Fuel tank (9,000 1) | l.s. | 1 | 3,500 | 3,500 |
| Pump building | × sq. ft | 276 | 30 | 8,280 |
| Ramp | l.s. | 1 | 1,000 | 1,000 |
| Channel excavation | cu. yd | 847 | 4.00 | 3,388 |
| Diesel pipes | 1–15" Æ × 90 ft | 3 | 3,000 | 9,000 |
| Floating drift collector | l.s. | 1 | 2,500 | 2,500 |
| Av | - | - | - | - |
| T O T A L | M$268,090 | |||
The Summary Cost Estimate for the Pumping Plan is shown in Table 3 to be M$696,510. If an effective factor of 75% (para. 4.7) is applied to the gross pond area of 14.7 ha, the pond, water area is 11.0 ha and the cost per ha is:
Table 3. Summary cost estimate
Pumping Plan
| Item | Unit | Quantity | Unit cost (M$) | Cost (M$) | Notes |
| Land clearing | acres | 47 | 600 | 22,200 | - |
| Land levelling | 1 | - | - | 87,410 | Based on average cut in feet over 1 ha |
| Perimeter dike | cu. yd | 24,500 | 3.00 | 73,500 | 6,195 lineal ft. |
| Water supply dike | cu. yd | 12,500 | 3.00 | 37,500 | 2,165 1.f. |
| Interior dikes | cu.yd | 14,500 | 3.00 | 43,500 | 4,908 l.f. |
| Drain outlets | each | 15 | 8,000 | 120,000 | 3' × 3' box culvert of reinforced concrete on piles plus headwall and intake |
| Water inlets | each | 15 | 2,100 | 31,500 | - |
| Pumping station | 1 | See table | - | 268,090 | (38% of total) |
| Drop structures | each | 6 | 2,000 | 12,000 | |
| T O T A L | 696,510 |
1 Separately estimated for each pond and an assumedlevelling capacity of a D-6 bulldozer.
The economic analysis is to determine which type of system, tidal or pumping, is more economical from the view point of cost of pond construction and operation. Two basic economic comparisons are made, namely: average annual operating costs and the difference in break-even production level. These two comparisons complement each other in making certain relevant points.
The economic comparisons in this section are limited to the cost items directly related to pond construction and pumping, which are different in the two culture systems. Those cost items which do not exhibit significant differences between the two systems are excluded in the comparison because they are not important elements in decision-making.
Four major cost items which are different between tidal and pumpoperated systems are included in the comparisons, namely: annual interest and principal payment on pond construction and pumping, maintenance, fuel and land.
5.2.1 Annual interest and principal payment on pond construction and pumping
Studies in Sections 3 and 4 show the following unit costs of construction:
| Tidal plan- | M$82,950/ha of water area for natural ground elevation + 3.5 ft (1.1 m) |
| M$118,860/ha of water area for natural ground elevation + 5 to + 6 ft (1.5 m to 1.8 m) | |
| Pump plan- | M$63,319/ha of water area |
These costs are converted into an annual basis in the form of interest and principal payments.
The current annual interest rate for aquaculture loans charged by local banks is in the range of 12 to 14%. The rate of 12% is used in the calculation. The length of loans is usually based on the borrower's capability for repayment, but is usually less than 15 years. A ten-year loan period is used in the calculation of annual payment. Actually, both the interest rate and the length of loan are not important considerations for the purpose of comparison, as long as the same rate and length of loan are used for both culture systems.
5.2.2 Maintenance
As dikes are smaller, the cost of pond maintenance for pump-operated ponds should be lower than that of tidal ponds. Dikes of pump-operated ponds are from the upper soil strata due to relatively shallow excavation and are less acidic than deeper soils. Also, the height and mass above the pond water surface is less. It is therefore easier to start vegetation growing on the dikes which will in turn reduce erosion. The difference in costs of pond maintenance, however, can not be definitively quantified at this time.
Maintenance of pumps and motors is an important cost item for a pump-operated system. The annual costs of maintenance is estimated at 3% of the purchase price of the first two years of use and about 10% thereafter (personal communication with ACE Equipment PTE, Ltd. in Singapore). The useful life of the pump and engine before major overhaul is estimated at 10 years.
5.2.3 Fuel
The fuel requirement given in paragraph 4.3 is 80 liters per day. At a unit cost of M$0.46/liter, the cost of fuel per day is:
80 × M$0.46 = M$36.60
Annual cost of fuel for the farm year is M$36.60 × 365 = M$13,359. Converting this amount to a per hectare of water area basis:
5.2.4 Land
Since tidal ponds require more lands per hectare of water area than pump-operated ponds, the cost of land per hectare of water area should be higher. In Malaysia, leased land in most of the coastal swamp areas is in the range of M$10 to M$30 per hectare per year. It is, therefore, negligible for economic comparisons.
5.2.5 Comparisons
The data in Table 4 show that the interest and principal payments for the pump-operated system is much less than that of the tidal operated ones. Pumping, however, adds additional costs for fuel and pump maintenance. Still, the total annual operating cost is less for the pump-operated system. Table 4 shows that the difference in costs is in the range of M$1,099 to M$7,275 per hectare of water area, depending on the natural ground elevation of the tidal system. The higher the ground elevation, the more it costs for construction of tidal ponds and consequently, the more benefits which would be realized by using pumps instead of tidal exchange to supply water in the farm.
Table 4. Estimated annual operating cost/ha of water area for tidal and pump-operated system by Major Selected Items
| Tidal Pond | Pumped pond | |||
| Ground elevations | ||||
| + 3.5 ft (1.07 m) | 4.3 ftb (1.31 m) | 5 ft (1.52 m) | ||
| Interest and principal paymenta | M$14,860 | M$17,859 | M$21,036 | M$11,106 |
| Maintenance of pumps | - | - | - | 1,340 |
| Fuel | - | - | - | 1,215 |
| T O T A L | M$14,860 | M$17,859 | M$21,036 | M$13,761 |
a Interest and principal payment on the unit cost ofconstruction per ha.
b) The average of + 3.5 ft (1.06 m) and + 5 ft (1.52 m)ground elevations.
Since only the cost items directly related to pond construction and pumping are considered here, it is not possible to calculate the breakeven production level without the consideration of other cost items, which it is assumed have no significant differences between the two culture systems1. The break-even production level is defined as the level of production, given the unit price of output, that just cover the total cost of operation with zero profit.
With the given costs directly related to pond construction and pumping for tidal (Ct) and pump (Cp) operated systems, as shown in Table 4, and unit price of output (P), the difference in break-even production level between the two culture systems (Qt - Op) can be calculated as:
Difference in break-even production level
A price of M$13 per kg of shrimp is used in the calculation. Again, the level of price used is not an important factor as long as the same price is used in calculation for both systems. Table 5 shows the difference in break-even production is in the range of 84 to 559 kg/ha of water area depending on the natural ground elevation of the tidal ponds. This means that the break-even production level for pump-operated ponds can be 84 to 559 kg lower than for tidal-operated ponds. In other words, with the same level of production per unit of water area for both culture systems, a pump-operated system is about 84 to 559 kg/ha better off than the tidaloperated system. This does not take into account the fact that production in the tidal system would probably be appreciably lower due to acid rain runoff or that the production in the pumped system could be substantially higher due to its providing better management capability.
Table 5. Difference in break-even production between tidal and pumped-pond per hectare of water area
| Break-even production | |
| Tidal pond | |
| 3.5 ft (1.07 m) natural ground elevation | M$14,860 ÷ M$13 = 1,143 kg/ha |
| 4.3 ft (1.31 m) natural ground elevation | M$17,850 ÷ M$13 = 1,374 kg/ha |
| 5.0 ft (1.52 m) natural ground elevation | M$21,036 ÷ M$13 = 1,618 kg/ha |
| Pumped pond | M$13,761 ÷ M$13 = 1,059 kg/ha |
| Difference in break-even production | M$84 to 559 kg/ha |
The two economic comparisons indicate that a pump-operated system is more economical than a tidal-operated system. This conclusion is based only on the savings in costs of construction and operation, without considering the other management benefits of a pump-operated system which are difficult to quantify at this time.
The main purpose of this study is to assess the costs and benefits of tidal versus pumped pond aquaculture systems. Farm pond layouts for both types of culture systems were designed on adjacent lands located at the Brackishwater Aquaculture Research Center at Gelang Patah, Johor Bahru. Detailed costs of construction and pumping were estimated based on the best information available from fishpond constructors in the area, equipment dealers, commercial banks, and government officials.
The study demonstrates that it costs much less to construct a pumped pond system rather than a tidal-operated culture system because of reduced earthwork costs and reduced control structure costs. Pumping, however, adds a capital cost for a pumping station and an annual operating cost for fuel and maintenance. Two economic comparisons were made, namely: annual average operating costs, and the differences in break-even production. These economic comparisons were limited to the cost items which are different between the two culture systems. Cost items which would have no significant differences between the two culture systems were excluded for comparison purposes. The results of the economic comparisons all favour a pumping system because of the relatively low annual operating costs. The easier construction of ponds and reduced time for construction at a higher elevation, which is possible in a pump system, are only partially recognized by the construction costs in the study. Another factor not considered is that large-scale procurement of pumps and engines could result in more favourable costs than the single units costed for the study.
In addition to the savings in costs for pond construction and operation, other benefits of a pump-operated system, such as better land utilization, more efficient pond management, and less acid runoff should not be neglected even though they are difficult to quantify at this time.
Land utilization. Because of the relatively narrow dikes of a pump-operated system, more land is effective for actual rearing. The water area for a given size of farm would be larger than for a tidal operated system and the costs of construction per unit of water area would be less. Based on the pond design in this study, the water area of a pump-operated system is about 75% of the gross area, compared to about 59 to 67% of a tidal-operated system, depending on natural ground elevations. Greater water area results in increased production.
Land that otherwise could not be considered for aquaculture using a tidal system can be utilized if water is pumped. Farmers are now utilizing the lowest areas adjacent to the sea or rivers. This is the portion of the mangrove swamp environment which is most important as a nursery for natural stocks of fish and shrimp. With the use of pumps, the higher, and more distant land areas which are of much less importance to the natural fishery can be put into aquaculture.
Pond management. With the pumping system, pond filling, draining and harvesting can be done at almost any time it is necessary and does not have to wait for high or low tide. The farm can be managed more efficiently. More frequent filling and draining is likely to improve water quality in the pond. A higher stocking rate, better growth and survival, and, consequently, a higher production appears possible. Also, labour management would be much easier. Harvesting would not have to be done during the limited time of low tide and a large temporary labour force for harvesting is not necessary.
Acid sulfate. Small dikes reduce surface area for acid sulfate runoff. This is likely to improve the water quality of the pond and, consequently, increase the production level.
Although most of the above-mentioned benefits are difficult to quantify at this time without adequate data, they should be substantial in the form of increased production. These benefits together with the savings in costs make the pump-operated system even more favourable.
The major disadvantage of the pump-operated pond culture system is that pumps would have to be imported. This requires foreign exchange. However, most of the locally produced shrimp products would be exported, thus the foreign exchange earned from shrimp export should justify the importation of pumps.
The pond designs and the cost estimates in this report serve primarily as a case study. Actually, both of these elements vary with the topography and ground elevation of the particular site selected, the size of farm for development, the size and shape of ponds to be constructed, and the field conditions of construction. However, the advantages of the pumping system identified in this study should hold and this culture system should be more economical and productive than the present tidal-operated systems used for intensive shrimp culture in Malaysia. Also, as ground elevation and/or pond size increases the benefits of a pumping system should become greater.
Cook, H.L. 1982 Development of a system for brackishwater aquaculture earthen ponds in Malaysia. FAO/UNDP Coastal Aquaculture Development Project at Brackishwater Aquaculture Research Center, Gelang Patah, Johor Bahru, Johor, Malaysia (unpublished note).
Mohamad, Wan and Khoo. 1975 Preliminary report on the engineering aspects of planning, design and construction of Brackishwater Aquaculture Center at Gelang Patah, Johor, Petaling Jaya, Selangor.
Mohamad, Wan and Khoo. 1975 General layout and location plan of Brackishwater Aquaculture Center at Gelang Patah, Johor, Petaling Jaya, Selangor.
Appendix 1
LIST OF PERSONS CONTACTED
| 1. Mr. Henry Abbott | UTG, singapore |
| 2. Edward Scura | Aquatic Farms, Hawaii, a consulting firm |
| 3. Clyde Simon | |
| 4. Mike Yunker | |
| 5. J.M. Shah | ACE Equipment PTE Ltd., Singapore |
| 6. Khor Bina Hoi | Crustacean Enterprises, Johar |
| 7. Si H. Cheran | Malayan Banking Berhad, Johar Bahru |
| 8. Abd Malik Abd Rahman | Bank Pertanian Malaysia, Johar Bahru |
| 9. C.H. Lee | Fishpond Contractor, Johar Bahru |
| 10. Y.T. Chia | Interpreter, Johar Bahru |
| 11. G.L. Yap | Fishpond Owner, Johar Bahru |
| 12. Anton Sebastian | PWD, State of Johare |
| 13. Ti Teow Loon | Senior Fishery Officer, Brackishwater |
| Aquaculture Center, Gelang Patah, | |
| Johar Bahru | |
| 14. Chuah Toh Thye | Fisheries Officer, Brackishwater Aqua- |
| culture Center, Gelang Patah, Johar Bahru | |
| 15. Rosly bin Hassan | Fisheries Officer, Brackishwater Aquaculture |
| Center | |
| 16. Kam Sing Fok | Senior Clerical Officer, Brackishwater |
| Aquaculture Center | |
| 17. Umpol Pongsuwana | FAO Biologist, Brackishwater Aquaculture |
| Center | |
| 18. Somnuk Wechasitt | FAO Master Fish Farmer, Brackishwater |
| Aquaculture Center | |
| 19. Azmi Abd Rahman | Assistant Fisheries Officer, Brackishwater |
| Aquaculture Center |
Appendix 2
POND RECORD KEEPING AND ANALYSIS
RECORD KEEPING
Pond records are the most important source of micro data for analysis. It is useful for researchers as well as shrimp farmers in making the right decision to improve efficiency of operation and to identify priority research areas. Each pond of the station should have a separate record which should include the following major items for each crop (for details see attached forms).
Description of the pond: Pond number, size (ha), species cultured, starting and harvesting date.
Water management practice: Water depth, daily percent of water exchange, aeration (type), and pump (type).
Inputs: Teaseed cake, fertilizer, seed and feed. The kind, quantity and cost of each of these items should be recorded. Those inputs which can not be separated by individual pond (such as labour, electricity, fuel and oil, maintenance and repair, etc.) should be recorded in a monthly record for whole farm. The cost of each of these items for each crop and each pond can then be approximated by the ration of the area of each pond and the total farm area under water.
Harvest: Species, quantity, average size of the species harvested and unit farm price received.
Growth and water quality: Average size of periodic crop sample, water temperature, dissolved oxygen, pH, salinity, alkalinity and rainfall. These items should be measured and recorded at least weekly.
ANALYSIS
Various types of analysis can be conducted utilizing data listed above. A relatively inexpensive micro-computer would make analysis of the data much easier. A few interesting analyses are listed below as examples.
Growth analysis: The rates of growth and survival of shrimps in a pond varies during different rearing period and are affected mainly by water quality (temperature, DO, pH, alkalinity, salinity, etc.), feeding (quantity and quality of feed) and degree of crowding (biomass). Analysis of empirical data provides measurable relationships among these variables and consequently better feeding and management decisions can be made.
Feed formulation: Given different types of feed formulations, their costs and conversion ratio, one can determine which is the most cost-effective feed.
Economic analysis: Economic feasibility analysis of different pond management practices (such as water management, feeding, fertilization, etc.) can be made based on data from past experiments.
Harvesting strategies: Given the growth rates, survival rates, feed conversion ratio for various rearing stages, and the market prices of shrimp at different sizes, a determination can be made as to what would be the best size of shrimp to harvest to optimize profit.
Sensitivity analysis: The effect of changing one or two variables such as stocking density, feed conversion rate, or cost of input on the result of the overall operation can be estimated.
Statistical analysis: Analysis of the results of experiments can be performed.
Integrated bio-economic analysis: Shrimp production is a dynamic process. A successful operation depends on many biological and economic elements during each stage of rearing. Biological factors usually determine production possibility while economic elements determine profitability. Profitable operation can only be achieved through better understanding in the entire production process. This is not an easy test for any researcher or producer to perform without a proper tool. A quantitative management model which can integrate all these important factors and help the researcher or producer to locate optimal courses of action will contribute immensely to the success of the operation. With all the recorded data mentioned previously, a bio-economic model can be developed.
RECOMMENDATIONS
Since this is a research station, data collection, record keeping and analysis will be a major task for the station. It seems justified for the station to have a micro computer for record keeping and analysis. A micro computer is easy to operate and does not cost much (about US$3,000 in the United States including a printer). Comprehensive user training is usually provided by the local computer dealers. Some software which can be used for aquaculture operation is already available. For instance, software for water quality analysis and management, economic budget analysis, and bio-economic analysis are available from several universities in the United States, such as Texas A&M University and University of Hawaii. A staff member at the station can be trained in the United States for several months on computer programming. A short-term consultant specialized in computer can also be recruited for setting up the micro computer operation in the station and for training national staff.
POND RECORDS
| A. | Description of the pond: | |||||
| Pond No. | Pond Area (ha) | Species cultured | ||||
| Starting date | Harvesting date | |||||
| B. | Water Management: | |||||
| Water depth | I Daily of water Exchange | Aeration (type) | ||||
| Pump (type) | ||||||
C. Inputs:
| Date | Teaseed Cake | Chicken Manure | Seed | Food (Weekly) | Pumping or aeration time | Remarks | ||||||
| kg | Total cost | kg | Total cost | Species | No. stocked | Ave. size | Kind | kg | Method of calculation | |||
D. Harvest:
| Date | S p e c i e s | Price received Per kg | Average size | kg | R e m a r k s |
E. Growth and Water Quality
| Date | No. of sample used | Species | No. sampled | Ave. weight | Est. No. in pond | Est. total wt. in pond | Est. survival rate | Rain | C° | DO | PH | ‰ | Alkalinity | Remarks |
SUMMARY SHEET
| Pond No. | Operating Period: From | to |
| 1st Crop | 2nd Crop | 3rd Crop | TOTAL | ||||||||
| Qty (kg) | Unit cost | Revenue ($) | Qty (kg) | Unit cost | Revenue ($) | Qty (kg) | Unit cost | Revenue ($) | Qty (kg) | Revenue ($) | |
| Production (kg) | |||||||||||
| Species | |||||||||||
| Total | |||||||||||
| Costs ($) | |||||||||||
| Teaseed cake | |||||||||||
| Chicken manure | |||||||||||
| Seed | |||||||||||
| Feed | |||||||||||
FARM RECORDS
(For those cost items which can not be separated by pond)
| LABOUR | Electricity | Fuel & Oil | Repair and maintenance | Interest | Taxes | Misc. | Remarks | ||||||
| Permanent personnel | Hired labour | ||||||||||||
| n/m | Total cost | n/m | Total cost | KW# | Total cost | ($) | ($) | ($) | ($) | ($) | |||
| Year | Month | ||||||||||||
Appendix 3
VISIT TO THAILAND - REGARDING PUSH-PULL PUMPS
by
Robert H. Gedney
FAO Consultant
On 25 October, I met with Mr. Prapan Tharnbuppa, Senior Biologist, Department of Fisheries, Bangkok, Thailand to obtain information about the Thai system of using push-pull pumps. Mr. Prapan conducted me to Samut Sakhorn province, about 20 miles from Bangkok, where I observed two units of the push-pull pumps in operation. These pumps generally are described by Mr. Prapan's paper “Water Pumps Used in Shrimp Farms in Thailand”1.
We then visited a machine shop in the town of Samut Sakhorn where we observed a large pump being fabricated for use in the field. Power was supplied by a used diesel engine of at least 300 horsepower. The shaft from the engine to the propeller was housed in steel, cylindrical piping with hard wood block bearings at about 15 inches centres. The propeller and shafting was stainless steel of about 12 inches and then threaded to a carbon steel drive shaft connected with the engine. I was amazed to learn that the entire unit will only cost 30,000 baht (US$1,500).
In subsequent conversation with Mr. Prapan, the following information were developed:
The propellers are sized 4 inches in diameter less than the diameter of the pipe in which they are fitted. The reason is that the clearance is needed to prevent damage to the wild seed used in stocking fishpond. This makes the unit inefficient as a pump but very efficient for use by the shrimp farmers.
The principal species stocked is Penaeus merguiensis.
It is usually necessary to change the wood block bearings every year.
The Government sometimes procures or finances the procurement of pumps for the farmers.
With the use of the pumps, the farmers realized a yield of about 1,875 to 2,500 kg/ha/year. based on two crop production. A sketch which shows the general details of a push-pull pump is shown below. The angle which the propeller makes when it enters the intake pipe further contributes to the inefficiency of the pump.
I also met with Mr. Vanich Varikul, Deputy Director-General, Department of Fisheries, and reviewed pump operation with him. Later, Mr. Prapan and I met with Mr. Thamrorg Prempridi, Professor of Water Resources Section, Faculty of Engineering, University of Chulalongkorn, in regard to possible testing and a programme which might be undertaken to improve the pump efficiency.
I departed Bangkok on 28 October for Johor Bahru, Malaysia. The courtesy of the Department of Fisheries in accommodating my visit is greatly appreciated.
![]()
![]()
![]()