| BA, A. | GARCIA, S. |
| Centre National de Recherches | Départment des Pêches (FIRM) |
| Océanographiques et des Pêches | FAO |
| B.P. 22 | Via delle Terme di Caracalla |
| Nouadhibou | 00100 Rome |
| MAURITANIE | ITALIE |
| BERRAHO,A. | LIMA DIAS, M. |
| Institut Scientifique des | Instituto Nacional Investigação das |
| Pêches de Tiznit, B.P. 21 | Av. Brasilia 1400 |
| Casablanca | Lisboa |
| MAROC | PORTUGAL |
| BRAVO DE LAGUNA, J. | OVERKO, S. |
| Centro Costero de Canarias | Centre Nacional de Recherches |
| Instituto Espanol de Oceanografía | Océanographiques et des Pêches |
| Carretera S/Andrés s/n | B.P. 22 |
| Apartado de Correos 1373 | Nouadhibou |
| Santa Cruz de Tenerife | MAURITANIE |
| ESPAGNE | |
| ROEST, F.C. | |
| DOMAIN,F. | Projet COPACE |
| ORSTOM | S/C PNUD |
| 24, Rue Bayard | B.P. 154 |
| 75008 Paris | Dakar |
| FRANCE | SENEGAL |
| EL OUAIRI, M. | THIAM, M. |
| Institut Scientifique des | Centre de Recherches océanographiques |
| Pêches Maritimes | de Dakar-Thiaroye |
| Rue de Tiznit | B.P. 2241 |
| B.P. 21 | Dakar |
| Casablanca | SENEGAL |
| MAROC | |
| TURNER, J. | |
| FERNANDEZ, M.A.R. | Institut Scientifique des |
| Centro Costero de Canarias | Pêches Maritime |
| Instituto Espanol de Oceanografía | Rue de Tiznit |
| Carretera S/Andrés s/n | BP. 21 |
| Apartado de Correos 1373 | Casablanca |
| Santa Cruz de Tenerife | MAROC |
| ESPAGNE |
GROUPE DE TRAVAIL AD HOC SUR LES MERLUS ET CREVETTES PROFONDES DE LA REGION NORD DU COPACE
2–5 Mai 1984
Santa Cruz de Tenerife, Espagne
ORDRE DU JOUR
Description des pêches
comprenant les changements depuis la dernière réunion.
Données statistiques sur les captures et l'effort de pêche
Ces données devront être actualisées et corrigées si nécessaire. Des propositions polonaises pour corriger les données historiques seront discutées. Captures, effort et CPUE de l'Espagne et du Maroc pour leur pêcherie de M. merluccius. Standardisation de l'effort de pêche entre ces deux pays.
Données biologiques
De nouvelles données biologiques sur les trois espèces de merlus et les crevettes profondes seront présentées si possible en relation avec des changements saisonniers de l'environnement. Composition par longueur et, si possible, par âge des captures commerciales. Données sur la croissance, l'âge et la mortalité naturelle pour Merluccius spp., ainsi que composition par espèces, sex-ratio et rapports longueur-poids. Etudes de sélectivité, comprenant celles de la campagne collective du Marco et de l'Espagne avec le N/O IBN SINA. Effets de changements du maillage.
Evaluations
4.1 Modèles de production
4.2 Modèles analytiques
4.3 Campagnes de recherche. Campagnes de chalutage marocaines,
campagnes sénégalaises, campagnes espagnoles.
STATE OF EXPLOITATION OF Merluccius merluccius
OFF THE COAST OF NORTHERN MOROCCO
by Jerry Turner (1) and Mehdi El Ouairi (2)
1. INTRODUCTION
Morocco and Spain are the two principal countries that fish for Merluccius merluccius (European hake) off the Atlantic coast of northern Morocco. The trawler fishery in Morocco has increased considerably since 1972, due to an increase in the number and size of trawlers. The total gross tonnage of the trawler fishery has more than doubled. Some hake are also taken by a large number of small vessels fishing close to shore using lines and fixed nets.
The Spanish fleet works principally out of ports in the South of Spain. Detailed information on their fishing fleet and catch is provided in FAO (1978) and FAO (1981). Most of these vessels fish in depths over 150 m. Soviet trawlers have also fished these waters at depths of 200– 500 m.
The Institut Scientifique des Pêches Maritimes (ISPM) recently started an exploratory trawl survey program with the research vessel, IBN SINA, to measure the relative abundance and size structure of the principal demersal fish stocks off the coast of Morocco. The results are available from two surveys conducted in 1982 and three surveys in 1983. Sampling is conducted along radial lines extending perpendicular to the coast at Larache, Kenitra, Mohammedia, El Jadida, Essaouira and Agadir. A series of five to seven hauls are taken along each radial at depths up to 800 m.
The northern coast of Morocco has been subdivided into a northern and southern region with the radials sampled from 29 to 32°N latitude considered the southern region and the radials from 33 to 36°N latitude the northern region.
(1) Institut Scientifique des Pêches Maritimes, UNDP/FAO Project MOR/81/002
(2) Institut Scientifique des Pêches Maritimes, Casablanca, Morocco
The major objective of the survey is to obtain a measure of the effects of fishing which is independent of commercial catch and effort data. This type of information should overcome some of the problems inherent in the use of effort statistics for stock assessment which has to be expressed in standardized units to account for differences in size and types of fishing vessels and gear used by the various countries. It should also minimize some of the bias involved in attempting to obtain the size structure of the total hake population through local market sampling, which will be discussed later in the report.
2. WATER DEPTH AND MERLUCCIUS POPULATION
Several population parameters of M.merluccius in Morocco vary with the depth of the water. Figure 1.A shows the change in mean catch rate with increasing depth for hake collection made with the research vessel “EL IDRISSI” in the northern region of Morocco in 1973–76 (FAO, 1978). Low catches are evident in water less than 150 m with the highest catch rate occuring at 150–200 m. The catch rate declines from there at a steady rate with increasing depth.
The mean length of the total catch also varies with depth (fig. 1.B) with the smallest average length in water less than 150 m depth and a steadily increasing average length of fish with increasing depth.
Maurin (1954) found that all Moroccan hake specimens below 18 cm were sexually immature. The catch rate of these immature fish less than 18 cm is greatest at the 150–200 m depth (fig. 1.C) and declines towards both shallow and deeper water. No fish less than 18 cm were caught at depths greater than 500 m.
The apparent total mortality rate of M. merluccius also varies with depth. Figure 2 shows the logarithmic decline in numbers at various depths. The estimated age of each length group is based on the growth information from Goñi (1983) and the catch curve from the methods by Pauly (1983). The Y axis of the figure is variable for the logarithm of numbers for each depth stratum in order to separate the data points for each depth stratum. The results show high mortality rates for the population in the 0–50 and 50–100 m depths with decreasing mortality with increasing depth. The slopes of the lines of apparent total mortality rates (Z) are shown in figure 1.D.
3. GROWTH
Goñi (1983) provides the most recent and comprehensive information available on the growth of M. merluccius off the Northwest African shelf. A total of 1098 otoliths were read from sectioned otoliths, a technique recognized as the most suited for ageing hake (FAO, 1982). Maurin (1954) and Rami (1979) have done growth work on hake in Moroccan waters but their sample sizes were small, using different techniques, and neither presented a growth equation. Unless otherwise advised, we have used the growth parameters from direct otolith readings by Goñi (1983) for the combined male and females where : L∞ = 110 cm, K = 0.064 and to = -0,76.
4. SIZE STRUCTURE AND TOTAL MORTALITY
The length frequency of hake, caught off the northern region (33–36°N latitude) during our radial trawl survey in 1982–83, has been stratified by depth (table 1). Also listed accross the bottom of the table is the sample weight of fish caught in each depth stratum, the catch rate in kg of hake per hour and the area represented by each depth stratum.
The results show similar patterns to the results of the 1973–76 data (fig. 1) even though the present sample is 53 tows compared to 127 tows taken in 1973–76. Catch rates are lowest in the shallow water, highest in the medium depths and decline in the deeper waters; the mean length of fish increases from shallow to deep water. Most immature fish are present in the mid depths.
Because of the changes of population size and length structure with depth, we weighted the length frequency of catch by the catch per effort in each depth zone and by the total surface area estimated to be in each depth stratum. Table 2 is the weighted size structure in 1982–83 based on the results from our trawling survey.
4.1 Comparision of total mortalities in 1973–76 and 1982–83 in the northern region
A similar weighting process was conducted on the 1973–76 data in the northern region. Unfortunately, we cannot directly compare the catch rates between the two time periods as some unknown correction factors were applied to the 1973–76 data to adjust for different nets used and an overall escapement factor was applied to the final results. However, the results of the length structure of the population are believed to be comparable.
The linear portion of the length frequency of the catch curves of the two time periods is presented in figure 3. The loge of the number of 2 year old fish for the two time periods has been adjusted to the same value and the other numbers adjusted accordingly so that they are comparable. The mortality rate for the 1982–83 data is higher than for 1973–1976 throughout the entire size/age range of the fish. In addition, the mortality rate is higher for younger fish (18–40 cm) than for the older fish (40–60 cm) for both time periods.
4.2 Comparision of mortality in southern and northern region in 1982–83
A comparision of the linear portion of the catch curve for M. merluccius caught in the southern region (29–32°N latitude) and in the northern region (33–36°N latitude) is presented in figure 4. The loge of the numbers of 2 year old fish has also been adjusted to the same value for comparative purposes.
Both regions have a high mortality rate for the young/small hake up to 4.2 years (30 cm) ; however, the mortality rate is much higher for the older/larger fish in the northern region.
4.3 Vessel sampling vs. Market sampling
Length frequency sampling of hake was carried out at the Casablanca fish market from June 1982 to July 1983. Large numbers of fish are sold in the Casablanca market which have been brought in from fishing ports primarily to the South of Casablanca. Fishermen report where they catch their fish and the results have been recorded as fish caught in the northern or southern region as previously defined. No attempt was made to raise the length-frequency of catch to total market catch by area as the information was not readily available.
The length-frequency of the market catch for the northern region is compared with the weighted length frequency of catch from the radial surveys (fig. 5). The mortality rate calculated from the market sample is much higher (Z = 1.12) than from the radial survey (Z = .65) for the northern region. This suggests that the market sample is a measure of what the Morocco fishermen are catching and it does not reflect the status of the Morocco hake population.
The length-frequency of the market sample is also compared to the 0–100 m and 0–200 m depth strata of length frequency of catch from the research vessel to determine the depth at which the Morocco catch is being taken (fig. 6). A much closer relationship is evident between the market sample and the 0–100 m depth (fig. 6A) than the 0–200 m depth (fig. 6B) suggesting that most of the Morocco catch is taken in the 0–100 m depths. Discussions with the Morocco trawl fishermen confirm that almost all trawling is conducted between 20–60 fathoms (36–108 m) depth (Fahfouhi, ISPM, personal communication).
Note also in figures 5 and 6 that the peak length frequency of the vessel sample occurs at 1.7 years (16 cm) showing that the Morocco fishermen are using very small mesh nets. FAO (1978) estimated the mesh size of the Morocco fishery to be 30–40 mm stretched mesh.
The market sample for the southern region, also collected at the Casablanca market, shows a very erratic length frequency pattern (fig. 7). These fish are probably selected for size before they are shipped the long distance to the Casablanca market.
5. NATURAL MORTALITY
Direct measures of natural mortality rates are difficult to obtain. Several authors have derived relationships between various parameters and natural mortality rates for a number of species. Beverton and Holt (1959) and Tanaka (1960) demonstrated the relationship between M and maximum age for different groups of species. Goñi (1983) aged hake up to 9 years of age with a maximum length of 69 cm. However, she also reported fish as long as 100 cm which indicates that they live a number of years older than 9 years. Guichet et al. (1974) as reported in Goñ (1983) found M. merluccius to be as old as 13 years in NW Ireland. Assuming they live to at least 13 years in Morocco, the estimates of M would be equal to 0.2 to 0.3 (table 3).
Other estimates are also listed in table 3. The age of “massive maturation” in the Rikhter and Effanov formula (1976) is estimated to occur at an average length of 32 cm (FAO, 1981) which corresponds to 4.6 years using Goñ (1983) growth data.
Natural mortality rates can be calculated directly with paired values of total mortality and fishing effort. We have a set of values for Z for 1973–76 and 1982–83 from catch curve analysis (fig. 3 and 4). Two measures of finishing effort (f) are available from total gross tonnage of the fishing fleet and the sum of the number of fishing trips by each vessel times its horsepower (FAO, 1981).
We obtained M values of .34 for both measures of effort (f) based on catch curse analysis (Z) (table 4).
A Working group on hake (FAO, 1978) used a value of M equal to 0.2 for their calculations with M. merluccius. However, a later Working group (FAO, 1981) felt that the value of 0.2 was low and the possibility of a higher value should be considered. The results of these analysis suggest values of M ranging from .17 to .35 with most values in the 0.2 to 0.3 range. We use an M value of 0.25 in our yield calculations.
6. YIELD PER RECRUIT
Given a knowledge of growth and natural mortality rates, a yield per recruit model can be formulated as a function of (1) fishing mortality and (2) the size at first capture. The effect on yield can be examined by varying one of the parameters (fishing mortality or size at first capture) while the other is held constant. Or the results can be expressed in a more comprehensive fashion as a yield-isopleth diagram.
Table 5 is a presentation of the effects of changes in fishing mortality (F) while keeping the size of the hake caught the same. The yield per recruit (Y/R) decreases in value with increasing fishing mortality for this size of hake. The present levels of fishing mortality for both the northern and southern regions are shown along with the percent change in yield that could be expected by changing the level of fishing mortality. For example, in the northern region a reduction in F from .40 to .24 would result in an increase in yield of 45% over the present level.
Table 6 is a presentation of the effects on yield of changes in size at first capture while keeping fishing mortality constant for both the northern and southern regions. The time of capture in years (Tc), length at capture in cm (Lc), and mesh size (mm) to capture the particular size fish are presented as well. For both North and South there would be a large increase in yield (Y/R) with an increase in mesh size.
For example, in the northern region, an increase in mesh size to 128 mm (Tc = 6.0) would result in almost tripling the yield of the hake fishery.
Figure 8 is the estimated yield-isopleth for M. merluccius showing the present status of the fisheries in the northern and southern regions of Morocco. The northern region, in particular, would profit from a reduction in effort. However, both fisheries would increase their overall yield much more with an increase in the mesh size rather than a reduction in effort.
7. DISCUSSION
The basic conclusions of this study are in agreement with previous studies in that the hake stocks are heavily fished and that catches would be increased through the use of larger meshes in the fishing nets and reduced fishing efforts. These facts have been known for some time and a considerable amount of time and effort was spent in determining recommendations to solve these problems (Gulland, 1979). The only formal recommendation made was for a minimum mesh size of 70 mm.
Gulland (1979) examined “the practical problems (methods of measurement, short-term falls in catches, fishing on smaller species, methods of inspection, etc.) that need to be considered if mesh regulations are to be effectively implemented and enforced”. His recommendations are even more appropriate today than they were six years ago as increased fishing effort using small mesh nets has further magnified the problem.
However, implementation of these recommendations would not necessarily result in an increased catch for the Moroccan fishermen. The sample of hake collected in the Casablanca market is a measure of what the Morocco fishermen are presently catching. Over 99% of the hake, that are sold in the market from the northern region, are less than 30 cm long. The Morocco trawl fishery is concentrated close to shore in water less than 100 m in depth and they are catching the young/small fish which are found there. In order to benefits from an increase in mesh size and reduction in effort, the hake fishermen must move into deeper waters to fish. FAO (1978) and Chaali (1984) estimated, even under 1973–76 conditions, that Morocco would not benefit appreciatively and might even lose depending on the level of effort, if they continue to fish in the shallow water.
8. REFERENCES
Beverton, R.J.H., and S.J. Holt, 1956 A review of life span and mortality rates of fish in nature and the relation to growth and other physiological characteristics. In Ciba foundation colloquium on ageing. The lifespan of animals, edited by G.E.W. Wolstenholme and M. O'Connor. London, Churchill, Vol. 5 : 142–77.
Chaali, A., 1984 Approche analytique de l'état d'exploitation du stock du merlu blanc (Merluccius merluccius) du Nord-Atlantique marocain (manuscript).
FAO, 1978 Report of the ad hoc Working group on hakes (Merluccius merluccius, M. senegalensis, M. cadenati) in the northern zone of CECAF. Santa Cruz de Tenerife, Spain, June 1978, CECAF/ECAF Series 78/9 : 93p.
FAO, 1981 Report of the Fifth Session of the Working Party on Resource Evaluation (CECAF). Dakar, Sénégal, October 1980. FAO, Fish.Rept. 244 : 127p.
FAO, 1982 Report of the technical consultation on methodologies used for fish age reading (CGPM). Montpellier, France, October, 1981. FAO.Fish. Rept. 257 : 104p.
Gulland, J.A., 1979 Problems of managing the CECAF hake and sea bream stocks. CECAF/ECAF Series 79/13, 7p.
Goni, R. 1983 Growth studies of European hake (Merluccius merluccius L.) from the Northwest African shelf. ICES, C.M. 1983/G, 10
Maurin, C., 1983 Les merlus du Maroc et leur pêche. Bull.Inst. Pêche Marit., Casablanca, 2 : 7–65.
Pauly, D., 1983 Some simple methods for the assessment of tropical fish stocks. FAO.Fish.Tech.Pap., 234 : 52p.
Rami, M., 1979 Mise au point d'une technique pour la lecture d'âge de Merluccius merluccius. Bull.Inst.Pêche Marit., Casablanca, 25 : 9p.
Rikhter, V.A., and V.N. 1976 Effanov, On one of the approaches to estimation of natural mortality of fish populations. ICNF Res.Doc., 76/VI/8 : 12p.
Tanaka, S., 1960 Studies on the dynamics and the management of fish populations, Bull.Tokai Reg. Fish.Res.Lab. 28 : 1–200.
| DEPTH (m) | ||||||||
|---|---|---|---|---|---|---|---|---|
| 0–50 | 50–100 | 100–200 | 200–300 | 300–400 | 400plus | TOTAL | ||
| 7–8 | 4 | 25 | 1 | 30 | ||||
| 9–10 | 4 | 87 | 128 | 5 | 23 | 247 | ||
| 11–12 | 16 | 214 | 107 | 14 | 30 | 381 | ||
| 13–14 | 33 | 278 | 89 | 16 | 40 | 1 | 457 | |
| 15–16 | 32 | 330 | 219 | 28 | 55 | 3 | 667 | |
| 17–18 | 22 | 325 | 241 | 34 | 53 | 13 | 688 | |
| 19–20 | 15 | 364 | 178 | 16 | 19 | 12 | 604 | |
| 21–22 | 20 | 312 | 146 | 18 | 9 | 8 | 513 | |
| 23–24 | 18 | 200 | 98 | 11 | 7 | 7 | 341 | |
| 25–26 | 11 | 73 | 76 | 13 | 3 | 3 | 179 | |
| 27–28 | 4 | 47 | 62 | 13 | 1 | 1 | 128 | |
| 29–30 | 3 | 36 | 59 | 8 | 2 | 1 | 109 | |
| 31–32 | 5 | 21 | 29 | 16 | 3 | 1 | 75 | |
| 33–34 | 3 | 13 | 25 | 12 | 7 | 3 | 63 | |
| LENGTH | 35–36 | 7 | 22 | 8 | 6 | 1 | 44 | |
| (cm) | 37–38 | 7 | 15 | 17 | 7 | 3 | 49 | |
| 39–40 | 1 | 5 | 16 | 11 | 1 | 34 | ||
| 41–42 | 1 | 15 | 15 | 6 | 3 | 40 | ||
| 43–44 | 2 | 10 | 5 | 5 | 2 | 24 | ||
| 45–46 | 11 | 2 | 2 | 5 | 20 | |||
| 47–48 | 1 | 2 | 1 | 1 | 5 | |||
| 49–50 | 2 | 1 | 2 | 5 | ||||
| 51–52 | 2 | 3 | 3 | 8 | ||||
| 53–54 | 4 | 1 | 5 | |||||
| 55–56 | 2 | 1 | 2 | 5 | ||||
| 57–58 | ||||||||
| 59–60 | 2 | 2 | ||||||
| 61–62 | 1 | 1 | ||||||
| 63–64 | 1 | 1 | ||||||
| 65–66 | 1 | 1 | ||||||
| Total Number | 187 | 2322 | 1566 | 277 | 299 | 76 | 4727 | |
| Number Samples | 5 | 14 | 18 | 6 | 4 | 6 | 53 | |
| Sample Wt (kg) | 11.7 | 144.8 | 116.0 | 60.1 | 43.3 | 11.9 | 387.8 | |
| CPUE kg/h | 2.64 | 15.17 | 13.13 | 15.89 | 10.18 | 5.32 | - | |
| Area nm2 | 968 | 1306 | 2777 | 574 | 296 | 1490 | 7411 | |
| DEPTH (m) | |||||||||
|---|---|---|---|---|---|---|---|---|---|
| 0–50 | 50–100 | 100–200 | 200–300 | 300–400 | 400plus | TOTAL | |||
| 7–8 | 10 | 147 | 1 | 159 | 2510 | ||||
| 9–10 | 16 | 221 | 753 | 14 | 29 | 1033 | |||
| 11–12 | 65 | 546 | 629 | 40 | 38 | 1318 | |||
| 13–14 | 135 | 710 | 523 | 45 | 51 | 16 | 1480 | 6598 | |
| 15–16 | 131 | 844 | 1288 | 79 | 72 | 41 | 2455 | ||
| 17–18 | 90 | 832 | 1417 | 97 | 69 | 158 | 2663 | ||
| 19–20 | 61 | 930 | 1047 | 45 | 25 | 150 | 2258 | 5442 | |
| 21–22 | 82 | 798 | 858 | 51 | 11 | 100 | 1900 | ||
| 23–24 | 74 | 511 | 576 | 31 | 9 | 83 | 1284 | ||
| 25–26 | 45 | 187 | 447 | 37 | 4 | 31 | 751 | 1779 | |
| 27–28 | 16 | 119 | 364 | 37 | 1 | 9 | 546 | ||
| 29–30 | 12 | 91 | 347 | 23 | 3 | 6 | 482 | ||
| 31–32 | 20 | 54 | 171 | 45 | 4 | 16 | 310 | 762 | |
| 33–34 | 12 | 33 | 147 | 34 | 9 | 31 | 266 | ||
| 35–36 | 18 | 129 | 23 | 8 | 9 | 187 | |||
| LENGTH | 37–38 | 18 | 88 | 48 | 8 | 34 | 196 | 472 | |
| (cm) | 39–40 | 3 | 29 | 44 | 14 | 6 | 96 | ||
| 41–42 | 88 | 43 | 8 | 41 | 180 | ||||
| 43–44 | 5 | 59 | 13 | 7 | 29 | 113 | 265 | ||
| 45–46 | 65 | 6 | 3 | 56 | 130 | ||||
| 47–48 | 3 | 6 | 1 | 12 | 22 | ||||
| 49–50 | 12 | 3 | 19 | 34 | 102 | ||||
| 51–52 | 6 | 4 | 34 | 44 | |||||
| 53–54 | 23 | 1 | 24 | ||||||
| 55–56 | 6 | 1 | 19 | 26 | 35 | ||||
| 57–58 | |||||||||
| 59–60 | 6 | 6 | |||||||
| 61–62 | 1 | 1 | |||||||
| 63–64 | 1 | 1 | |||||||
| 65–66 | 1 | 1 | |||||||
| TOTAL | 759 | 5933 | 9207 | 782 | 384 | 900 | 17,966 | 17,966 | |
| Author | Method | Input | Results |
|---|---|---|---|
| Beverton & Holt (1959) | Relationship maximum age and mortality | Maximum Age 13 years | 0.30* |
| Tanaka (1960) | Relationship maximum age and mortality | Maximum Age 13 years | 0.2* |
| Rikhter & Efanov (1976) | Relationship “Massive maturation” and mortality | Massive maturation at 4.6 years years | 0.30 |
| Pauly (1983) | Relationship Loo, K, temperature and mortality | Loo=110, K=0.064, T=18.C | 0.17 |
| Gulland (1969) | Relationship paired fishing effort and total mortality | (Table 4) | .35 .35 |
| Time | ||||
|---|---|---|---|---|
| Factor | Analysis | 1973–76 | 1982–83 | Estimation |
| Z1 | (18–60cm - Figure 3) | .54 | .65 | |
| f1 | (Total gross tonnage) | 7130 | 12010x | |
| f2 | (Trips times horsepower) | 4342 | 7300xx | |
| M | (Z1, f1) | .35 | ||
| M | (Z1, f2) | .35 | ||
x 1980–81 (O.N.P.);
XX 1978–79 (FAO, 1981)
| E | F | Y/R | 1NORTH (% F=.40) | 2SOUTH (% F=.24) |
|---|---|---|---|---|
| .24 | .08 | 42.4 | 163 | 112 |
| .39 | .16 | 43.8 | 168 | 116 |
| .49 | .242 | 37.8 | 145 | 100 |
| .56 | .32 | 31.4 | 120 | 83 |
| .62 | .401 | 26.0 | 100 | 69 |
| .66 | .48 | 21.6 | 83 | 57 |
| .69 | .56 | 18.2 | 70 | 48 |
| .72 | .64 | 15.5 | 60 | 41 |
| .74 | .72 | 13.3 | 51 | 35 |
| .76 | .80 | 11.5 | 44 | 30 |
12Estimates based on Figure 5 and 6.
| Tc | Lc | C | Mesh2 | NORTH | SOUTH | ||
|---|---|---|---|---|---|---|---|
| Size | Y/R | (%Lc= 14) | Y/R (%Lc= 14) | ||||
| 1.2 | 13 | 11.8 | 42 | 24.3 | 93 | 37.1 | 96 |
| 1.41 | 14 | 12.7 | 46 | 26.0 | 100 | 38.6 | 100 |
| 2.4 | 20 | 18.2 | 66 | 38.0 | 146 | 48.3 | 125 |
| 3.6 | 27 | 24.5 | 88 | 53.4 | 205 | 59.5 | 154 |
| 4.8 | 33 | 30.0 | 108 | 67.2 | 258 | 68.4 | 177 |
| 6.0 | 39 | 35.5 | 128 | 76.8 | 295 | 73.6 | 191 |
| 7.2 | 44 | 40.0 | 144 | 81.6 | 314 | 75.0 | 194 |
| 8.4 | 49 | 44.5 | 162 | 81.8 | 315 | 730 | 189 |
| 9.6 | 53 | 48.2 | 174 | 78.4 | 302 | 68.4 | 177 |
| 10.8 | 57 | 51.8 | 186 | 72.5 | 279 | 62.2 | 161 |
| 12.0 | 62 | 56.4 | 203 | 65.2 | 251 | 55.1 | 143 |
2 Assumed mesh selection factor = 3.6 (FAO, 1978)
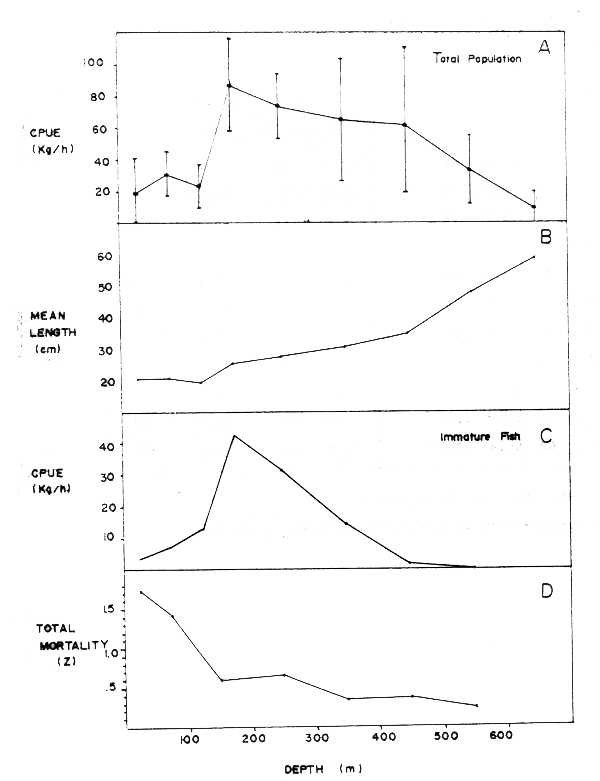
Figure 1. Comparison of the effects of water depth on M. merluccius for (A) catch rate of population, (B) mean length of catch, (C) catch rate of immature fish and (D) apparent total mortality rate.
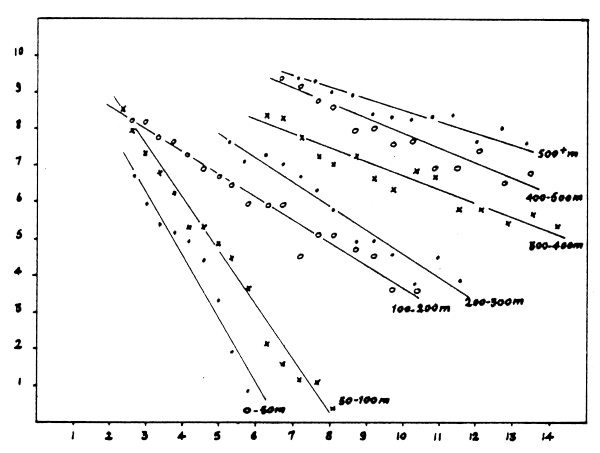
Figure 2. Length/age frequency of population by depth stratum of M. merluccius in 1973–76 (research vessel data)
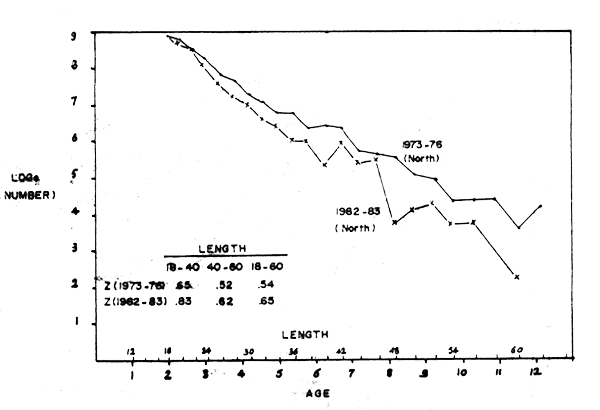
Figure 3. Weighted length/age frequency of population of M. merluccius for northen region of North Morocco for 1973–76 and 1982–83; small arrow designates length division point (research vessel data)
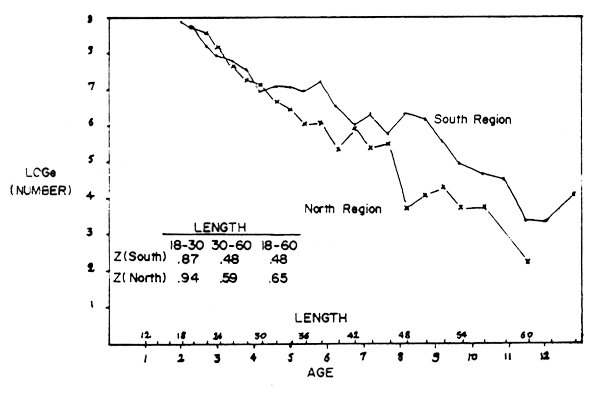
Figure 4. Weighted length/age frequency of population of M. merluccius for northern and wouthern regions of Morocco, small arrow designates length division point (research vessel data)
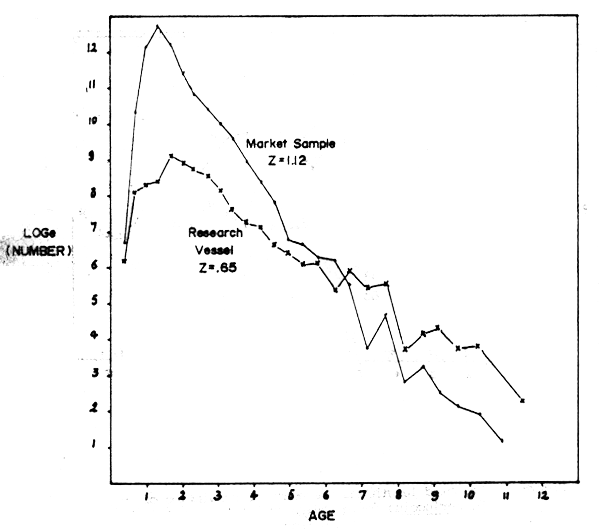
Figure 5 : Length/age frequency of catch of M. merluccius in market and research vessel samples in northen region in 1982–83.
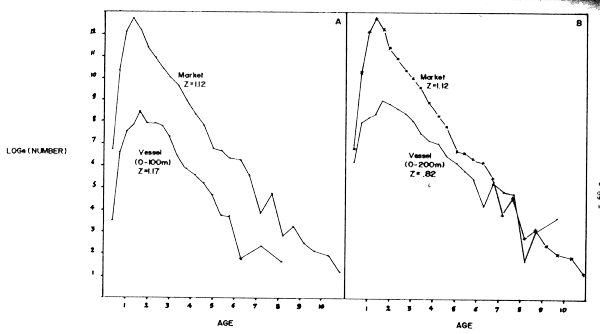
Figure 6 : Comparison of length/age frequency of catch of M. Merleccius in 1982–83 from Casablanca market sample and research vessel sample at (A) 0–100 m depth and (B) 0–200 m depth.
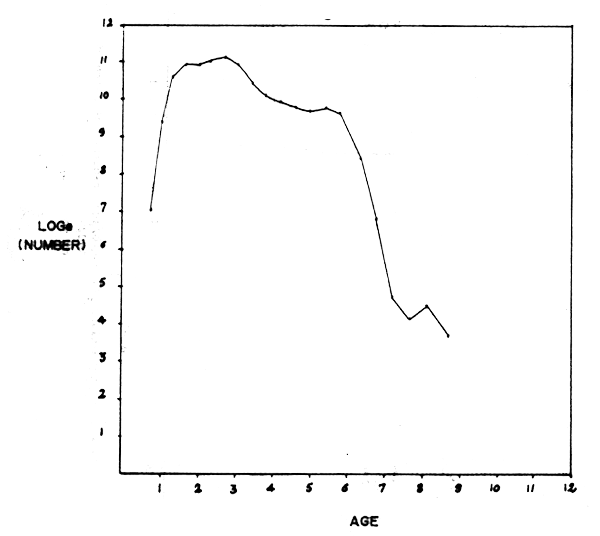
Figure 7 : Length/age frequency of catch of M. merluccius taken in Casablanca market which were transported from the southern region.
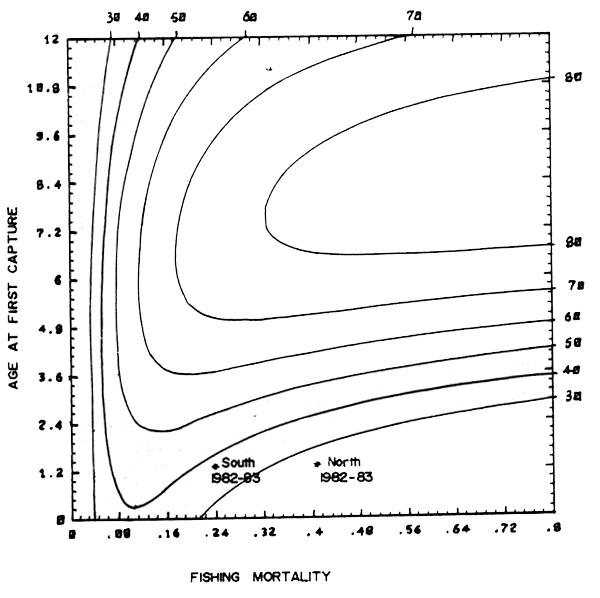
Figure 8 : Yield per recruit estimates of M. merluccius showing the status of the fishery in the northern and southern regions of North Morocco in 1982–83.