Any assessment of markets and market trends in Greece depends on information and data which have serious shortcomings.
Data for national fish landings are based largely on annual assessments by the Ministry of Agriculture's fisheries service. There is a lack of precision for landings in all areas other than those served by centralized auctions, where landings are controlled and monitored by the semi-public fish marketing company, Etanal S.A. Both Ministry and Etanal estimates put these monitored landings at only 30% of the total. The remaining production is assessed by the Ministry's regional field services and collated in the central offices in Athens.
Estimates of aquaculture also lack precision mainly because of difficulties in monitoring production from lagoons where declared production-i.e., the level of production declared by the cooperatives involved in commercial exploitation of the lagoons - can be as low as 30% of official estimates.
There is also a serious shortage of detailed information about patterns of demand and consumption. Some studies have been carried out in this area in the past but these are outdated and of little value.
Given these shortcomings, it is nevertheless possible to use the official estimates to illustrate general trends. Data on quayside prices provided by Etanal can be treated as indicative of trends in fish prices, and the Agricultural Bank - given its close involvement with commercial aquaculture operations - can be regarded as a reliable source of information on aquaculture production.
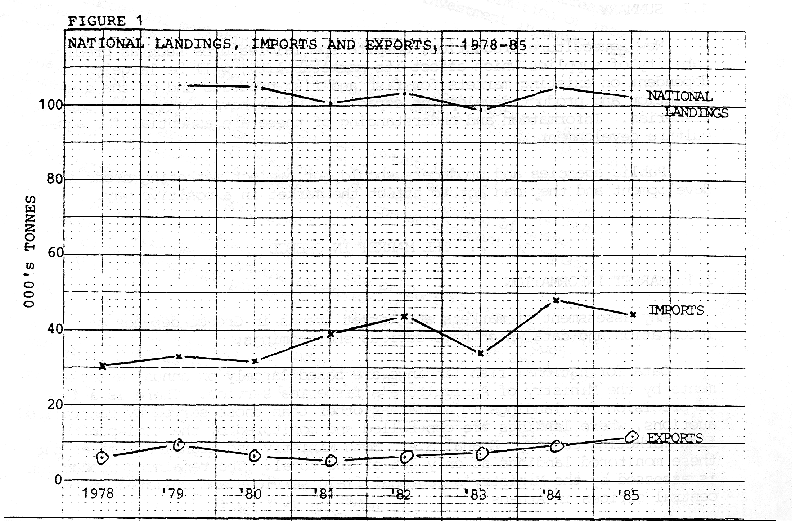
The general trend of imported fish and fish products becoming increasingly necessary to meet Greece's growing demand for fish is illustrated in Figure 1. Clearly, since the late 1970s production from the national fleet has stagnated at just over 100 000 t and there has been a general rise in imports from 30 000 t in 1978 to 45 000 t in 1985. This represents a rise from 23% to 33% in the share of the market accounted for by imports.


SOURCE: FAO FISHERIES STATISTICS YEARBOOK
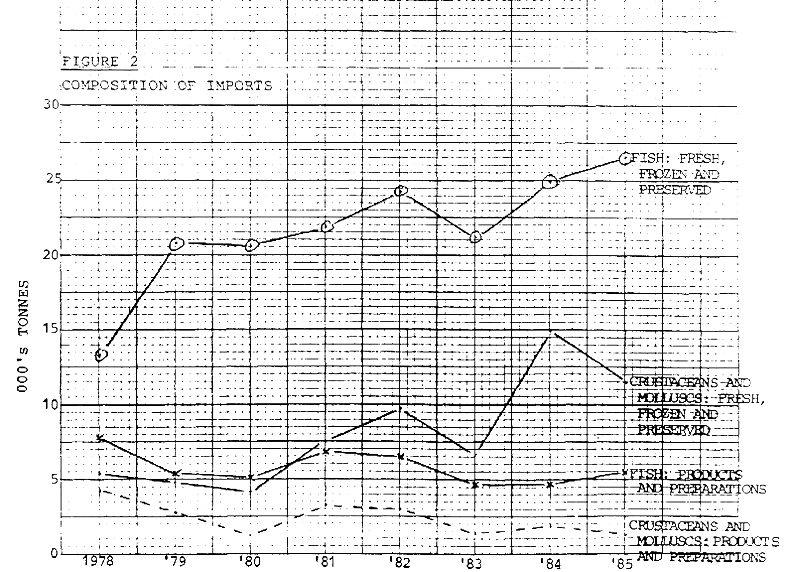
The composition of the imports is illustrated in Figure 2. Increases in imports are shown to be based mainly on increases in fresh, frozen and preserved fish and shellfish with imports of products and preparations generally declining over the period.
More recent information on the composition of imports of fish is shown below (estimates by Ministry of Agriculture, 1983–1986).
COMPOSITION OF FISH IMPORTS - 1983–86 (t)
| 1983 | 1984 | 1985 | 1986 | |
Fresh, chilled | 4 824 | 4 982 | 4 569 | 3 684 |
Frozen | 6 255 | 6 074 | 4 946 | 16 429 |
Frozen fillets | 685 | 1 023 | 1 061 | 1 643 |
Salted, dried, smoked | 10 083 | 9 599 | 9 475 | 7 925 |
Canned | 5 067 | 4 741 | 5 299 | 4 887 |
Shellfish (all products) | 11 307 | 18 735 | 13 469 | 23 783 |
Others | 3 323 | 3 353 | 6 490 | 1 925 |
Total | 41 544 | 48 507 | 45 309 | 60 276 |
The main countries exporting to Greece in the various product categories were as follows:
| 1986: | Fresh, chilled | Argentina, France, Turkey, Yugoslavia |
| Frozen | Argentina, France, Netherlands, South Africa | |
| Frozen fillets | Argentina, Italy, Netherlands, Norway | |
| Shellfish | Faroes, Italy, Netherlands, USSR | |
| 1985: | Fresh, chilled | Argentina, Bulgaria, France, Italy, Republic of Korea, South Africa, Turkey, Uruguay, USSR, Yugoslavia |
| Frozen | Argentina, Denmark, Faroes, Italy, Japan, Mauritius, Morocco, Netherlands, South Africa, Uruguay | |
| Frozen fillets | Argentina, Federal Republic of Germany, Netherlands, Uruguay | |
| Shellfish | Bulgaria, Chile, Denmark, France, India, Italy, Mauritius, Morocco, Netherlands, Republic of Korea, Spain, Tunisia, Turkey | |
| 1984: | Fresh, chilled | Argentina, Bulgaria, Federal Republic of Germany, France, Italy, Netherlands, Republic of Korea, Spain, Turkey, Uruguay, USSR |
| Frozen | Italy, Japan, Mauritius, Morocco, Netherlands, Uruguay | |
| Frozen fillets | Argentina, Federal Republic of Germany, Uruguay | |
| Shellfish | Denmark, Federal Republic of Germany, France, Italy, Morocco, Netherlands, Spain, Turkey | |
| 1983: | Fresh, chilled | Bulgaria, France, Italy, Netherlands, Turkey, USA |
| Frozen | Argentina, Federal Republic of Germany, France, Morocco, Netherlands, Spain | |
| Frozen fillets Shellfish | Argentina, Italy, Netherlands, Uruguay | |
| Shellfish | India, Morocco, Panama, Spain, Turkey | |
The Ministry of Agriculture's estimates (Table 2, below) on the utilization of the national catch indicate an overwhelming preference on the part of the Greek consumer for fresh and chilled products.
UTILIZATION OF CATCH, 1985 & 1986
| 1985 | 1986 | |
| Fresh, chilled | 81.0% | 81.6% |
| Frozen | 12.6% | 12.5% |
| Cured, canned | 6.4% | 5.9% |
The estimates of supplies to the Greek market highlight several important characteristics of the market. These are as follows:
There is a clear and dominant consumer preference for fresh fish.
Supplies from national sources of production have reached a peak.
Demand for fish continues to grow and is attracting an increasing quantity of imports, particularly of frozen fish and shellfish products.
The composition of imports, and the dominant preference of the consumer, suggest that whole frozen fish products are substituting for demand for fresh product within the country and that the demand for processed products and preparations is small and declining.
Imports are being drawn into the market from very distant countries, as well as from countries where processing technology is very much more advanced than in Greece. This suggests that any new forms of production within Greece might be vulnerable to competition from cheap sources of supplies.