The global market situation and international action
Highlights
Global
review
Commodity markets in summary
The
Uruguay round agreement
Other policy responses to trade problems
Commodity
consultations in 1993
• Several important demand and supply factors influenced world commodity markets in 1993. Demand for agricultural commodities was boosted by strong growth in many economies especially in Asia, most notably China, in parts of Latin America and in some of the developed economies notably North America and Australia. Other expansionary factors included the decline in interest rates and expectations of growth in many other economies, while a reduced rate of contraction was expected in countries of the former USSR. On the supply side the year was marked by reduced output of a number of commodities, particularly of maize and soybeans in the wake of flood devastation in the United States. As a result, reductions in end of season stocks were in prospect for commodities such as wheat, coarse grains, rice, sugar, soybeans, cocoa, cotton and natural rubber. Supplies from marine fisheries reached or surpassed their sustainable limit and further restrictions of supplies of some sorts of timber onto the international market were put in place.
• Prices of some agricultural commodities surged towards the end of 1993 and on into 1994 reflecting reduction in supplies relative to demand. Increases in dollar prices between December 1992 and December 1993 exceeded 20 percent for maize, rice, cocoa beans, oils of soybeans, coconut and groundnuts, some fishery products, logs and sawnwood. The rise in cotton prices too was on the point of exceeding 20 percent, However, over 1993 as a whole, prices averaged below those in 1992 for many commodities including wheat, rice, citrus juice, bananas, cod, salmon, fine wool and wood pulp. Overall, for agricultural, fishery and forestry commodities the UN export price indices for 1993 point to a level 6 percent below the previous year. However, the decline for commodities exported by the developing countries was limited to 3 percent reflecting offsetting price increases in the beverage crops, sugar and oilseeds sectors.
• Manufactured goods and especially crude petroleum were cheaper in dollar terms on the world market in 1993. The 3 to 4 percent decrease in the unit values of these goods meant that in real terms the prices of agricultural, fishery and forestry products declined by approximately 3 percent in 1993 in contrast to the 6 percent decline in nominal prices. Commodities exported by the developing countries maintained the same overall real price levels as in 1992. However, relative to the years 1979 to 1981 the real prices or barter terms of trade of agricultural, fishery and forestry products had fallen globally by 28 percent, and those of exports from the developing countries by 39 percent. The greater decline for exports of the developing countries reflects declines in excess of 30 percent for beverage crops, sugar, oilseeds, natural fibres and natural rubber.
• The global value of trade in agricultural, fishery and forest products in 1992 rose relative to the previous year by 5 percent and slightly more for agricultural exports alone. An increase in the value of exports occurred in cereals, especially wheat, vegetable oils, meat and milk products. Growth was even greater in categories such as chocolate and sugar confectionery, pastry products and pistachios. In contrast, commodities with notably reduced export earning were the beverage crops, pepper, cotton and sisal. Indications for 1993 were for export earnings in dollars to at least maintain the level achieved in 1992.
• The increase in the purchasing power of global exports of agricultural, fishery and forestry products in 1992 was 2 percent and for agricultural products alone, 4 percent relative to the previous year, after taking account of the rise in the unit values of manufactures and crude petroleum. In contrast to the global increase, the developing countries had a decline in the purchasing power of their agricultural exports. Further, compared with 197981, exports of many of these products would have purchased a far smaller amount of manufactures and crude petroleum. The contraction between 1979-81 and 1992 exceeded 60 percent for coffee and jute: commodities with declines of 25 to 60 percent included sugar, cocoa, coarse grains, cotton, sisal and natural rubber. In 1993 the purchasing power of agricultural exports probably rose a little.
• The dollar cost of food imports jumped in 1992. The increase for the developing countries as a whole was 13 percent and for those in the low-income food-deficit group was 14 percent. In 1993 these import bills were probably below the levels reached in 1992.
• The prospects for 1994 were of increased demand and reduced export supplies of some major commodities including rice, coarse grains, wheat, sugar, soybeans and related commodities, cocoa and coffee. Average prices and export earnings were expected to exceed 1993 levels for many of these commodities and for the aggregate of agricultural, fishery and forestry products.
• The year 1993 also saw progress or conclusion of important negotiations which could strongly shape patterns of agricultural trade in the medium-to-longer term. These included the conclusion of the Uruguay Round of Multilateral Trade Negotiations, embodied in a comprehensive Final Act including the Agreement on Agriculture and progress with regional integration exemplified by the North American Free Trade Agreement (NAFTA), the European Community's Single Market, the European Economic Area (EEA), MERCOSUR and many other regional arrangements in Latin America, the Caribbean, Asia and Africa.
Table 1. Selected indicators of agricultural commodity trade
| 1988-1990 Average | 1991 | 1992 change | 1991-92 | |||
| Percent | ||||||
| AGRICULTURE, FISHERY AND FORESTRY PRODUCTS | '000 million $ | |||||
| Total exports | World | 432 | 466 | 491 | 6 | |
| Developing countries | 116 | 124 | 1 | |||
| Developed countries | 316 | 343 | 368 | 7 | ||
| percent of all merchandise | ||||||
| Share of world trade1 | 14 | 13 | 13 | |||
| Export price indices: | Index: 1979-1981=100 | |||||
| Current prices2 | World | 98 | 94 | 95 | 1 | |
| Developing countries | 87 | 79 | 78 | -2 | ||
| Developed countries | 104 | 102 | 104 | 1 | ||
| Real prices3 | World | 81 | 76 | 74 | -3 | |
| Developing countries | 72 | 64 | 61 | -5 | ||
| Developed countries | 86 | 83 | 81 | -2 | ||
| AGRICULTURAL PRODUCTS | '000 million $ | |||||
| Total exports | World | 305 | 329 | 352 | 7 | |
| Developing countries | 88 | 90 | 92 | 2 | ||
| Developed countries | 218 | 238 | 259 | 9 | ||
| Index: 1979-1981=100 | ||||||
| Volume of exports | World | 119 | 123 | 129 | 5 | |
| Developing countries | 136 | 145 | 156 | 7 | ||
| Developed countries | 112 | 114 | 119 | 4 | ||
| '000 million $ | ||||||
| Total imports | Developing countries | 83 | 86 | 96 | 11 | |
| Developed countries | 249 | 268 | 286 | 7 | ||
| FOOD PRODUCTS4 | ||||||
| Total exports | Developing countries | 50 | 54 | 57 | 5 | |
| Developed countries | 149 | 166 | 181 | 9 | ||
| Total imports | Developing countries | 58 | 59 | 67 | 13 | |
| Low-income food-deficit countries5 | 23 | 21 | 24 | 14 | ||
| Food aid | 3 | 3 | 3 | - | ||
| Developed countries | 161 | 180 | 195 | 8 | ||
| Export price indices: | Index: 1979-1981=100 | |||||
| Current prices6 | World | 95 | 93 | 95 | 2 | |
| Real prices3 | World | 79 | 75 | 74 | -1 | |
| BEVERAGE CROPS7 | '000 million $ | |||||
| Total exports | World | 15 | 12 | 11 | -11 | |
| Export price indices: | Index: 1979-1981=100 | |||||
| Current prices | World | 66 | 53 | 49 | -8 | |
| Real prices3 | World | 55 | 43 | 38 | -11 | |
| RAW MATERIALS8 | '000 million $ | |||||
| Total exports | Developing countries | 19 | 19 | 19 | -2 | |
| Developed countries | 40 | 40 | 42 | 5 | ||
| Total imports | Developing countries | 17 | 19 | 19 | 5 | |
| Developed countries | 44 | 42 | 43 | 4 | ||
| Export price indices: | Index: 1979-1981 = 100 | |||||
| Current prices8 | World | 103 | 97 | 94 | -2 | |
| Real prices3 | World | 85 | 78 | 74 | -5 | |
1 World exports of agricultural, fishery and
forestry products as a percentage of all merchandise.
2 Derived from the UN indices entered as Group I and
Group II in Table 2.
3 Values at current prices deflated by the rise in
prices of manufactured exports and crude petroleum since 1979-81
as shown in Table 2.
4 The food products group includes cocoa and oil crops
for human consumption but excludes fish.
5 Low-income food-deficit countries (with per caput
GNP of $ 235 or less in 1992 and net importers of cereals).
6 UN index for Group I in Table 2.
7 Coffee, tea, cocoa and products.
8 Agricultural raw material excludes fishery products.
9 UN index for Group II in Table 2.
Sources: FAO, Statistics Division and Commodities and
Trade Division.
World
economic environment
Debts of developing countries increased
Food and agricultural production declined
slightly in 1993
Price decline reversed towards the end of 1993
Export
earnings growth in 1992
Contraction
in Africa's exports
Import growth highest in Africa in 1992
Real growth in export earnings likely in 1993
and 1994
Diversification, the source of growth in
earnings from agricultural exports
Economic conditions since 1990 continued to depress demand for agricultural products, and the availability of financial resources for agricultural development, in 1993. Little growth and rising unemployment remained dominant features of many developed countries' economies, while the level of economic activity in countries of Eastern Europe and of the former USSR has continued to decline. In contrast, the developing countries' economics have, in general and with the important exception of Africa, expanded at rates unparalleled since the 1970s. Another positive feature, common to many industrial and developing economics, has been the continuing reduction of inflation rates. Nevertheless, there was hyperinflation in several economics in transition.
World economic activity was expected to have expanded by 2.2 percent in 1993, according to the IMF, as the net result of 1.1 percent growth in the industrial countries, 6.1 percent in the developing countries and a further sharp contraction, estimated at about 10, percent, in the economies in transition.
Continuing weak growth in the industrial countries reflected asset devaluation and related financial adjustments, as well as difficulties in easing monetary policies in the light of exchange rate instability and budgetary deficits in several industrial countries, rising to their highest level since 1982. Weak growth also led to a sharp deterioration in labour market conditions, particularly in Western Europe. The unemployment rate in the EC reached 12 percent in 1993 and was projected to increase further in 1994.
Prospects for a significant recovery in the short and mid-term were uncertain. The IMF forecast GDP growth in 1994 in the industrial countries as a whole of 2.2 percent with 2.6 percent in the United States, 1.6 percent in the EC and 2 percent in Japan. The persistence of slow growth, and the resulting depressing effects on labour markets, may lead to increased protectionist pressure and add to the difficulty of reducing fiscal imbalances.
The overall improvement in the economic situation and prospects for the developing countries mainly reflected the continuation of dynamic economic performances of several countries in central and southeast Asia; the apparent consolidation of recovery in several countries undertaking structural reform in Latin America and the Caribbean; and sustained growth in some countries in the Near East, particularly the Islamic Republic of Iran and Turkey. China reported 13 percent growth in 1993, although with increasing signs of economic overheating. The recent growth performance of countries in the southern cone of Latin America, and other countries in the region, has also been encouraging. However, these success stories contrasted sharply with the continued depressed situation in many poor countries, particularly in Africa. There the,. adverse climate for exports, poor weather, wars and civil unrest and mounting macroeconomic imbalances in many countries, combined to reduce growth in 1993 to a meagre 1.5 percent, representing yet another decline in per caput terms.
Expectations for 1994 were for some narrowing of the growth performance gap between developing country regions, Africa's growth rising slightly to 2.6 percent yet still negative in per caput terms, that of Asia decelerating from 8.7 percent in 1993 to 7.1 in 1994 and that of Latin America and the Caribbean remaining broadly unchanged at 3.5 percent in both years.
The countries of Eastern Europe and the former USSR have continued to encounter major obstacles to sustained growth and economic transformation. Nevertheless, economic liberalization in several of these economies including the Czech Republic, Hungary and Poland, seemed to be lifting the performance of their economies. In contrast, growth and stabilization have remained elusive in the Russian Federation and other countries of the former USSR. The IMF estimated a 2 percent decline in Eastern Europe's GDP in 1993 but, for the first time since 1989, positive growth, of 1.9 percent, was expected in 1994. For the countries of the former USSR, the 14 percent GDP drop in 1993 would moderate to a 2 percent decline in 1994.
Expansion in the volume of world merchandise trade slowed to 3 percent in 1993, down from 5 percent in 1992. The slowdown mainly reflected depressed demand in Europe, with EC imports projected to decline by almost 3 percent. However, exports by the developing countries were expected to expand by 9 percent in volume, about the same rate as the previous year, thanks in particular to strongly increasing trade within the regions of Asia and of Latin America and the Caribbean.
In line with expectations of somewhat stronger economic growth, world trade growth was forecast to accelerate to 5 percent in 1994. The developing countries would again be the main driving force. Exports by the developing countries were forecast to increase by 9 percent, against only 3 percent for the industrial countries.
Debts of developing countries increased
The total external debt stock of all developing countries was projected to reach $1 770 billion at the end of 1993, up 7 percent from the previous year. The projected increase in debt stock was due to: a substantial increase in positive net flows to almost $90 billion in 1993; capitalization of interest through debt rescheduling contributing $15 billion; and the effect of changes in the value of the dollar adding another $23 billion. Deductions from the debt stock totalled $19 billion in 1993 comprising: part forgiveness of debt and voluntary debt reduction of $9 billion; and decreases in interest arrears of $10 billion. However, for the severely indebted low income countries debt forgiveness, mainly by official bilateral creditors, has been largely offset by capitalization of interest and accumulated interest arrears. At the regional level, East Asia and the Pacific showed the largest growth of external debt liabilities, mainly as the result of easy access to capital markets by many countries of the region. The debt-to-export ratio of developing countries was projected to increase to 180 percent in 1993 while for sub Saharan Africa, it was projected to remain at the previous year's high level of 237 percent.
Aggregate net long-term resource flows to developing countries more than doubled since 1990 to a projected $177 billion in 1993. This reflected their improved access to international capital markets and for some regions, especially Latin America, an increase in net flows from a reversal of capital flight.
In 1993, the flow from private sources rose 11 percent to over $113 billion, the highest in the decade. In addition, official flows comprising loans and grants of $63 billion were projected for 1993. The expansion of private capital flows was driven by a strong surge in foreign direct investment which exceeded official flows for the second consecutive year. The main recipients of private resource flows have been middle-income countries undergoing vigorous and market-oriented economic policy reforms and the countries that have avoided an overhang of commercial bank debt. Most low-income countries have not benefited from rapidly rising private capital flows, except China, which was the largest single recipient of foreign direct investment among the developing countries. Total debt service payments of all developing countries increased 2 percent to $183 billion in 1993. The ratio of debt service to export earnings remained at 19 percent, unchanged since 1990. For sub-Saharan Africa, it would decline from 17 percent to 13 percent.
Food and agricultural production declined slightly in 1993
Preliminary estimates indicated a slight decline in global crop and livestock production in 1993. The decline was mainly attributable to a contraction in the developed countries of 3 percent, with virtually all developed country regions experiencing production decreases. The largest decline was in North America, a fall of 6 percent as adverse weather conditions in the United States hit grain and soya bean production in particular. A 6 percent drop was also estimated for Oceania. Agricultural production continued to decline in the countries of the former USSR, although the estimated 2 percent contraction was less than that of the previous two years. This production shortfall mainly reflected a further decline in livestock production which more than offset a slight recovery in crop production. In Europe, agricultural production in 1993 contracted by 1.4 percent. The decline in the EC of 2.2 percent resulted from reduced plantings due to set-aside of land and adverse weather conditions in large producing areas.
For developing countries as a whole, preliminary estimates pointed to an expansion of agricultural production in 1993 of just one percent, well below the population growth rate. Africa was estimated to have expanded production by 3 percent, the highest regional increase in 1993. This would mainly be the result of a recovery in southern Africa from the drought-stricken harvests of 1992, but also of a 4 percent expansion in Nigeria. The estimated overall increase in Africa in 1993 should be seen against the 3 percent decline in the previous year.
Among the other developing country regions, probably only the Far East increased output in 1993, albeit by only one percent, with production declining slightly in China and increasing moderately in India. In Latin America and the Caribbean indications were of a one percent decline. There, a 3 percent increase in livestock production did not fully offset crop shortfalls in such major producing countries as Mexico, Brazil, Argentina and Colombia. In the Near East, preliminary data pointed to a slight decrease in agricultural production following a 6 percent increase in the previous year.
Table 2. UN export juice indices
| 1969-90 Average | 1991 | 1992 | 1993 | ||
| Indices 1979-81=100 | |||||
| Agricultural fishery and forestry commodities1 | |||||
| World | 98 | 94 | 95 | 50 | |
| Developing countries | 87 | 79 | 78 | 75 | |
| Developed countries | 104 | 102 | 104 | 96 | |
| Group I | |||||
| World | 95 | 93 | 95 | 90 | |
| Developing countries | 82 | 73 | 70 | 70 | |
| Developed countries | 102 | 103 | 107 | 98 | |
| Beverage crops | 66 | 53 | 49 | 53 | |
| Sugar | 65 | 61 | 61 | 56 | |
| Cereals | 90 | 91 | 98 | 88 | |
| Meat | 108 | 111 | 110 | 109 | |
| Dairy products | 112 | 112 | 117 | 111 | |
| Fish | 118 | 126 | 129 | 118 | |
| Group II | |||||
| World | 103 | 97 | 94 | 88 | |
| Developing countries | 95 | 89 | 89 | 84 | |
| Developed countries | 109 | 101 | 97 | 91 | |
| Oilseeds | 83 | 76 | 77 | 80 | |
| Textile fibres | 101 | 89 | 73 | 66 | |
| Natural rubber | 79 | 65 | 68 | 67 | |
| Hides and skins | 172 | 126 | 120 | 132 | |
| Forestry products | 117 | 115 | 114 | 101 | |
| Other | |||||
| Crude petroleum | 68 | 61 | 59 | 52 | |
| Manufactures | 130 | 137 | 144 | 140 | |
| Manufactures and crude petroleum2 | 121 | 124 | 128 | 124 | |
1 The index for agricultural, fishery and forestry
commodities win derived from the UN indices entered as Group I
and II.
2 The index for manufactures and crude petroleum was
derived front the indices for thew products with weights adjusted
by changes in their volumes traded internationally.
Source: UN Monthly Bulletin of statistics.
Price decline reversed towards the end of 1993
It was only in the fourth quarter of 1993 that prices of agricultural, fishery and forestry commodities generally rose above those of the previous year. For the year as a whole the average level of prices, in dollars, was 6 percent below that of 1992, as indicated by UN indices of export prices (Table 2). However, the decrease was larger for the main exports of the developed countries, such as wheat, maize and livestock products, amounting to an 8 percent overall decrease. In contrast, the decrease for the developing countries was 3 percent as these countries benefited from increases in some of their main exports, notably for coffee, cocoa and soybean oil. For coffee and cocoa the reversal of the decline that had halved prices since 1979-81 reflected reduction in exportable supplies because of reduced output and producers' moves to control quantities entering international trade.
In the last quarter of 1993 sharply increased prices were paid for commodities affected by reductions in harvests and anticipated increases in demand for imports. Flood devastation in the United States reduced the output and quality of soybeans and maize in particular. Soybean prices in the United States jumped 16 percent from June to July, maize jumped 9 percent between these months. Thereafter these prices continued to increase as did prices of related commodities such as other oilseeds and vegetable oils. Output of rice in Japan fell sharply and the prospective volume of sales drove the market up. The FAO export price index for high quality rice finished the year 55 percent above its level at mid year, though the price of lower qualities in abundant supply rose less. Sugar's international reference price went up to finish the year 40 percent above its level at the end of 1992. The increase reflected a further depletion of stocks and continued growth in demand.
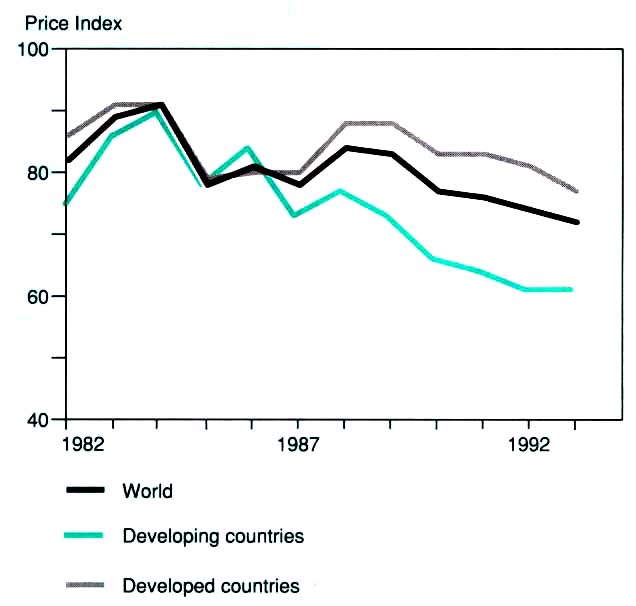
The barter terms of trade between on the one hand the agricultural, fishery and forestry commodities, and on the other manufactured goods and crude petroleum declined by a further 3 percent in 1993. The decline in the nominal price, of 6 percent, was partly offset 100 by a 3-4 percent decline in unit values of manufactured goods and crude petroleum in international trade, also expressed in dollars. For the developing countries there was no overall decline in the real price of their agricultural exports for the first time since 1988. However, the years of decline had, by 1993, brought their price to a level 39 percent below that in the years 1979-81. For the developed countries the comparable decline in real prices was 23 percent.
Real export price indices agricultural, fishery and forestry products 1979-81.