Large deficit expected in 1993/94
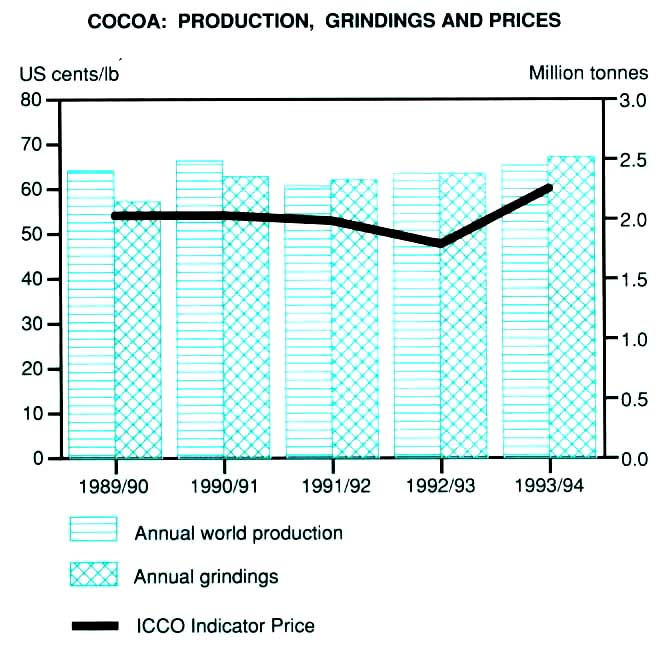
World cocoa production in 1993/94 was forecast to fall to 2.3 million tonnes of raw beans, nearly 3 percent less than in the previous year. However, preliminary indications are that grindings in 1993/94 will be some 2 percent above the 1992/93 level and should approach 2.5 million tonnes. Thus there is a prospective deficit in supplies for the third consecutive year. This deficit, of over 200 000 tonnes, is the largest since 1988/89.
The 100 000 tonne output decline in Africa was not likely to be offset by increases in Latin America and the Far East. In Côte d'Ivoire, there was a low yield of pods from the main crop, following tree stress from the unusually high mid crop of the previous season. The crop was expected to amount to 650 000 tonnes, some 50 000 tonnes less than the previous season and 150 000 tonnes less than the average of 1988-90. A larger decline was expected in Ghana, again because of tree stress. The crop was expected to be 60 000 tonnes down, a reduction of almost 20 percent from the previous year. Pod development was satisfactory in Nigeria but a sharp reduction in the use of fungicides has led to an increase in the incidence of black pod disease, which may reduce the main crop significantly. Though production was forecast to increase slightly in Cameroon, the increase will be restricted by disease following a lack of application of fungicides.
In Latin America, dry weather inhibited both black pod and witches' broom disease in Brazil but also prevented fruit from setting early in the season, though some recovery was evident at a later stage. The net effect pointed to a small increase in the crop. In Asia, the recent growth in output by Indonesia was forecast to continue. This followed a substantial expansion in the area under bearing trees with the number of young trees buttressing production for some time. Some losses have occurred from the depredations of the cocoa pod borer but these have been contained. In Malaysia depressed world prices resulted in a small decrease in the area planted, a reduction in husbandry and less control of the cocoa pod borer. As a result, and despite reasonably favourable weather, output was expected to fall slightly.
Cocoa: production, grindings and prices
In 1992/93 production had recovered
Global production in 1992/93 recovered to 2 335 000 tonnes, 3 percent higher than in the previous year. This principally reflected very favourable weather in Ghana, where the crop was 28 percent up and a further increase in the number of bearing trees in Indonesia. Elsewhere, small increases in Latin American harvests were overshadowed by another and substantial decline in Côte d'Ivoire. To some extent, this reflected the decision by the authorities to Close Purchases by 30 April 1993 and as a result some of the mid crop remained in the hands of growers. This, may be added to sales of the 1993/94 crop. However, as there was some deterioration during storage, the quality of some 1993/94 sales may suffer.
Slow growth in grindings and consumption forecast for 1993/94
Preliminary indications are that grindings in 1993/94 will be some 2 percent above the 1992/93 level and should approach 2.5 million tonnes. Growth in Eastern Europe and countries of the former USSR should continue its previous recovery without, however, returning to the levels of 1988-90. Slower than average growth was expected in western Europe though there were prospects for a notable expansion in product exports. Improved economic prospects in the United States were expected to lead to a 3 percent increase in grindings. In the developing countries, increased consumption in Indonesia and Malaysia and some increase in the sale of processed cocoa by Malaysia to China were expected to result in an increase of 5 percent in grindings in the Far East.
In 1992/93 grindings grew 4.6 percent
Grindings, in product weight, some 99 percent of raw beans, were 2.415 million tonnes in 1992/93, 4.5 percent greater than the previous year. The major increases were confined to USSR. In countries of the former USSR, grindings recovered sharply to 85 000 tonnes following the slump in 1991/92. Nevertheless, they were still 60 000 tonnes less than the average of 1988-90 but much of the decline was offset by imports of chocolate from western Europe. The European Community (EC) exported over 29 000 tonnes of chocolate to countries of the former USSR in 1992. This compares with under 3 000 tonnes in 1991 and 570 tonnes in 1990. Grindings in the United States increased by 16 percent, largely at the expense of previous imports of processed cocoa, particularly products from Brazil. Grindings fell slightly in the developing countries.
Trade in cocoa beans stagnant in 1992
Exports of cocoa beans declined 3 percent in 1992 to a little above the average for 1988-90. Exports from Africa fell by 9 percent with substantially reduced shipments by Côte d'Ivoire, Ghana and Nigeria. This shortfall was partly compensated by record exports from Indonesia which was the largest supplier of cocoa beans to the United States in 1992. The principal decrease in imports was by countries of the former USSR. Their imports were only half those for the previous year and 30 percent of the 1988-90 average. Availability of foreign exchange had been a major constraint for the formerly centrally planned economies but this had been eased in Eastern Europe by the domestic operations of processors with headquarters in western Europe.
The unit value for exports of beans remained unchanged at $1.07/kg. This was about one-quarter less than the average of 1988-90 and $0.52/kg less than the recent peak of 1988. The value of all cocoa exports, including products, remained virtually unchanged at almost $3.8 million. However, there was a 3 percent fall in the value of exports by the developing countries. This reflects some slackness in the export trade in cocoa products, both in volume
Some recovery In prices in 1993
Prices, which fell substantially during the first six months of 1993, recovered in the third quarter of 1993 with the ICCO indicator price rising above SDR 1000/tonne, for the first time since July 1990, to regain the average level in 1988-90. The recovery was principally based on the reaction of the market to the deficit forecast for 1993/94.
Improving price outlook for 1994
Upward pressure on prices was expected in 1994 as a result of both fundamental and expectational factors. In fundamental terms, consumption was expected to continue to exceed production reducing world stocks from their level of 1.4 million tonnes at the end of September 1993. The expected deficit of 0.2 million tonnes in 1993/94 would reduce stocks to 1.2 million tonnes by the end of the crop year. This, similar to the average for 1988-90, will represent about half a year's consumption compared to over two-thirds in 1991/92.
Upward pressure on prices would remain while these expectations hold sway in the trade. Furthermore, there was a successful conclusion to the negotiations for a new Cocoa Agreement, now based on export quotas and consumption promotion rather than on buffer stocks. However, there will be some delay to implementation as attempts to obtain the accession of two important producing countries, Indonesia and Malaysia, continue. As Indonesia is a major supplier to the United States, which is not a member of the Cocoa Agreement, the absence of both countries might prove to be a problem when setting quotas. However, if the Agreement becomes operational then, despite the absence from membership of the United States and the possible absence of Indonesia, it should be possible for prices to be maintained above the floor level set under the Agreement. Nevertheless stocks, though declining, are still considerable and will tend to moderate price increases. So too will the decision to liquidate ICCO buffer stocks.
Production1, 2
| 1988-90 Average | 1991 | 1992 | 1993 | ||
| '000 tonnes, raw value | |||||
| World total | 2469 | 2267 | 2335 | 2270 | |
| Developing countries | 2469 | 2267 | 2335 | 2270 | |
| Latin America | 629 | 565 | 570 | 580 | |
| Brazil | 347 | 290 | 300 | 310 | |
| Dominican Rep. | 48 | 48 | 50 | 50 | |
| Ecuador | 95 | 85 | 92 | 90 | |
| Africa | 1 426 | 1 242 | 1 270 | 1 170 | |
| Cameroon | 123 | 105 | 92 | 100 | |
| Côte d'Ivoire | 800 | 747 | 697 | 650 | |
| Ghana | 297 | 243 | 310 | 250 | |
| Nigeria | 162 | 110 | 130 | 130 | |
| Asia and Oceania | 414 | 460 | 495 | 520 | |
| Indonesia | 123 | 180 | 220 | 250 | |
| Malaysia | 230 | 220 | 215 | 210 | |
1 Crop year beginning 1 October in the year stated.
2 Beans only.
Grindings1
| 1988-90 Average | 1991 | 1992 | 1993 | ||
| '000 tonnes | |||||
| World total | 2116 | 2354 | 2312 | 2415 | |
| Developing countries | 732 | 858 | 811 | 792 | |
| Latin America | 395 | 474 | 420 | 392 | |
| Africa | 172 | 165 | 168 | 164 | |
| Near East | 4 | 6 | 7 | 6 | |
| Far East | 161 | 213 | 216 | 230 | |
| Developed countries | 1 384 | 1 496 | 1 501 | 1 623 | |
| North America | 270 | 290 | 310 | 354 | |
| United States | 248 | 265 | 307 | 321 | |
| Europe | 920 | 1 065 | 1 111 | 1 134 | |
| EC | 784 | 942 | 986 | 1 017 | |
| Eastern Europe | 96 | 83 | 85 | 77 | |
| Former USSR | 146 | 83 | 25 | 85 | |
| Other developed countries | 47 | 58 | 55 | 50 | |
| Japan | 42 | 52 | 49 | 44 | |
1 Crop year ending 30 September of the year stated.
Exports1
| 1988-90 Average | 1991 | 1992 | ||
| '000 tonnes raw value | ||||
| World total2 | 1 730 | 1 819 | 1757 | |
| Developing countries | 1 730 | 1 819 | 1757 | |
| Latin America | 247 | 202 | 199 | |
| Brazil | 120 | 84 | 84 | |
| Dominican Rep. | 45 | 41 | 44 | |
| Ecuador | 53 | 51 | 35 | |
| Africa | 1 112 | 1 194 | 1092 | |
| Cameroon | 102 | 66 | 85 | |
| Côte d'Ivoire | 590 | 702 | 659 | |
| Ghana | 234 | 248 | 224 | |
| Nigeria | 142 | 135 | 95 | |
| Asia and Oceania | 373 | 423 | 465 | |
| Indonesia | 76 | 127 | 155 | |
| Malaysia | 174 | 149 | 125 | |
1 Beans only.
2 Excluding re-exports.
Imports1
| 1988-90 Average | 1991 | 1992 | ||
| '000 tonnes, raw value | ||||
| World total | 1 657 | 1 884 | 1 837 | |
| Developing countries | 132 | 150 | 157 | |
| Latin America | 6 | 10 | 5 | |
| Africa | 1 | 1 | 2 | |
| Near East | 6 | 8 | 8 | |
| Far East | 118 | 131 | 143 | |
| Developed countries | 1 525 | 1 734 | 1 680 | |
| North America | 302 | 422 | 427 | |
| United States | 280 | 392 | 379 | |
| Europe | 1 033 | 1 175 | 1 161 | |
| EC | 910 | 1 083 | 1 076 | |
| Eastern Europe | 69 | 41 | 44 | |
| Former USSR | 141 | 78 | 40 | |
| Other developed countries | 49 | 58 | 52 | |
| Japan | 45 | 51 | 46 | |
1 Beans only.
Value of exports1
| 1988-90 Average | 1991 | 1992 | ||
| Million $ | ||||
| World total | 4318 | 3749 | 3764 | |
| Developing countries | 3200 | 2670 | 2583 | |
| Brazil | 398 | 272 | 258 | |
| Cameroon | 190 | 94 | 112 | |
| Côte d'Ivoire | 976 | 907 | 899 | |
| Dominican Rep. | 53 | 33 | 35 | |
| Ecuador | 110 | 107 | 78 | |
| Ghana | 425 | 313 | 285 | |
| Indonesia | 95 | 143 | 153 | |
| Malaysia | 270 | 248 | 233 | |
| Nigeria | 212 | 145 | 113 | |
| Others | 472 | 409 | 417 | |
1 Including cocoa products.
Stocks1
| 1988-90 Average | 1991 | 1992 | 1993 | |
| '000 tonnes | ||||
| World total2 | 1 196 | 1 592 | 1 522 | 1 389 |
| ICCO buffer stocks | 248 | 242 | 233 | 230 |
1 At end of September of the year shown.
2 ICCO data.
Export unit value1
| 1988-90 Average | 1991 | 1992 | ||
| US cents/kg | ||||
| World total | 142 | 107 | 107 | |
| Developing countries | 140 | 106 | 106 | |
| Brazil | 131 | 105 | 99 | |
| Cameroon | 153 | 114 | 115 | |
| Côte d'Ivoire | 148 | 110 | 115 | |
| Dominican Rep, | 111 | 77 | 76 | |
| Ecuador | 125 | 107 | 100 | |
| Ghana | 169 | 112 | 114 | |
| Indonesia | 110 | 94 | 83 | |
| Malaysia | 119 | 100 | 98 | |
| Nigeria | 136 | 100 | 102 | |
| Others | 122 | 99 | 102 | |
1 Beans only.
Prices
| 1988-90 Average | 1991 | 1992 | 1993 | ||
| ICCO daily | |||||
| US cents/lb (450 g) | 73 | 54 | 50 | 51 | |
| SDR/tonne | 1 230 | 872 | 781 | 800 | |
| Ghana, spot London | |||||
| £stg/tonne | 1 109 | 705 | 684 | 838 | |