Substantial recovery in 1993 production anticipated
Preliminary indications of harvests during the first half of 1993 suggested that world tea production would recover from the very low level of the previous year. First estimates for the 1993 crop indicate a total output of around 2 540 000 tonnes with about 54 percent CTC and 46 percent orthodox teas. Substantial increases in harvests were expected in India, Sri Lanka, Kenya, Malawi and all other producing countries in East Africa.
Production dropped significantly in 1992
In 1992 global production of tea fell below the 1991 record crop by over 9 percent, with large crop reductions in India, Sri Lanka, Kenya and Malawi and more moderate declines in some other East African countries and in China. In all cases the crop losses were caused by extreme drought conditions during the early part of the year. In India output declined by 9 percent from the 1991 level. The decrease mainly reflected the smaller crop in South India, which was 15 percent below the previous year, at 157 000 tonnes. The tea harvest in North India also fell by some I 1 000 tonnes. In Sri Lanka, production was 25 percent lower than in 1991, at 179 000 tonnes. The only countries to report an increase in output for 1992 were Indonesia with a rise of about 2 percent and Bangladesh, where the tea harvest was up by 7 percent from the previous year's level. The increase was mainly due to new plantings coming into production.
Import demand and trade also down in 1992
Global exports of tea fell by 9 percent to 1 014 000 tonnes in 1992. The main reasons for this were a decline in import demand, particularly by the former USSR and Iraq. The volume of tea imported by the former USSR fell from a record level of 231 000 tonnes in 1990 to only 73 000 tonnes in 1992. Factors causing this decrease were a shortage of foreign exchange, high inflation and a further weakening of the rouble. Shipments to Eastern Europe recovered from the low levels of 1991 mainly due to a 50 percent increase of imports by Poland. Purchases by the United Kingdom fell slightly following much reduced imports from Kenya and Malawi, which were not fully offset by the larger shipments from India and Indonesia and the lower re-exports. Imports into the United States rose by 8 percent, reaching a level close to the 1988 record.
Tea imports by developing countries were estimated to have increased slightly in 1992. Larger imports by Chile, Saudi Arabia, Syria and particularly Pakistan, were only partly offset by lower shipments to Afghanistan, the Islamic Republic of Iran and Sudan. Reported imports into Iraq amounted to only 1 600 tonnes, compared to a 46 000 tonnes average in the 1987-89 period, reflecting the United Nations trade embargo.
The contraction in exports in 1992, most notably affected India and Sri Lanka. Exports from India declined to only 173 000 tonnes following the drop in output and higher domestic consumption, which has grown faster than production in recent years. Sri Lanka's exports also declined, by 16 percent, to 178 000 tonnes. The sharp decrease was the consequence of the complete collapse of exports to Iraq and reduced shipments to the Islamic Republic of Iran, Jordan, Libya, the United Arab Emirates, Pakistan and Egypt, which were not offset by the higher sales to Syria and Germany. Exports from Sri Lanka to the former USSR virtually hatted, and shipments of value added teas declined considerably. Packeted tea exports declined by 21 percent to around 55 000 tonnes, while shipments of tea bags and instant tea remained almost constant. By contrast, exports from Bangladesh and Indonesia increased in 1992, with Indonesia's shipments up by 10 percent from the previous year. Exports from Kenya, at 166 000 tonnes, were 5 percent below their 1991 record level reflecting the substantial decline in production. Exports from other African countries remained unchanged in total. In South America, shipments from both Argentina and Brazil rose moderately.
Recovery in 1903
The global level of trade was expected to recover significantly in 1993 to judge from early data. While Indian Government estimates for 1993 pointed to export availabilities of well above 200 000 tonnes, it will be difficult to achieve this figure considering that production will most likely remain below the 1991 peak while growth in domestic consumption is again likely to outpace growth in production. Under these circumstances, exports of tea from India in 1993 seemed unlikely to surpass 200 000 tonnes. Exports from Sri Lanka up to the end of July 1993, at 117 000 tonnes, were 16 percent above those in the comparable period of 1992. The sharp increase was the consequence of a complete recovery in production after the drought losses in 1992, much larger purchases by the United Arab Emirates and Syria and a strong return to Sri Lanka of buyers from the former USSR. These increases were only partly offset by smaller sales to Egypt and the Islamic Republic of Iran. A continuation of these trends throughout the year implied a return of Sri Lanka's exports to the range of 200 000 to 210 000 tonnes. Exports from Bangladesh and Indonesia during the first half of 1993 were also notably higher than in the first six months of 1992.
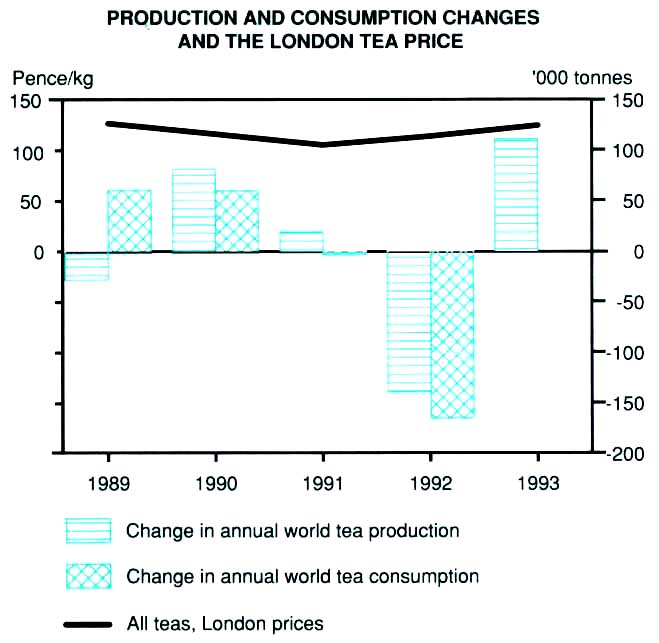
Production and consumption changes and the London tea prices
In East Africa, exports from Kenya during the first seven months of the year were about 4 percent above the level of the same period in 1992 and the year's outcome could equal the 1991 record reflecting the larger crop. Sales from other East African tea producers were expected to remain largely unchanged.
Latest import figures for the major market of the United Kingdom indicated a significant increase during the first seven months of 1993 reflecting the reversal of a prolonged decline in consumption supported by the introduction of specially flavoured teas. Elsewhere in the EC there were no notable changes. There are no official data available on imports by the countries of the former USSR, however data from some major exporting countries indicate that shipments to this area will increase significantly in 1993. By contrast, purchases by the United States from January to July 1993 declined by almost 15 percent. Among developing countries, it would appear that purchases by Pakistan are likely to continue their upward trend.
Price outlook remains uncertain
The sizeable increase in purchases by the countries of the
former USSR, higher imports by the United Arab Emirates and by
the United Kingdom stimulated a pickup in tea prices in 1993,
despite the increased crop. The average level of auction prices,
expressed in US dollars, increased in all auction centres except
London and Mombasa, where prices had boomed temporarily in the
early months of the previous year due to an exceptional crop
shortfall. Expressed in national currencies the price increases
were larger reflecting a decline in their rates of exchange
relative to the US dollar in 1993. It was difficult to assess the
impact of the larger 1993 crop on future price developments, but
there were reasons for prices to remain above the depressed
levels of 1992. In particular, low stocks were reported for both
exporting and importing countries. In addition, there was the
potential for increased import demand from the former USSR and a
return of Iraq to the market.
Production
| 1988-90 Average | 1991 | 1992 | ||
| '000 tonnes | ||||
| World total | 2493 | 2 568 | 2372 | |
| Developing countries | 2 265 | 2 351 | 2 215 | |
| Latin America | 55 | 60 | 61 | |
| Africa | 291 | 322 | 286 | |
| Kenya | 181 | 204 | 188 | |
| Near East | 189 | 184 | 187 | |
| Far East | 1 724 | 1 779 | 1 674 | |
| China | 563 | 563 | 551 | |
| India | 700 | 742 | 704 | |
| Indonesia | 140 | 133 | 136 | |
| Sri Lanka | 223 | 242 | 179 | |
| Others | 98 | 99 | 104 | |
| Developed countries | 228 | 217 | 157 | |
| Former USSR | 125 | 116 | 55 | |
| Japan | 90 | 88 | 91 | |
Consumption1
| 1988-90 Average | 1991 | 1992 | ||
| '000 tonnes | ||||
| World total | 2472 | 2 532 | 2 368 | |
| Developing countries | 1 629 | 1 749 | 1 744 | |
| Latin America | 29 | 31 | 32 | |
| Africa | 99 | 101 | 108 | |
| Near East | 412 | 452 | 410 | |
| Far East | 1 089 | 1 165 | 1 194 | |
| China | 341 | 361 | 358 | |
| India | 480 | 520 | 540 | |
| Pakistan | 104 | 111 | 119 | |
| Developed countries | 843 | 783 | 624 | |
| North America | 96 | 95 | 101 | |
| United States | 82 | 82 | 88 | |
| Europe | 263 | 239 | 223 | |
| EC | 216 | 218 | 212 | |
| United Kingdom | 161 | 152 | 148 | |
| Eastern Europe | 36 | 12 | 3 | |
| Former USSR | 315 | 277 | 128 | |
| Other developed countries | 169 | 172 | 172 | |
| Japan | 120 | 124 | 132 | |
1 FAO estimates.
Exports1
| 1988-90 Average | 1991 | 1992 | ||
| '000 tonnes | ||||
| World total | 1 098 | 1 075 | 1 014 | |
| Developing countries | 1 098 | 1 075 | 1 014 | |
| Latin America | 51 | 45 | 49 | |
| Africa | 249 | 269 | 258 | |
| Kenya | 157 | 176 | 166 | |
| Near East | 19 | 4 | 6 | |
| Far East | 774 | 755 | 699 | |
| China | 206 | 190 | 181 | |
| India | 207 | 203 | 173 | |
| Indonesia | 106 | 110 | 121 | |
| Sri Lanka | 213 | 211 | 178 | |
| Others | 41 | 41 | 46 | |
1 Net exporting countries only.
Imports1
| 1988-90 Average | 1991 | 1992 | ||
| '000 tonnes | ||||
| World total | 1 075 | 1 062 | 1 006 | |
| Developing countries | 450 | 503 | 506 | |
| Latin America | 13 | 15 | 16 | |
| Africa | 62 | 68 | 69 | |
| Near East | 241 | 281 | 269 | |
| Far East | 133 | 139 | 152 | |
| Pakistan | 100 | 111 | 119 | |
| Developed countries | 579 | 559 | 500 | |
| North America | 98 | 95 | 102 | |
| United States | 83 | 82 | 88 | |
| Europe | 259 | 233 | 250 | |
| EC | 211 | 212 | 209 | |
| United Kingdom | 156 | 146 | 145 | |
| Eastern Europe | 38 | 12 | 32 | |
| Former USSR | 156 | 161 | 73 | |
| Other developed countries | 66 | 70 | 75 | |
| Japan | 28 | 37 | 42 | |
1 Excluding quantities subsequently re-exported.
Value of exports1
| 1988-90 Average | 1991 | 1992 | ||
| Million $ | ||||
| World total | 2038 | 1 956 | 1 822 | |
| Developing countries | 2 038 | 1 956 | 1 822 | |
| Latin America | 43 | 39 | 42 | |
| Africa | 359 | 394 | 401 | |
| Kenya | 249 | 278 | 294 | |
| Near East | ... | 3 | 6 | |
| Far East | 1 601 | 1 518 | 1 371 | |
| China | 433 | 396 | 380 | |
| India | 530 | 484 | 412 | |
| Indonesia | 156 | 143 | 141 | |
| Sri Lanka | 418 | 432 | 364 | |
1 Excluding the value of re-exports.
Per caput consumption
| 1988-90 Average | 1991 | 1992 | ||
| Grams per head | ||||
| World total | 477 | 480 | 440 | |
| Developing countries | 413 | 420 | 410 | |
| Latin America | 70 | 70 | 70 | |
| Africa | 193 | 190 | 190 | |
| Near East | 1 493 | 1 550 | 360 | |
| Far East | 397 | 410 | 410 | |
| China | 303 | 310 | 310 | |
| India | 580 | 600 | 610 | |
| Pakistan | 910 | 920 | 950 | |
| Developed countries | 677 | 660 | 530 | |
| North America | 353 | 340 | 360 | |
| United States | 333 | 320 | 350 | |
| Europe | 527 | 570 | 530 | |
| EC | 663 | 820 | 800 | |
| United Kingdom | 2 793 | 2 630 | 2 540 | |
| Eastern Europe | 313 | 120 | 30 | |
| Former USSR | 1 093 | 950 | 440 | |
| Other developed countries | 883 | 890 | 890 | |
| Japan | 973 | 1 000 | 1 070 | |
Export unit value1
| 1988-90 Average | 1991 | 1992 | ||
| US cents/kg | ||||
| World total | 185 | 182 | 180 | |
| Developing countries | 185 | 182 | 180 | |
| Africa | 144 | 146 | 155 | |
| Kenya | 158 | 158 | 177 | |
| Far East | 207 | 201 | 196 | |
| China | 210 | 208 | 210 | |
| India | 255 | 238 | 238 | |
| Indonesia | 147 | 130 | 116 | |
| Sri Lanka | 196 | 205 | 205 | |
1 Excluding the value of re-exports.
Prices
| 1988-90 Average | 1991 | 1992 | 1993 | |
| National currency kg | ||||
| Average auction prices | ||||
| Colombo (rupees) | 57 | 59 | 62 | 69 |
| Calcutta (rupees) | 39 | 48 | 43 | 54 |
| Cochin (rupees) | 32 | 35 | 35 | 43 |
| Monbasa (shillings) | 30 | 39 | 53 | 87 |
| London (pence) | 114 | 105 | 113 | 124 |
| US cents/kg1 | ||||
| Colombo2 | 167 | 151 | 149 | 145 |
| Calcutta | 239 | 207 | 168 | 179 |
| Cochin | 197 | 158 | 135 | 142 |
| Mombasa | 145 | 143 | 165 | 153 |
| Average3 | 185 | 164 | 157 | 153 |
| London | 197 | 186 | 197 | 187 |
1 Converted monthly on the basis of average
exchange rates reported by IMF.
2 Including export duties.
3 The average is a weighted average of the four series
shown.