Production forecast to recover in 1993/94
World production of centrifugal sugar was forecast to rise 1.9 percent to 113 million tonnes in 1993/94, recovering from a 3 percent fall in the previous year. Cane sugar production was expected to increase by 1.7 percent to 74 million tonnes and beet sugar remained virtually unchanged at 39 million tonnes. The increase would reflect recovery in output in India, Indonesia and Thailand, and better crops in Pakistan, Ukraine, the Russia Federation, Poland and in Cuba, after the disastrous crop there in 1992/93. Part of the increase in these countries would be offset by declines in the EC, Australia and South Africa.
In India production would increase following the implementation of Government measures to improve the financial condition of the mills. Thailand's increase would be from the sharply reduced output in 1992/93 and Poland's would reflect greatly expanded area and favourable weather. By contrast and even with favourable weather, EC output was likely to decline mainly due to contraction in the area sown. In Australia drought during the growing season was likely to reduce output, while South Africa's further decline would be due to the previous year's serious drought.
Contraction in 1992/93 the first since 1986/87
In 1992/93 world sugar production declined by 3 percent to 112 million tonnes, the first contraction in six years. Global cane sugar output fell by some 5 million tonnes to 73 million tonnes, while output of beet sugar increased by one million tonnes to 39 million tonnes. The decline in cane sugar was due to a sharp fall in output mainly in Cuba, India, Thailand and South Africa. Higher beet sugar production reflected an increase in the EC.
Consumption forecast to Increase in 1994
World sugar consumption was forecast to rise by 1.5 percent to 114 million tonnes in 1994, the same rate of increase as in 1993. Consumption was expected to increase in the developing countries particularly in the highly populated ones such as Brazil, Egypt, India, Indonesia, Mexico and Pakistan. Among the developed countries, consumption was projected to increase in the United States, reflecting a slight rise in per caput consumption and higher industrial requirements as the economy expands. A small increase was also likely in the EC. However, outside the EC overall demand in western Europe would remain stable, while in eastern European countries demand might decline further due to increased domestic sugar prices and economic difficulties.
Carryover stocks forecast to decline further in 1993/94
World carryover stocks of sugar, which had declined by 1.8 million tonnes to 37.5 million tonnes by 31 August 1993, were expected to decline by a further one million tonnes during 1993/94. The stock/consumption ratio in 1993/94 could fall to 30 percent against 35 percent two years ago. The greatest reduction in stocks would occur in India and in China, where considerable surpluses had accumulated. In general, exportable supplies should be adequate as import demand was forecast to decline. However, the crucial question was the adequacy of these stocks to cushion any major and unforeseen shortfalls in production.
World sugar trade had recovered in 1992
In 1992 world trade in centrifugal sugar recovered to 31 million tonnes. The increase reflected enlarged exports from the developing countries, mainly Thailand, India and the Republic of Korea. These increases were partly offset by less from developed countries, such as Australia and South Africa. The main increases in imports were in Africa and in the countries of the former USSR.
In contrast trade declined in 1993
In 1993, world sugar imports were forecast to decline by 4 percent to 30 million tonnes. Among the major importing countries, the United States was expected to have reduced import requirements owing to ample domestic supplies. Imports by the countries of the former USSR were likely to decline due to scarcity of foreign exchange, falling incomes and the phasing out of subsidies. Imports into the eastern European countries would also decline due to economic difficulties. By contrast, Argentina and Mexico would import larger quantities and India and China might also become net importers, due in every case to reduced levels of production.
Preliminary data for exports during the first nine months of 1993 indicated that of the major exporting countries, only Thailand and Brazil would ship more than during the corresponding period in 1992. The expansion in Thailand and Brazil reflected increased availability.
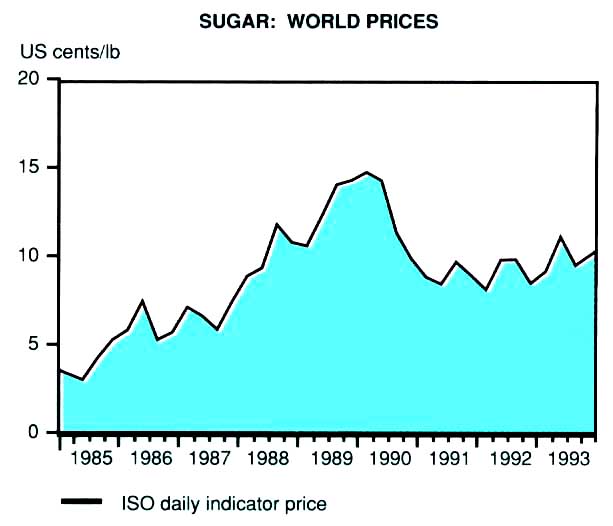
Export earnings forecast to decline in 1993
Export earnings from sugar remained unchanged at $10 600
million in 1992 despite the increased volume. Earnings were
unlikely to rise in 1993, as the effect of a slight rise in
prices was likely to be offset by reduced volumes. By mid-May
1993, world sugar prices had reached their peak for the year
following a substantial downward revision in estimates of 1992/93
output in Cuba and Thailand, two of the main exporting countries.
Prices then moved down with increased output in Australia and
Brazil and no notable expansion in import demand. In the year
1993, the International Sugar Agreement (ISA) daily price
averaged US cents 10 per lb, 11 percent higher than during 1992.
Production
| 1988-90 Average | 1991 | 1992 | 1993 | ||
| Million tonnes, raw value | |||||
| World total | 106.6 | 113.4 | 115.3 | 111.6 | |
| Developing countries | 62.5 | 68.2 | 74.4 | 69.3 | |
| Latin America | 27.9 | 28.0 | 29.4 | 28.2 | |
| Brazil | 8.4 | 7.8 | 9.2 | 10.0 | |
| Cuba | 7.9 | 7.6 | 7.0 | 4.3 | |
| Africa | 4.2 | 4.3 | 3.8 | 3.9 | |
| Mauritius | 0.7 | 0.7 | 0.6 | 0.7 | |
| Near East | 3.7 | 4.1 | 4.4 | 4.7 | |
| Far East | 26.2 | 31.4 | 36.3 | 32.1 | |
| China | 5.1 | 6.9 | 8.6 | 8.4 | |
| India | 10.4 | 13.1 | 14.3 | 11.5 | |
| Thailand | 3.4 | 4.0 | 5.1 | 3.7 | |
| Oceania | 0.5 | 0.4 | 0.4 | 0.5 | |
| Developed countries | 44.2 | 45.1 | 41.0 | 42.3 | |
| North America | 6.4 | 6.4 | 6.6 | 7.2 | |
| Europe | 21.3 | 22.9 | 21.2 | 21.6 | |
| EC | 15.5 | 16.9 | 15.8 | 17.1 | |
| Eastern Europe | 3.9 | 3.9 | 3.7 | 3.0 | |
| Former USSR | 9.4 | 9.0 | 6.5 | 6.7 | |
| Oceania | 3.7 | 3.6 | 3.2 | 4.3 | |
1 Crop year ending in the year stated.
Utilization
| 1988-90 Average | 1991 | 1992 | 1993 | ||
| Million tonnes. raw value | |||||
| World total | 107.3 | 110.7 | 111.9 | 112.3 | |
| Non-food1 | 0.9 | 1.0 | 1.1 | 1.5 | |
| Net total | 106.3 | 109.7 | 110.8 | 110.8 | |
| Developing countries | 59.2 | 62.7 | 65.2 | 66.2 | |
| Far East | 28.5 | 30.7 | 32.2 | 32.6 | |
| China | 7.3 | 7.5 | 8.0 | 7.6 | |
| India | 10.7 | 11.9 | 12.5 | 12.3 | |
| Developed countries | 47.1 | 47.0 | 45.6 | 44.6 | |
| North America | 8.7 | 9.0 | 9.1 | 9.1 | |
| Europe | 19.3 | 19.6 | 19.4 | 19.2 | |
| EC | 13.0 | 13.2 | 13.2 | 13.4 | |
| Eastern Europe | 4.0 | 4.0 | 3.9 | 3.6 | |
| Former USSR | 13.7 | 13.0 | 11.5 | 10.8 | |
| Japan | 2.8 | 2.8 | 2.9 | 2.9 | |
1 Non-food uses and some sugar in exported products not allocated to individual countries.
Exports1
| 1988-90 Average | 1991 | 1992 | ||
| Million tonnes, raw value | ||||
| World total | 29.7 | 29.6 | 31.5 | |
| Developing countries | 17.4 | 17.8 | 21.0 | |
| Latin America | 11.3 | 11.3 | 11.5 | |
| Cuba | 7.0 | 6.8 | 6.1 | |
| Africa | 1.7 | 1.5 | 1.4 | |
| Mauritius | 0.6 | 0.6 | 0.6 | |
| Near East | 0.1 | 0.2 | 0.8 | |
| Far East | 3.8 | 4.5 | 6.9 | |
| Thailand | 2.4 | 3.0 | 3.9 | |
| Oceania | 0.4 | 0.3 | 0.4 | |
| Developed countries | 12.4 | 11.7 | 10.5 | |
| North America | 0.5 | 0.6 | 0.5 | |
| Europe | 8.0 | 7.5 | 7.4 | |
| EC1 | 7.3 | 6.7 | 6.9 | |
| Eastern Europe | 0.5 | 0.4 | 0.3 | |
| Former USSR | 0.2 | 0.1 | 0.1 | |
| Other developed countries | 3.7 | 3.5 | 2.5 | |
| Australia | 2.8 | 2.6 | 2.3 | |
1 Including trade between members and between metropolitan France and its overseas departments, the latter being included under developing countries,
Imports
| 1988-90 Average | 1991 | 1992 | ||
| Million tonnes, raw value | ||||
| World total | 29.1 | 27.9 | 30.4 | |
| Developing countries | 13.7 | 13.3 | 13.5 | |
| Latin America | 1.5 | 1.8 | 1.2 | |
| Africa | 2.5 | 2.6 | 3.6 | |
| Near East | 3.7 | 3.7 | 3.5 | |
| Far East | 5.9 | 5.2 | 5.1 | |
| China | 2.1 | 1.0 | 1.1 | |
| Developed countries | 15.3 | 14.7 | 16.8 | |
| North America | 2.5 | 2.8 | 2.9 | |
| Europe | 5.9 | 4.5 | 5.0 | |
| EC1 | 4.4 | 3.5 | 3.7 | |
| Eastern Europe | 0-9 | 0.5 | 0.6 | |
| Former USSR | 4.6 | 4.9 | 6.4 | |
| Other developed countries | 2.4 | 2.5 | 2.5 | |
| Japan | 1.8 | 1.8 | 1.8 | |
1 Including trade between members and between metropolitan France and its overseas departments, the latter being included under developing countries.
Value of exports
| 1988-90 Average | 1991 | 1992 | ||
| '000 million | ||||
| World total | 12.0 | 10.5 | 10.6 | |
| Developing countries | 7.6 | 6.2 | 6.6 | |
| Latin America | 5.6 | 4.1 | 3.8 | |
| Cuba | 4.3 | 2.7 | 2.2 | |
| Africa | 0.7 | 0.8 | 0.7 | |
| Mauritius | 0.3 | 0.4 | 0.4 | |
| Near East | 0.1 | 0.1 | 0.2 | |
| Far East | 1.1 | 1.1 | 1.7 | |
| Thailand | 0.6 | 0.6 | 0.7 | |
| Oceania | 0.1 | 0.1 | 0.1 | |
| Developed countries | 4.4 | 4.3 | 4.0 | |
| North America | 0.2 | 0.2 | 0.2 | |
| Europe | 3.3 | 3.1 | 3.2 | |
| EC1 | 3.0 | 2.9 | 3.0 | |
| Eastern Europe | 0.1 | 0.1 | 0.1 | |
| Former USSR | 0.1 | 0.0 | 0.0 | |
| Other developed countries | 0.7 | 0.9 | 0.5 | |
| Australia | 0.7 | 0.7 | 0.5 | |
1 Including trade between members and between metropolitan France and its overseas departments, the latter being included under developing countries.
Closing stocks
| 1988/89 | 1991/ | 1992/ | |
| 1990/91 | 1992 | 1993 | |
| Average | |||
| Million tonnes, raw value | |||
| World | 32.5 | 39.3 | 37.5 |
Export unit value
| 1988-90 Average | 1991 | 1992 | ||
| $/tonne | ||||
| World total | 404 | 355 | 337 | |
| Developing countries | 440 | 346 | 317 | |
| Latin America | 494 | 365 | 330 | |
| Cuba | 608 | 394 | 369 | |
| Africa | 457 | 505 | 537 | |
| Mauritius | 538 | 625 | 610 | |
| Near East | 358 | 396 | 249 | |
| Far East | 280 | 237 | 254 | |
| Thailand | 246 | 194 | 193 | |
| Oceania | 362 | 423 | 403 | |
| Developed countries | 355 | 369 | 376 | |
| North America | 362 | 348 | 304 | |
| Europe | 405 | 417 | 429 | |
| EC 1 | 412 | 430 | 437 | |
| Eastern Europe | 322 | 268 | 319 | |
| Former USSR | 346 | 385 | 322 | |
| Other developed countries | 271 | 290 | 306 | |
| Australia | 238 | 265 | 230 | |
1 Including trade between members and between metropolitan France and its overseas departments, the latter being included under developing countries.
Prices
| 1988-90 Average | 1991 | 1992 | 1993 | |
| US cents/lb (450 g) | ||||
| ISA daily prices | 11.9 | 8.96 | 9.05 | 10.03 |