Exports maintained at over 10 million tonnes in 1992
World banana exports remained above 10 million tonnes in 1992 but were 2 percent below the record trade of 1991. Shipments from Ecuador, the world's largest banana exporting country, decreased 5 percent to 2.15 million tonnes. Nevertheless, this outcome was still 41 percent greater than the average of 1988-90 and represented over 25 percent of world banana trade in 192. The Union of Banana Exporting Countries (UPEB) increased exports by one percent and increased its market share to almost 50 percent. Expansion of planting provided Colombia, the Dominican Republic and Guatemala with considerably increased supplies for export, more than offsetting reduced crops in Honduras and Nicaragua. These latter countries suffered from adverse weather conditions, when cyclones reduced crops in a number of plantations. Increases were also recorded in several African and Caribbean (ACP) countries. In the Caribbean, exports rose 17 percent in 1992 with larger shipments from Jamaica, Dominica, Saint Lucia, and Saint Vincent and Grenadines more than offsetting the slight drop in volume from Grenada. The increase in exports from Africa, 11 percent, was mainly from Côte d'Ivoire and Cameroon. This more than offset the virtual collapse of exports from Somalia due to civil war. In the Far East, exports decreased by 15 percent mainly reflecting a decline in the Philippines, following an exceptional performance in 1991.
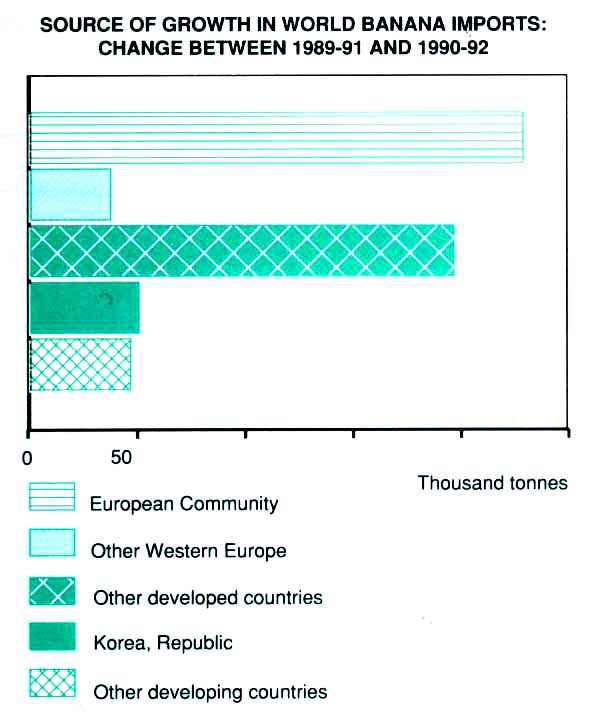
Source of growth in world banana imports: change between 1989-91 and 1990-92
Imports continued to grow In 1992
Much of the increase in imports was due to a 10 percent increase in consumption in the United States stimulated by a decline in average import prices of 15 percent and in retail prices of 5 percent. In the United Kingdom, average retail prices fell by 11 percent and imports rose by 11 percent through import prices remained virtually unchanged.
The 55 000 tonnes increase accounted for over 40 percent of the additional imports made by the EC. Consumers in France and Germany also benefited from lower prices but although imports increased the response was less pronounced than in the United Kingdom.
Consumption in France was static and previous growth in Germany, bolstered by re-unification and product promotion, was not sustained. In Eastern Europe, the available data for Bulgaria and Hungary showed a considerable increase in imports. In contrast, imports by the developing countries fell by 9 percent, mainly reflecting a large reduction in imports by the Republic of Korea, following the surge after the lifting of quotas in 1991.
Divergent trends in trade during 1993
Preliminary indications are that exports in 1993 might have declined relative to 1992. However, export availabilities could be one million tonnes in excess ion import requirements, and the outcome would be considerably influenced by the EC banana import regime applied from July 1993 (see Box). Import prices, before payment of duty, for a number of EC countries appear to have declined since July 1993 but it is too soon to analyze the effects of the new regime.
World banana imports in 1993 were expected to be about 19 million tonnes, reflecting a small growth in purchases due to decreased retail prices that have spurred consumption in the developed countries, which account for about 90 percent of imports. Bananas have also benefited from the shift to more healthy diets. However, due to an expansion of the area planted in anticipation of new market opportunities, exportable supplies are expected to exceed forecast imports considerably. Greater consumption stimulated by reduced market prices particularly in import markets with relatively low per caput consumption, may help towards reducing the global surplus. By contrast, there appears to be little scope in the EC for a sizeable increase in consumption. The main constraints were price rises to consumers in some countries following the imposition of additional duties and the reduction of the import quantities from Latin America. From I July 1993 wholesale prices in Germany were more than 70 percent higher than in July 1992. The Netherlands had a similar price increase. However, the effects of price increases in these two countries might be partly offset by reductions elsewhere in the EC. In France, for example, wholesale prices were slightly lower in 1993 than in 1992. Reduced EC imports might be partly offset by growth in the United States and Japan, where wholesale prices declined considerably in 1993.
Uncertain outlook for 1994
Hurricane damage during 1993 resulted in some losses in banana
production in Colombia and Honduras, which, however, is unlikely
to reduce markedly the excess of export supply capacity over
imports. Some further eradication of plantations in Ecuador was
likely to remove areas of marginal production amounting to 20
percent of the total but with a lesser impact on output, A
continuation of excess supply and depressed prices outside the EC
was thus likely.
| Bananas and the
European Community New EC regulations, in force from 1 July 1993 provide for: • No limit to imports of bananas produced within the EC but compensation payments limited to a maximum of 854 000 tonnes. • Duty free imports from ACP members up to their highest historical trade level but amended in the light of feasible trade. The EC proposal for traditional supplies was 852 700 tonnes. • A tariff quota of 2 million tonnes (net weight)
shall be opened each year for imports of third country
bananas and non-traditional ACP banana supplies. • Apart from the quota referred to above, imports of nontraditional ACP supplies shall be subject to a levy of ECU 750 per tonne; imports of third-country bananas shall be subject to a levy of ECU 850 per tonne. • The quantities of third-country bananas and non-traditional ACP supplies re-exported out of the EC shall not be charged to the quota referred to above. • The tariff quota shall be opened from 1 July 1993 with: 66.5 percent to the category of operators who marketed
third-country and/or non-traditional ACP supplies; • The import opportunities pursuant to (a) and
(b) shall be available only to operators established in
the EC who marketed on their own account a minimum
quantity, to be determined, of bananas from the above
origins. |
Exports
| 1988-90 Average | 1991 | 1992 | ||
| '000 tonnes | ||||
| World total | 8589 | 10450 | 10283 | |
| Developing countries | 7 840 | 9700 | 9547 | |
| Latin America | 6 637 | 8 389 | 8 365 | |
| Caribbean | 310 | 300 | 351 | |
| UPEB Countries1 | 4302 | 5048 | 5 103 | |
| Ecuador | 1 781 | 2 654 | 2 511 | |
| Other Latin America | 244 | 387 | 400 | |
| Africa | 223 | 246 | 273 | |
| Far East | 979 | 1 063 | 908 | |
| Philippines | 853 | 955 | 821 | |
| Developed countries | 749 | 750 | 736 | |
| Spain (Canary Is.)2 | 400 | 400 | 400 | |
| France (Guadeloupe, Martinique) | 309 | 309 | 295 | |
1 Colombia, Costa Rica, Dominican Republic,
Guatemala, Honduras, Nicaragua, Panama and Venezuela.
2 Including shipments to metropolitan area.
Imports per caput
| 1988-90 Average | 1991 | 1992 | ||
| kg per head | ||||
| World total | 3.1 | 3.3 | 3.6 | |
| Developing countries | 0.4 | 0.6 | 0.6 | |
| Near East | 1.6 | 1.7 | 1.7 | |
| Far East | 0.1 | 0.4 | 0.4 | |
| Developed countries | 6.4 | 7.1 | 7.5 | |
| Canada | 11.3 | 12.8 | 14.1 | |
| United States | 11.2 | 11.5 | 12.6 | |
| EC | 8.9 | 10.3 | 10.7 | |
| Eastern Europe | 1.1 | 1.2 | 1.6 | |
| Other, Europe | 9.4 | 11.3 | 11.0 | |
| Former USSR | 0.2 | 0.2 | 0.2 | |
| Japan | 6.2 | 6.5 | 6.3 | |
Imports
| 1988-90 Average | 1991 | 1992 | ||
| '000 tonnes | ||||
| World total | 8 251 | 9477 | 9 890 | |
| Developing countries | 603 | 984 | 893 | |
| Near East | 261 | 299 | 312 | |
| Developed countries | 7648 | 8493 | 8998 | |
| North America | 3084 | 3 245 | 3 626 | |
| Canada | 298 | 345 | 380 | |
| United States | 2787 | 2900 | 3 246 | |
| Europe | 3 588 | 4 214 | 4324 | |
| EC | 3 058 | 3 570 | 3696 | |
| Eastern Europe | 101 | 118 | 159 | |
| Former USSR | 62 | 60 | 50 | |
| Other developed countries | 813 | 856 | 838 | |
| Japan | 764 | 803 | 777 | |
1 Net imports.
Value of exports1
| 1988-90 Average | 1991 | 1992 | ||
| Million $ | ||||
| World total | 2 509 | 2 926 | 2934 | |
| Latin America | 1 773 | 2 258 | 2 276 | |
| Caribbean | 120 | 116 | 133 | |
| Central America | 968 | 1 122 | 1 157 | |
| South America | 685 | 1 020 | 986 | |
| Africa | 71 | 79 | 87 | |
| Far East | 299 | 319 | 272 | |
1 Estimates based on questionnaires returned by Member Countries.
Prices
| 1988-90 Average | 1991 | 1992 | 1993 | ||
| National currency/kg | |||||
| Import prices1 | |||||
| France (francs) | 5.22 | 5.60 | 5.02 | 4.26 | |
| Germany (DM) | 1.09 | 1.11 | 0.88 | 126 | |
| United States (US cents) | 52.07 | 57.67 | 49.28 | 46.29 | |
| Japan (yen) | 74.07 | 73.50 | 85.40 | 60.22 | |
1 F.o.r. (Free-on-Rail) France, from Martinique: f.o.r. Germany, from Central America; f.o.r. United States, from Central and S. America; c.i.f. Japan, excluding cost of cartons, from the Philippines.
Output decline continued in 1993
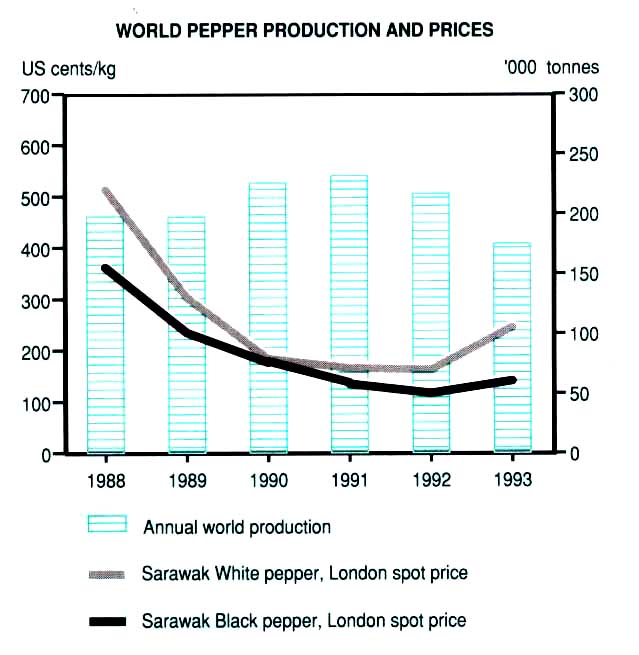
World pepper output fell 19 percent to about 173 000 tonnes in 1993. Yields were down in most major producing countries as continuing low returns had caused producers to reduce applications of fertilizer and other agricultural inputs. The largest decrease in output was expected in the Far East, particularly in Indonesia, where excessive rains in the producing regions of Lampung and southern Sumatra during most of 1992 and early 1993 were the determining factor for the estimated decline of 40 percent,
Crop decreased in 1992
World pepper production had decreased by 7 percent in 1992 from the record harvest of the previous two years. The decline in prices that followed the record harvests had already led to neglect of vine husbandry and reduction in yields. In addition, marginal production areas were abandoned or uprooted. Pepper output in Latin America dropped by 39 percent, mainly as a result of a 42 percent fall in Brazil where approximately 15 000 ha were taken out of production. In the Far East the full impact of low prices was not discernable until late in the year and the 1992 pepper harvest was slightly larger than that of the previous year. Almost all pepper producing countries in the region harvested slightly larger crops except Malaysia, where output declined by 10 percent. In Africa, production was close to the 1991 level.
Lower imports, but higher re-exports in 1992
Global pepper imports, originating from producing and re-exporting countries, during 1992 decreased slightly, to around 210 000 tonnes. Lower imports from producers were largely offset by higher re-exports, mainly from Singapore and the Netherlands. Imports by Africa declined by 40 percent, mainly as a result of smaller purchases by Algeria and Tunisia, those of countries of the former USSR fell by 29 percent, and of Latin America and the Caribbean by 13 percent. The decline in Latin America and the Caribbean was largely the result of reduced purchases by Mexico and Argentina. In contrast, North America increased imports by 6 percent, and other increases were in the Near East and eastern Europe, mainly Poland and the former Czechoslovakia.
Smaller exports in 1992
Exports from producing countries declined 11 percent to around 150 000 tonnes in 1992. The drop in shipments was largely the consequence of lower availabilities, and of stock-building in producing countries in expectation of smaller harvests by major producers, and of a price rise in 1993. Pepper exports from Latin America dropped 40 percent reflecting reduced shipments from Brazil, the region's main producer. In the Far East, exports were maintained at 118 000 tonnes, as higher exports from Indonesia and Thailand offset lower shipments from Malaysia and Viet Nam. Exports from India remained virtually unchanged at around 19 000 tonnes. Africa's relatively small exports increased by close to 50 percent.
Export earnings from pepper in 1992 decreased for the fifth consecutive season to $156 million. The 29 percent decrease in global export earnings was the result of both reduced export volumes and prices. Pepper export earnings in Brazil, the most affected country, were more than halved from $49 million in 1991 to $22 million in 1992. In the Far East, where export revenues dropped by nearly $40 million, Viet Nam, Malaysia and India were most affected. In Africa there was a slight increase in earnings from pepper.
Market recovered in 1993
The falling trend of prices was reversed during 1993 with reduced harvests and speculative withholding of large stocks, mainly of white pepper. The annual average spot price for Sarawak white pepper in London rose to 245 US cents/kg from 162 US cents/kg in 1992. However, this price was still well below the levels of the late eighties especially 1987 when it was 613 US cents/kg. The London spot price for Sarawak black pepper also rose but less sharply. This price returned to the 1991 level but was still less than one third of the level obtained in 1987. There was a similar response by the New York and Singapore markets in both black and white pepper.
Outlook for relatively stable supplies and prices
Early forecasts for the 1994 season suggested a further fall in output in most major producing countries as yields were likely to continue to decline. However, production in Indonesia should recover somewhat, to about 55 000 tonnes, a factor which might, at least in the short-term, prevent further sizable increases in prices. However, Black Malabar was expected to continue to command a premium, as the demand for this high quality pepper was likely to be maintained.
World pepper production and prices
Production1
| 1988-90 Average | 1991 | 1992 | 1993 | ||
| '000 tonnes | |||||
| World total | 205.0 | 229.6 | 214.4 | 172.8 | |
| Latin America | 34.7 | 50.9 | 30.9 | 26.1 | |
| Brazil | 31.5 | 47.5 | 27.5 | 23.0 | |
| Africa | 3.8 | 3.7 | 3.8 | 3.8 | |
| Far East | 166.5 | 175.0 | 179.7 | 142.9 | |
| India | 56.7 | 55.0 | 60.0 | 55.0 | |
| Indonesia | 50.0 | 61.0 | 62.0 | 37.5 | |
| Malaysia | 26.2 | 29.0 | 26.0 | 20.0 | |
| Other Far East | 33.7 | 30.0 | 31.7 | 30.4 | |
1 Crop year beginning in the year shown.
Source: International Pepper Community.
Value of exports1
| 1988-90 Average | 1991 | 1992 | ||
| Million $ | ||||
| World total | 363.9 | 218.8 | 155.7 | |
| Latin America | 60.5 | 52.3 | 27.9 | |
| Africa | 4.7 | 2.5 | 3.6 | |
| Far East | 298.7 | 164.0 | 124.2 | |
| India | 104.9 | 32.5 | 22.4 | |
| Indonesia | 110.9 | 65.8 | 61.4 | |
| Malaysia | 55.1 | 32.4 | 22.3 | |
1 Excluding the value of re-exports,
Export unit value
| 1988-90 Average | 1991 | 1992 | ||
| US cents/kg | ||||
| World1 | 251 | 130 | 104 | |
| Brazil | 219 | 105 | 87 | |
| India | 288 | 165 | 115 | |
| Indonesia | 257 | 132 | 100 | |
| Malaysia | 235 | 120 | 97 | |
1 Excluding re-exports
Exports
| 1988-90 Average | 1991 | 1992 | ||
| '000 tonnes | ||||
| World total | 146.5 | 169.0 | 150.1 | |
| Latin America | 29.0 | 48.8 | 29.5 | |
| Brazil | 26.2 | 46.8 | 25.7 | |
| Africa | 1.9 | 1.3 | 1.9 | |
| Far East | 115.7 | 118.9 | 118.7 | |
| India | 35.6 | 19.7 | 19.4 | |
| Indonesia | 43.8 | 49.7 | 61.4 | |
| Malaysia | 24.8 | 27.1 | 22.9 | |
| Other Far East | 11.5 | 22.4 | 15.0 | |
Imports
| 1988-90 Average | 1991 | 1992 | ||
| '000 tonnes | ||||
| World total | 190.8 | 213.9 | 210.1 | |
| Re-exports | 50.4 | 57.0 | 68.8 | |
| Developing countries | 58.1 | 83.0 | 77.9 | |
| Latin America | 5.5 | 8.6 | 7.5 | |
| Africa | 6.4 | 12.5 | 7.5 | |
| Near East | 17.0 | 18.5 | 19.6 | |
| Far East | 29.1 | 43.4 | 43.3 | |
| Developed countries | 132.7 | 130.9 | 132.2 | |
| North America | 40.1 | 47.8 | 50.6 | |
| Europe | 66.5 | 58.9 | 59.5 | |
| EC | 50.5 | 51.0 | 50.4 | |
| Eastern Europe | 10.3 | 3.3 | 4.4 | |
| Former USSR | 16.0 | 14.0 | 10.0 | |
Prices
| 1988-90 Average | 1991 | 1992 | 1993 | |
| US cents/kg | ||||
| New York: black1 | 299 | 156 | 124 | 138 |
| New York: white2 | 353 | 154 | 155 | 250 |
| Singapore: black 3 | 223 | 111 | 90 | 111 |
| Singapore: white4 | 315 | 141 | 134 | 217 |
| London: black5 | 257 | 135 | 117 | 141 |
| London: white6 | 333 | 165 | 162 | 245 |
1 Spot black Lampong.
2 Spot white Muntok.
3 Sarawak black, special 100 percent.
4 Muntok white, Asta 100 percent.
5 Sarawak black, special.
6 Spot Sarawak white.