Rice
Wheat
Coarse
grains
Cassava
Pulses
Trade rose but prices averaged lower in 1993
Global rice trade rose by 4 percent to 14.5 million tonnes in 1993. The increase reflected the exceptionally large volume of trade in the final quarter of the year following Japan's purchases to meet domestic shortages caused by an exceptionally poor crop. This would be its first major rice import since 1984. The Philippines also bought to replenish stock after an absence of two years. In the Near East, rice imports reached a new peak following increased demand in the Islamic Republic of Iran, Iraq and Saudi Arabia and the removal of restrictions on private imports. Imports of Africa and Europe were also slightly higher. By contrast, imports by other countries in the Far East, Latin America and the countries of the former USSR declined. Indonesia, which purchased 0.6 million tonnes in 1992, bought no rice in 1993 but exported substantial quantities instead. This change in Indonesia's position exerted considerable downward pressure on prices, especially in early 1993. Moreover, imports into the countries of the former USSR, which rose in 1992 to one of their highest levels in recent years, declined sharply due to a shortage of foreign exchange. Imports of Mexico and Peru in 1993 were also considerably smaller than the record quantities purchased in the previous year.
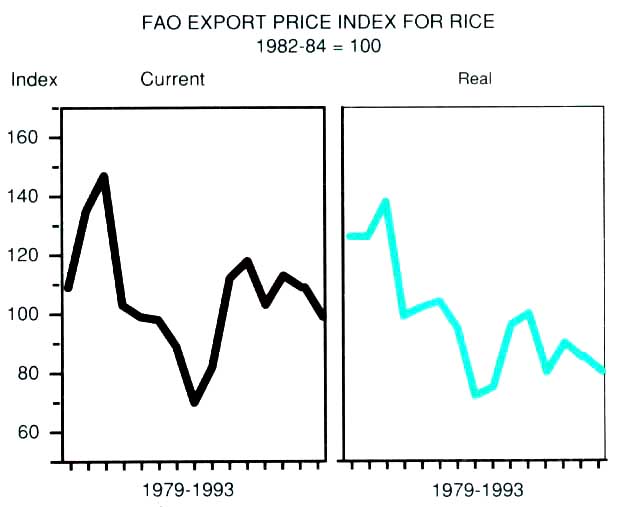
FAO export price index for rice
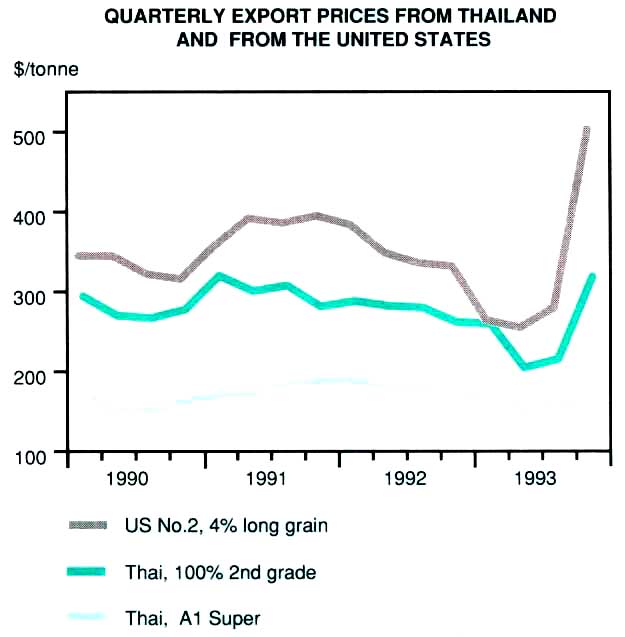
Quarterly export prices from Thailand and from the United States
The United States was the main traditional exporting country to expand exports and increase its market share in 1993. From late 1992 it enlarged its Export Enhancement Programme for rice. The export prices of the United States were also lowered, triggering a sharp recovery of shipments, especially to the Near East and the EC. In particular, large sales were concluded with the Islamic Republic of Iran, which had not bought from the United States for some time. By contrast, exports out of Thailand in early 1993 declined because of strong competition from other countries, but recovered later in the year to total 4.8 million tonnes, virtually the same quantity exported in the previous year. Pakistan's exports fell heavily, disrupted by the internal re-structuring of its rice export industry. Exports from Viet Nam declined slightly as did exports from India, the EC and Australia.
International rice prices were lower on average, with the FAO Export Price Index for Rice falling from 109 to 99. The decline was mainly in the first half of the year. The United States' export prices fell in the first quarter to the levels of competing grades from Thailand. However, starting in the second quarter, the price differential between Thai and United States' rice diverged once again, as Thailand responded by reducing prices further. In the last quarter of 1993, however, international rice prices recovered sharply as a result of Japan's imports and a marked deterioration of the outlook for the 1993 world paddy crop. Prices for United States' medium grain rice gained most with an increase of over $100 per ton in October, and continued to climb in that last quarter. By contrast, China was the most competitive seller of lower quality rice throughout the year, because of large supplies left with the State Grain Bureaux following the abolition of its ration scheme and a fall in the dollar value of its currency.
The value of rice exported from developing countries declined 10 percent to $2.7 million. Thailand suffered a 10 percent decline in export earnings. China, Pakistan and Viet Nam were also affected by reduced rice earnings.
Outlook for record trade and higher prices in 1994
The boost to world trade and prices in 1994 was likely to come from increased import demand following a crop that was smaller than the 1992 record and reduced opening stocks. In particular, the international market for medium grain rice, which had contracted substantially in recent years, was expected to recover strongly as the output of countries consuming this type of rice was cut back by unseasonably cold weather and pest infestation. The drastic fall in Japan's output of paddy in 1993, for example, was expected to result in a substantial shortage that would need to be compensated by imports. Reduced production could bring the Democratic Republic of Korea into the world market as a substantial rice importer in 1994. In China, a reduced crop coupled with strong economic growth was expected to lead to increased purchases from the international market especially to meet the growing domestic demand for higher quality rice, despite the shift to increased cultivation of higher quality varieties. The Philippines was also likely to import as production and stocks had fallen. Import demand by these countries, together with the continued substantial purchases of traditional large importers such as Malaysia, Hong Kong and Singapore was expected to result in a recovery of Far East imports.
Global trade in 1994 was also expected to be strengthened by the larger import demand of North America, Latin America and Europe, especially the EC. The consumption of rice in Canada and the United States has risen considerably in the past decade as changes in dietary patterns have favoured rice. In addition, growth in the Asian community has increased demand for varieties grown in Asia. These trends were expected to boost imports in 1994. Mexico and Peru were also expected to expand imports following reduced output in 1993. In the EC, imports from third countries were likely to increase because of a fall in output within the Community. By contrast, Africa's import requirements were likely to decline from the 1993 level. However, the final outcome would depend upon the availability of food aid in rice, as rising international rice prices in 1994 were likely to hold down commercial purchases. Similarly, the countries of the former USSR were expected to import less in 1994, reflecting continued scarcity of foreign exchange.
The projected increase in world import demand was anticipated to be met by larger export availabilities from the United States and Viet Nam. Exports by the United States were forecast to reach their highest level since the late 1970s. As one of the few major exporters of medium grain rice, the United States was expected to benefit substantially from stronger demand for this type in 1994. In Viet Nam, substantial carry-over stocks and ample crops were also expected to result in larger exports. Increased world demand could also be expected to boost the exports of several less prominent and newer exporting countries. Australia, primarily an exporter of medium grain rice, was expected to have record exports. Bangladesh and Indonesia, both relatively new exporting countries, were also likely to benefit from the recovery in world trade as importers sought alternative sources and buying arrangements. By contrast, exports out of China and the EC were expected to fall because of reduced availabilities, while Thailand's exports could be constrained by a reduced 1993 output.
A third successive year of stock decline
Aggregate stocks at the end of the 1994 marketing season were forecast to be further reduced both in the developing and developed countries. The largest decline would be in China as a result of diminished production in 1993. Stocks in India and Indonesia were also expected to contract. In Japan, stocks would shrink to a record low following a drastic reduction in output. In the United States, stocks would have to be drawn down to maintain exports as production had fallen.
Production (paddy)1
| 1988-90 Average | 1991 | 1992 | 1993 | ||
| Million tonnes | |||||
| World total | 509.8 | 519.7 | 527.2 | 520.1 | |
| Developing countries | 484.5 | 495.3 | 500.6 | 497.0 | |
| Latin America | 18.5 | 17.6 | 18.0 | 17.8 | |
| Africa | 8.8 | 10.0 | 10.2 | 10.1 | |
| Near East | 5.2 | 6.6 | 7.1 | 7.2 | |
| Far East | 452.0 | 461.1 | 465.3 | 461.9 | |
| Bangladesh | 25.7 | 27.4 | 26.8 | 27.3 | |
| China | 182.2 | 186.5 | 188.3 | 182.2 | |
| India | 109.4 | 110.6 | 109.0 | 110.4 | |
| Indonesia | 43.9 | 44.7 | 48.2 | 47.9 | |
| Pakistan | 4.8 | 4.9 | 4.8 | 5.1 | |
| Thailand | 19.7 | 20.4 | 19.9 | 20.0 | |
| Viet Nam | 18.8 | 21.5 | 22.0 | 22.0 | |
| Developed countries | 25.4 | 24.4 | 26.6 | 23.1 | |
| United States | 7.1 | 7.1 | 8.1 | 7.5 | |
| Europe | 2.3 | 2.4 | 2.3 | 2.1 | |
| EC | 2.1 | 2.3 | 2.2 | 2.0 | |
| Other developed countries | 15.9 | 14.9 | 16.2 | 13.5 | |
| Australia | 0.8 | 0.8 | 1.1 | 1.0 | |
| Japan | 12.8 | 12.0 | 13.1 | 10.5 | |
1 Production data refer to the calendar year in which the harvest or bulk of the harvest took place.
Utilization
| 1988-90 Average | 1991 | 1992 | 1993 | ||
| Million tonnes | |||||
| World total | 327.5 | 340.8 | 349.1 | 353.6 | |
| Developing countries | 310.5 | 323.7 | 331.7 | 336.2 | |
| Latin America | 12.8 | 13.5 | 13.5 | 13.3 | |
| Africa | 7.8 | 8.6 | 9.3 | 9.6 | |
| Near East | 6.3 | 6.8 | 7.5 | 8.1 | |
| Far East | 283.3 | 294.5 | 301.2 | 305.0 | |
| China | 120.3 | 123.1 | 125.2 | 125.7 | |
| India | 64.8 | 70.2 | 72.6 | 73.9 | |
| Developed countries | 17.1 | 17.1 | 17.4 | 17.4 | |
| North America | 2.8 | 3.3 | 3.1 | 3.1 | |
| Europe | 2.2 | 2.0 | 2.2 | 2.2 | |
| EC | 1.6 | 1.4 | 1.7 | 1.7 | |
| Eastern Europe | 0.4 | 0.3 | 0.3 | 0.3 | |
| Former USSR | 2.1 | 1.9 | 2.0 | 1.8 | |
| Other developed countries | 10.0 | 9.9 | 10.1 | 10.3 | |
| Japan | 9.6 | 9.3 | 9.5 | 9.5 | |
Exports (milled) 1,2
| 1988-90 Average | 1991 | 1992 | 1993 | ||
| Million tonnes | |||||
| World total | 12.0 | 12.0 | 14.1 | 14.5 | |
| Developing countries | 8.7 | 8.9 | 11.0 | 11.0 | |
| Latin America | 0.6 | 0.6 | 0.7 | 0.8 | |
| Near East | 0.1 | 0.2 | 0.2 | 0.1 | |
| Far East | 8.0 | 8.1 | 10.1 | 10.1 | |
| China | 0.5 | 0.8 | 1.1 | 1.3 | |
| India | 0.5 | 0.6 | 0.6 | 0.7 | |
| Pakistan | 0.9 | 1.3 | 1.4 | 0.9 | |
| Thailand | 4.9 | 4.0 | 4.8 | 4.8 | |
| Viet Nam | 1.1 | 1.0 | 2.0 | 1.8 | |
| Developed countries | 3.3 | 3.1 | 3.1 | 3.5 | |
| United States | 2.5 | 2.2 | 2.1 | 2.6 | |
1 Excluding trade between EC member countries.
2 Excluding re-exports.
Imports (milled)1,2
| 1988-90 Average | 1991 | 1992 | 1993 | ||
| Million tonnes | |||||
| World total | 11.8 | 11.9 | 13.9 | 14.5 | |
| Developing countries | 9.7 | 9.7 | 11.2 | 11.4 | |
| Latin America | 1.1 | 2.2 | 2.0 | 1.9 | |
| Africa | 2.5 | 3.0 | 3.0 | 3.2 | |
| Côte d'Ivoire | 0.3 | 0.3 | 0.4 | 0.4 | |
| Senegal | 0.4 | 0.4 | 0.3 | 0.4 | |
| Near East | 2.9 | 2.6 | 3.6 | 4.0 | |
| Iran | 0.8 | 0.6 | 1.0 | 1.0 | |
| Iraq | 0.6 | 0.3 | 0.5 | 0.6 | |
| Far East | 2.9 | 1.8 | 2.3 | 2.1 | |
| Hong Kong | 0.3 | 0.3 | 0.3 | 0.3 | |
| India | 0.4 | 0.1 | 0.0 | 0.2 | |
| Malaysia | 0.3 | 0.4 | 0.5 | 0.4 | |
| Singapore | 0.2 | 0.2 | 0.2 | 0.2 | |
| Developed countries | 2.1 | 2.2 | 2.7 | 3.1 | |
| North America | 0.3 | 0.3 | 0.4 | 0.4 | |
| Europe | 1.0 | 1.0 | 1.0 | 1.1 | |
| Other developed countries | 0.8 | 0.9 | 1.3 | 1.6 | |
| Japan | - | - | - | 0.4 | |
1 Excluding trade between EC member countries.
2 Excluding re-exports.
Value of exports
| 1988-90 Average | 1991 | 1992 | 1993 | ||
| Million $ | |||||
| World total | 3953 | 4088 | 4591 | 4273 | |
| Developing countries | 2490 | 2564 | 3005 | 2725 | |
| China | 138 | 182 | 237 | ... | |
| India | 262 | 309 | 420 | ... | |
| Pakistan | 280 | 372 | 337 | 203 | |
| Thailand | 1 331 | 1 103 | 1 324 | 1 194 | |
| Viet Nam | 207 | 197 | 285 | 243 | |
| Developed countries | 1 463 | 1 524 | 1 586 | 1 549 | |
| United States | 847 | 740 | 716 | 852 | |
Closing stocks (milled)1
| 1988-90 Average | 1991 | 1992 | 1993 | ||
| Million tonnes | |||||
| World total | 49.9 | 64.1 | 61.9 | 60.9 | |
| Developing countries | 46.8 | 61.3 | 59.6 | 58.0 | |
| China | 11.8 | 14.7 | 13.0 | 12.1 | |
| Thailand | 1.0 | 1.4 | 1.8 | 1.6 | |
| Viet Nam | 1.4 | 1.1 | 1.4 | 1.6 | |
| Developed countries | 3.1 | 2.8 | 2.3 | 2.9 | |
| United States | 0.9 | 0.8 | 0.9 | 1.2 | |
1 Individual country stocks, aggregated for the world total, relate to each country's crop year.
Export unit value
| 1988-90 Average | 1991 | 1992 | 1993 | ||
| $/tonne | |||||
| World total | 330 | 342 | 325 | 295 | |
| Developing countries | 286 | 290 | 273 | 248 | |
| China | 263 | 222 | 225 | ... | |
| India | 591 | 500 | 661 | ... | |
| Pakistan | 330 | 287 | 248 | 220 | |
| Thailand | 270 | 276 | 277 | 249 | |
| Viet Nam | 213 | 188 | 146 | 135 | |
| Developed countries | 443 | 490 | 508 | 444 | |
| United States | 334 | 337 | 340 | 325 | |
Prices
| 1988-90 Average | 1991 | 1992 | 1993 | ||
| Export price indices 1982-84=100 | |||||
| FAO Export Price Index | 111 | 113 | 109 | 99 | |
| High quality | 111 | 115 | 111 | 101 | |
| Low quality | 111 | 109 | 103 | 92 | |
| Long grain | 105 | 108 | 101 | 91 | |
| Medium/round | 142 | 138 | 150 | 137 | |
| $/tonne | |||||
| Thai 100 percent 2nd grade | 289 | 302 | 278 | 250 | |
| U.S. No.2 4 percent2 | 339 | 373 | 340 | 326 | |
1 White rice, 100 percent second grade, f.o.b.
Bangkok, indicative traded prices.
2 U.S. No.2, 4 percent brokens f.a.s.