Part II: Review and outlook by commodity
Beverages, sugar and tropical crops
Cereals, cassava and pulses
Oilseeds, oils and oilmeals
Livestock products
Agricultural raw materials
Other agricultural commodities
Fishery products
Forest
products
Beverages, sugar and tropical crops
Coffee
Cocoa
Tea
Sugar
Bananas
Pepper
Output sharply down in 1992/93
Production in 1992/93 was 5.51 million tonnes, the lowest since 1988/89. A sharp reduction in the Brazilian crop, to 1.44 million tonnes, was the principal reason for the drop. The crop suffered from the eradication of 800 million trees, some 23 percent of the previous total, and from unfavourable weather. Production also fell in the remainder of Latin America, especially in Colombia following the record crop of the previous year, and in Africa. Though cyclic and weather phenomena played their part, the major reason for the decline was that prices remained insufficient to cover the full cost of production thus reducing the scope for tree replacement and renovation. Of late, prices were also below the variable cost of production and undermined the level of husbandry. Only for the low cost producers of Asia did prices remain sufficient to support adequate husbandry. There, robusta production approached the feasible maximum reflecting the lower costs and young trees in these countries.
Exports moderately lower in 1993
Preliminary indications suggest a reduction of between 3 and 4 percent in 1993 export volumes. Exports during the first nine months of 1993 were 3.4 million tonnes, compared to 3.5 million tonnes in the same period of the previous year. Brazilian shipments continued to decline and Colombian shipments were 6 percent less than the record of the previous year. Contraction in exports from these countries, being mainly in arabica coffee, reduced global shipments of this type. By contrast, shipments of robusta increased during the first part of 1993.
Slight recovery in exports in 1992
Data for 1992 show exports (including re-exports) of coffee beans to have increased by 2 percent to 4.69 million tonnes. Shipments from Latin America and the Caribbean increased by 4 percent and those from Africa slightly. Shipments from Asia and Oceania, however, declined by 5 percent. Colombia was a major contributor with the exports up by 26 percent, a rise of 190 000 tonnes. By contrast, Brazil's shipments fell by 7 percent from the previous year with the short crop in 1992/93 and the low level of privately owned stocks contributing to the decline. Aggregate exports by the rest of Latin America fell slightly though Guatemala regained the levels of 1989 and 1990.
Trade from Africa and Asia remained sluggish. A 29 percent reduction in exports from Indonesia outweighed the 60 percent increase in exports by Viet Nam and the doubling of those from Thailand. Shipments by India and Papua New Guinea, were only slightly greater than in 1991.
Consumption stagnant in 1992
Consumption in recent years has been bolstered by reduced retail prices in real terms, that is allowing for inflation. The decline in real prices has favoured increased consumption despite sluggish income growth, especially among those sections of the population whose consumption was far below saturation. On average, the effect of a decrease of 10 percent in retail prices would be a 3 percent expansion in consumption. These considerations largely account for the 4 percent increase in the European Community's consumption in. 1992 and a somewhat lesser increase elsewhere in western Europe. Similar increases had already occurred in the United States between 1989 and 1991. However, the longer-term downward trend in coffee consumption there was evident in the 5 percent contraction in 1992, shown in the latest available data. This, and the 11 percent decline in Japan, outweighed increases elsewhere so global consumption contracted slightly. However, production fell to its lowest level since 1988/89 and global stocks decreased slightly.
Moderate recovery in output forecast for 1993/94
World coffee output was expected to rise by 6 percent to 5.83 million tonnes in 1993/94. The major contributor to increased production was Brazil following more favourable weather and the greater maturity and crop potential of some high-yielding trees. However, these positive factors were partly counteracted by a lack of fertiliser application resulting in smaller cherries and lower net yields.
Output in Colombia continued to decline following the record year of 1991/92. Though 1993/94 is the positive year of the biennial cycle, production was expected to be curtailed following the spread of broca, a pest that damages coffee cherries. In addition, the use of fertilisers in 1992/93 was only about half the 1990/91 level. Other losses stemmed from the eradication of trees on about 30 000 hectares of marginal land in addition to the eradication of the previous year. Output in the remainder of Latin America and the Caribbean was expected to be similar to 1992/93, at 1.27 million tonnes. The benefit of the positive year of the biennial cycle in many countries was moderated by severe cuts in the application of fertilisers and control chemicals. As a result, output from high-yielding varieties, which is strongly geared to fertiliser application and has formed an increasing proportion of regional output, has been reduced substantially.
Output in Africa was expected to recover slightly to reach 1.05 million tonnes, still some 13 percent below the average for 1988-90. Production in Côte d'Ivoire, the largest producer in Africa, should recover from the disappointing 1992/93 crop following adequate rainfall and with additional production from trees that have been severely pruned. However, the recovery could be moderated by the effect of the depressed price of robusta coffee, which has led to a decrease in the standard of husbandry in Côte d'Ivoire and other robusta producing countries. In addition, the cultivation of coffee is increasingly being replaced by the production of food crops for local sale in areas adjacent to urban centres. Arabica crops in Africa have also been affected by the decline in prices. These have also suffered from the ageing of trees and, sometimes, the deterioration of the processing and marketing infrastructure. Production in both Ethiopia and Kenya, the largest producers of arabica in the region, was expected to be essentially the same in 1993/94 as in 1992/93.
Though producers in Asia and Oceania have not been immune to the decline in prices, their comparatively low cost of production, and the larger proportion of younger, more vigorous, trees have underpinned production levels. Output in Indonesia, the region's largest producer, is expected to be maintained in 1993/94. However, there has been some change to the composition of output following the replacement of robusta by arabica in suitable areas. Production in Vietnam, a relatively new major producer, continues to increase, and in India the biennial cycle is expected to lead to a substantially higher crop.
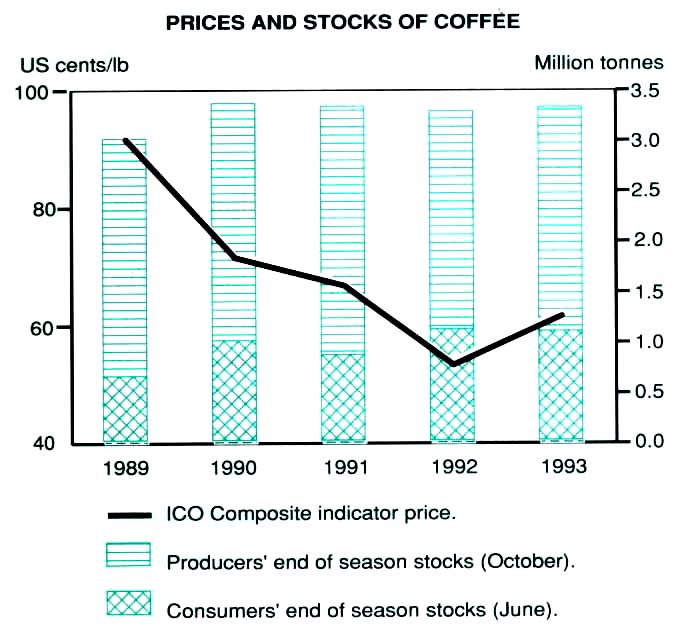
Retention scheme would swell producers' stocks
Producers' stocks, which reached 2.88 million tonnes during 1989, would be expected to fall to 2.21 million tonnes in 1993 and on current trends to just over 2 million tonnes at the end of marketing year 1994. However, envisaged retentions, at up to 20 percent of exports for most producers, could add considerably to producer stocks in 1994. As a result, producers' stocks may be somewhat higher than 2 million tonnes. A build-up of stocks in importing countries has occurred as imports have exceeded consumption. Consumers' stocks, at 1.1 million tonnes at the end of 1992, were equivalent to over three months cover for consumption and over twice the size of normal requirements. Preliminary data suggest that there has only been a small decrease in 1993 but the retention scheme adopted by producers, if effective, should lead to a greater decrease in consumers' stocks during 1994.
The two largest producing stockholders, Brazil and Colombia, have experienced substantial falls in stocks. For Brazil, a succession of short crops has resulted in stocks falling by over one-third and currently they are mainly composed of publicly owned stocks, some in poor condition, which cannot be freely exported. Buoyant trade by Colombia, especially increased shipments to the European Community, has resulted in a reduction of 40 percent in holdings. There have also been reductions elsewhere removing most of the stocks in excess of commercial requirements.
Prices still depressed despite increases in 1993
The ICO composite indicator price recovered by nearly 17 percent during 1993. Fundamental issues of supply and demand provided some underpinning but most of the impetus came from cautious optimism about the success of the producer retention scheme. Nevertheless, pessimistic factors, including the failure of ICA negotiations and the decision by the United States to leave the Agreement, restricted the upward movement. The ICO composite indicator price at about 69 US cents per pound in November 1993 was 26 percent below the average of 1988-90.
Export earnings plunged to $7 240 million in 1992, less than
three quarters of average earnings between 1988 and 1990 and $1
000 million less than in 1991. Price increases in 1993 would more
than compensate for reduced export volumes and export earnings
should be moderately greater.
| Coffee Exporters' Retention
Scheme The failure of negotiations for a new
ICA persuaded producers that their interests would best
be served by adopting an export retention scheme. The
intention is that producing countries will withhold an
amount of coffee equivalent to 20 percent of their
exports until prices reach 75 cents/lb. If prices exceed
this level but are below 85 cents/lb, 10 percent will be
withheld. The scheme met with early problems on its
implementation towards the end of 1993. The most serious
initial problem was the inability of the Brazilian
authorities to purchase sufficient coffee for the
purposes of retention. If these problems can be overcome,
then prices should rise in 1994 though producer receipts
will be affected by contraction in the volume of exports
and the cost of purchasing coffee for stockholding. The
price target of producers, when formulating their
retention scheme, was an increase of some 20 US cents per
pound in the world price of coffee. An increase in world
prices of that size would tend to increase retail prices
by around 10 percent and reduce consumption by about 3
percent, though there would be some differences between
countries in response to higher prices. |
Production1
| 1988-90 Average | 1991 | 1992 | 1993 | ||
| Million tonnes | |||||
| World total | 5.84 | 6.20 | 5.51 | 5.83 | |
| Developing countries | 5.84 | 6.20 | 5.51 | 5.83 | |
| Latin America | 3.77 | 4.17 | 3.59 | 3.82 | |
| Brazil | 1.64 | 1.71 | 1.44 | 1.71 | |
| Colombia | 0.77 | 1.08 | 0.90 | 0.84 | |
| Guatemala | 0.20 | 0.21 | 0.19 | 0.17 | |
| Mexico | 0.30 | 0.28 | 0.24 | 0.23 | |
| Africa | 1.21 | 1.15 | 1.03 | 1.05 | |
| Côte d'Ivoire | 0.24 | 0.24 | 0.19 | 0.24 | |
| Ethiopia | 0.20 | 0.18 | 0.18 | 0.18 | |
| Kenya | 0.10 | 0.09 | 0.08 | 0.08 | |
| Uganda | 0.17 | 0.17 | 0.17 | 0.18 | |
| Asia and Oceania | 0.87 | 0.88 | 0.89 | 0.95 | |
| Indonesia | 0.43 | 0.43 | 0.44 | 0.44 | |
1 Production of green beans in crop years beginning in the year shown.
Consumption
| 1988-90 Average | 1991 | 1992 | ||
| Million tonnes | ||||
| World total | 4.26 | 4.37 | 4.34 | |
| ICO members1 | 3.51 | 3.65 | 3.62 | |
| North America | 1.11 | 1.13 | 1.07 | |
| United States | 1.11 | 1.13 | 1.07 | |
| Europe | 2.09 | 2.15 | 2.22 | |
| EC | 1.77 | 1.82 | 1.89 | |
| France | 0.32 | 0.33 | 0.34 | |
| Germany | 0.57 | 0.63 | 0.65 | |
| Italy | 0.27 | 0.25 | 0.25 | |
| Netherlands | 0.14 | 0.15 | 0.15 | |
| United Kingdom | 0.14 | 0.14 | 0.15 | |
| Other member countries in Europe | 0.33 | 0.33 | 0.34 | |
| Other members | 0.31 | 0.37 | 0.33 | |
| Japan | 0.31 | 0.36 | 0.32 | |
| Non-ICO members2 | 0.75 | 0.72 | 0.72 | |
1 Disappearance in importing countries is derived
on the basis of net imports of all forms of coffee adjusted for
changes in visible inventories.
2 Data refer to net imports.
Exports1
| 1988-90 Average | 1991 | 1992 | ||
| Million tonnes | ||||
| World total2 | 4.54 | 4.60 | 4.69 | |
| Developing countries | 4.31 | 4.40 | 4.49 | |
| Latin America | 2.59 | 2.80 | 2.92 | |
| Brazil | 0.90 | 1.10 | 1.02 | |
| Colombia | 0.67 | 0.74 | 0.93 | |
| Guatemala | 0.18 | 0.17 | 0.20 | |
| Mexico | 0.19 | 0.21 | 0.19 | |
| Africa | 1.00 | 0.88 | 0.89 | |
| Côte d'Ivoire | 0.19 | 0.20 | 0.22 | |
| Ethiopia | 0.08 | 0.05 | 0.04 | |
| Kenya | 0.10 | 0.08 | 0.08 | |
| Uganda | 0.15 | 0.12 | 0.12 | |
| Asia and Oceania | 0.72 | 0.72 | 0.68 | |
| Indonesia | 0.36 | 0.38 | 0.27 | |
1 Green beans only.
2 Including re-exports.
Imports1,2
| 1988-90 Average | 1991 | 1992 | ||
| Million tonnes | ||||
| World total | 4.24 | 4.43 | 4.68 | |
| Developing countries | 0.30 | 0.39 | 0.41 | |
| Developed countries | 3.84 | 4.04 | 4.27 | |
| North America | 1.14 | 1.21 | 1.35 | |
| United States | 1.04 | 1.10 | 1.26 | |
| Europe | 2.16 | 2.40 | 2.48 | |
| EC | 1.79 | 1.85 | 1.96 | |
| Eastern Europe | 0.12 | 0.10 | 0.10 | |
| Former USSR | 0.07 | 0.05 | 0.04 | |
| Other developed countries | 0.34 | 0.38 | 0.38 | |
1 Green beans only.
2 Excluding quantities subsequently re-exported.
Value of exports1
| 1988-90 Average | 1991 | 1992 | ||
| '000 million | ||||
| World total | 10.28 | 8.30 | 7.24 | |
| Developing countries | 8.31 | 6.57 | 5.37 | |
| Latin America | 5.52 | 4.61 | 3.76 | |
| Brazil | 1.78 | 1.51 | 1.09 | |
| Colombia | 1.58 | 1.40 | 1.35 | |
| Guatemala | 0.35 | 0.29 | 0.25 | |
| Mexico | 0.46 | 0.41 | 0.29 | |
| Africa | 1.83 | 1.10 | 0.92 | |
| Côte d'Ivoire | 0.31 | 0.23 | 0.21 | |
| Ethiopia | 0.23 | 0.12 | 0.08 | |
| Kenya | 0.22 | 0.16 | 0.13 | |
| Uganda | 0.22 | 0.12 | 0.10 | |
| Asia and Oceania | 1.14 | 0.86 | 0.70 | |
| Indonesia | 0.47 | 0.37 | 0.24 | |
1 All forms of coffee.
Closing stocks1
| 1988-90 Average | 1991 | 1992 | 1993 | ||
| Million tonnes | |||||
| Producing countries2 | 2.54 | 2.44 | 2.21 | 2.02 | |
| Latin America | 1.44 | 1.44 | 1.24 | 0.97 | |
| Brazil | 0.79 | 0.79 | 0.52 | 0.52 | |
| Colombia | 0.39 | 0.43 | 0.53 | 0.28 | |
| Africa | 0.83 | 0.77 | 0.77 | 0.77 | |
| Asia and Oceania | 0.27 | 0.23 | 0.20 | 0.28 | |
| Consuming countries3 | 0.71 | 0.85 | 1.10 | ... | |
| United States | 0.18 | 0.26 | 0.47 | ... | |
| EC4 | 0.15 | 0.23 | 0.20 | ... | |
| Other countries | 0.38 | 0.36 | 0.43 | ... | |
1 Stocks of green beans.
2 Closing stocks for the marketing year beginning in
the year shown.
3 Closing stocks in calendar year (including those in
Free Ports) in importing member countries of ICO.
4 Excludes Greece and Ireland.
Export unit value1
| 1988-90 Average | 1991 | 1992 | ||
| $/tonne | ||||
| World total | 1 940 | 1 436 | 1 147 | |
| Developing countries | 1 897 | 1 406 | 1 115 | |
| Latin America | 2038 | 1554 | 1 205 | |
| Brazil | 1 742 | 1 263 | 953 | |
| Colombia | 2353 | 1 806 | 1 382 | |
| Guatemala | 1 990 | 1 650 | 1 269 | |
| Mexico | 2232 | 1 816 | 1 428 | |
| Africa | 1 785 | 1 195 | 955 | |
| Côte d'lvoire | 1 576 | 924 | 679 | |
| Ethiopia | 2763 | 2340 | 2306 | |
| Kenya | 2335 | 1 870 | 1 637 | |
| Uganda | 1 440 | 942 | 798 | |
| Asia and Oceania | 1 551 | 1 086 | 936 | |
| Indonesia | 1 367 | 977 | 878 | |
1 Green beans only.
Prices1
| 1988-90 Average | 1991 | 1992 | 1993 | |
| US cents/lb (450 g) | ||||
| Unwashed arabicas | 101 | 73 | 57 | 67 |
| Colombia milds | 108 | 90 | 68 | 76 |
| Other milds | 110 | 85 | 64 | 70 |
| Robustas | 75 | 50 | 44 | 53 |
| Composite price | 93 | 67 | 53 | 62 |
1 International Coffee Organization indicator price.