Cotton
Jute,
kenaf and allied fibres
Hard fibres
Natural
rubber
Hides
and skins
Consumption recovered in 1992/93
Global consumption of raw cotton increased to 18.8 million
tonnes in 1992/93 following a decline in the previous year. The
rise to a new record level reflected a continuation of a
long-term trend resulting from growth in world population and in
consumption per head. One influence had been the decline in
prices of cotton relative to those of other fibres. The expansion
in mill consumption was concentrated in developing countries
while processing in the developed countries continued to
contract. Mills in China, the world's largest processor,
increased their consumption by 10 percent to 4.8 million tonnes,
the highest level since the peak of 1986/87. India and Pakistan
both increased their cotton consumption in line with long-term
trends, although India's consumption had declined in 1991/92.
Indonesia, Thailand and Turkey also increased use in 1992/93.
They continued to attract new investment in the place of
established processors such as the Republic of Korea, Taiwan
Province and Hong Kong, which were disadvantaged by higher
processing costs.
Among the developed countries, only the United States increased
its mill consumption significantly in 1992/93 reflecting new
investment in spinning equipment and strong domestic end-use
demand. Almost every country in western Europe, and Japan,
suffered a loss of processing to lower-cost countries. Mill
consumption in the countries of eastern Europe and the former
USSR also continued to contract, mainly from the effects of
structural changes.
Production declined in 1992193
Average global yields have increased by an average of 2 percent annually over the past two decades. However, in 1992/93, the effects of drought, pests and disease in some countries contributed to a fall of almost 8 percent, the largest percentage drop in yields on record. At the same time, the global area harvested contracted by 6 percent, as producers in many countries responded to the previous season's cut in prices. As a result, global production of cotton declined by almost 14 percent to just under 18 million tonnes in 1992/93, following a record 20.8 million tonnes output in the previous year. Substantial declines were recorded in developing as well as in developed countries. Production in China fell by well over 1 million tonnes, or by 20 percent, as a result of a combination of abnormal temperatures, drought and boll weevil infestation, coupled with the disincentives of increased input costs and, in some cases, delayed payment to farmers. Pakistan's production contracted by 28 percent, mainly due to an infestation of leaf-curl virus in addition to excessive rain and flooding. Both China and Pakistan had recorded large increases in 1991/92. In India production increased to 2.3 million tonnes in 1992/93, exceeding the previous peak of 1989/90. Production in Latin America and the Caribbean almost halved, with notable declines in Mexico, Argentina, Brazil and Colombia, attributed largely to the impact of reduced cotton prices and increased costs of inputs, including credit. Adverse weather in the United States reduced production by 8 percent to 3.5 million tonnes, but it might have fallen further had the cotton programme not insulated farmers from the depression in international prices. In Uzbekistan, the major cotton producer among the countries of the former USSR, production dropped by 15 percent to 1.3 million tonnes, due to poor weather at planting time and to continued environmental problems associated with the production of cotton, while production in other countries of the former USSR also contracted.
World trade fell in 1992/93
The volume of world trade in raw cotton contracted by 6 percent in 1992/93. The largest decline in shipments was from the United States and followed a significant reduction in exports in the previous year. This not only reflected contraction in production but also diversion of supplies to stocks under the government's cotton programme. Shipments from Paraguay, Zimbabwe and Pakistan also contracted with reduced production, while those of India and Greece expanded.
Stocks reduced but prices continued to fall As global consumption exceeded production in 1992/93, stocks in August 1993 fell by some 6 percent from levels of a year earlier. This was despite a 25 percent rise in stocks in the United States. Stocks in China, which doubled in 1991/92 to far exceed those of any other country, were reduced only slightly despite sharply reduced production. In the countries of the former USSR, stocks declined slightly but remained in excess of one million tonnes.
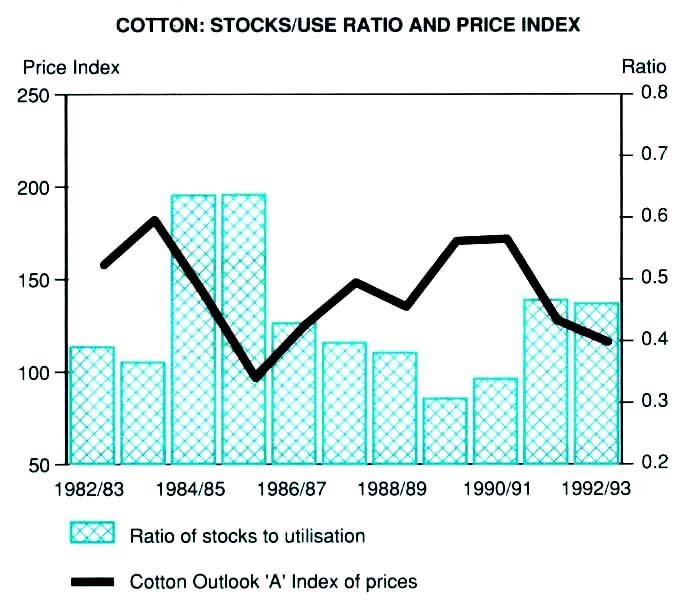
Cotton prices, as indicated by the average of the Cotlook 'A' index, declined by 9 percent in 1992/93, after falling by 24 percent in the previous year. This resulted largely from the build-up in stocks associated with high levels of production in the 1991/92 season. The high incidence of barter trade from the countries of the former USSR also had a depressing impact on prices. Export earnings in 1992/93 were expected to be around 25 percent lower than in the previous year, reflecting a combination of lower prices and smaller shipments.
Cotton: stocks/use ratio and price index
Consumption to expand in 1993/94
Consumption of cotton was expected to continue to expand in 1993/94 and could reach a record level of over 19 million tonnes. This growth was expected in response to decreased prices, economic expansion in some markets, and increased world population. However, consumption of other fibres was also expected to increase, and therefore gains in market share by cotton were expected to be slight. The growth in mill consumption of cotton was likely to be concentrated in developing countries, including China, Thailand, Indonesia, Malaysia, the Philippines, Vietnam, and Brazil. The Republic of Korea, Taiwan Province and Hong Kong were expected to continue to lose cotton processing to other countries in the region with lower costs. India and Pakistan were also likely to expand their levels of processing in 1993/94. Consumption in the United States was expected to expand because of new investment in mills, and eastern Europe could show some recovery following a number of years in which consumption declined. In other developed countries, including those in western Europe, those of the countries of the former USSR and Japan, mill consumption is expected either to decline or to remain unchanged in 1993/94.
Production to recover
The area sown to cotton may contract further in 1993/94, but if yields return to their preceding levels, a 3 percent expansion in production would be expected. Production in Pakistan is expected to recover from the low yields of 1992/93, but in China it is likely to decline further under the continued impact of reduced producer returns and pest infestations. Dry conditions could depress production in India. In some Latin American countries, notably Argentina, Brazil and Paraguay, prices paid to producers were increased under administrative arrangements and some increase in production was expected. Normal weather conditions in the United States would allow production to exceed that of 1992/93. The decline in production in the countries of the former USSR which was evident in recent years could be halted in 1993/94 should weather conditions be suitable. However, in Australia, production may continue to be reduced by drought.
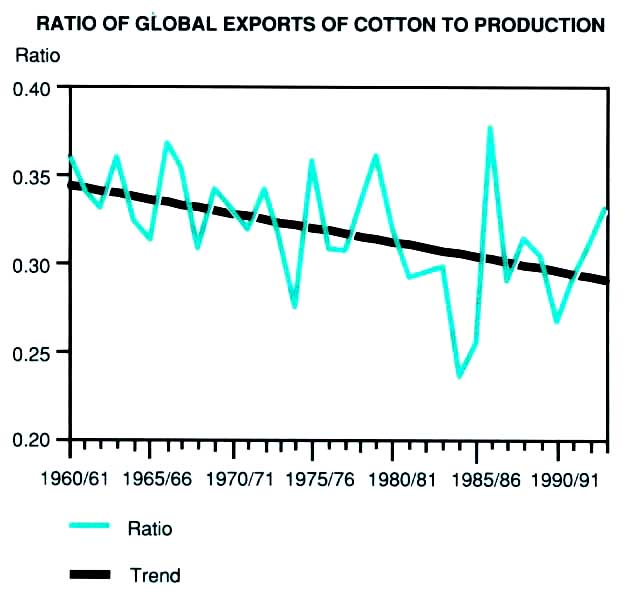
Ratio of global exports of cotton to production
Stocks to contract further and prices to recover in 1993/94
Global end of season stocks are expected to decline by some 9 percent as consumption was forecast to again exceed production in 1993/94. Under these circumstances, prices would be expected to recover, and have been forecast by the International Cotton Advisory Committee to average 14 percent higher than in the previous year.
Trade to expand in 1993/94
Increases in production in some major exporting countries in 1993/94 was expected to spur the shipment of 15 percent more than in the previous year and a return to a level. close to that of 1989/90. Exports from the United States were expected to increase to over 1.3 million tonnes, in line with increased production, but will remain well below the levels of some earlier years. Net exports of countries of the former USSR were expected to expand, reflecting a production increase in countries facing static consumption. Shipments from Paraguay were also likely to be boosted by production increases, while exports from Zimbabwe were likely to be boosted by the large stocks accumulated in 1992/93. The global value of cotton traded is likely to increase significantly as both volumes and prices of cotton were expected to increase in 1993/94.
Prospects for 1994/95
Anticipated developments for the 1994/95 season point to
production again expanding at a slower rate than consumption,
under the continuing influence of reduced world prices during
recent years. Thus stocks would be expected to contract further,
laying the foundation for increases in prices. It has been
proposed in the Uruguay Round of multilateral trade negotiations
that the Multi-Fibre Arrangement should be brought within the
GATT rules and, to that effect, that quotas should be replaced by
tariffs which would be progressively reduced over a 10 year
period, This would facilitate an expansion of trade in cotton
manufactured items and, as a consequence, in raw cotton. It is
unlikely, however, that any substantial effects would be apparent
in the next few years.
| New edition of the
World Apparel Fibre Consumption Survey In the late eighties, per caput consumption of all fibres: cotton; wool; flax; cellulosic and synthetic fibres, rose more rapidly in the developing than in the developed countries. Between 1987 and 1989, global fibre consumption rose by about 4 percent per caput, while in the developing countries it rose by more than 6 percent. Among the developing countries, the Latin American region had the highest per caput fibre consumption. The market share of cotton declined a little at the end of the eighties, from almost 49 percent in 1987 to 47.5 percent in 1989. This loss of share was concentrated in the developing countries and was the result of consumption of synthetic fibres growing faster than cotton. Consumption of cotton, nevertheless, expanded modestly over this period. These data come from the fifth edition of FAO's World Apparel Fibre Consumption Survey which was published recently. This document provides data on mill consumption of fibres, trade in textiles and clothing, and end-use consumption of cotton, wool, flax, cellulosic fibres and synthetic fibres. It contains details for 133 countries and 26 regions and subregions for the years 1987, 1988, 1989 and, for developed countries, 1990. Levels of consumption per caput are also given, to provide a basis for making comparisons between countries. 1 World Apparel Fibre Consumption Survey, FAO, 1992. |
Production1
| 1988-90 Average | 1991 | 1992 | 1993 | ||
| '000 tonnes | |||||
| World total | 18243 | 20827 | 17970 | 18474 | |
| Developing countries | 11 633 | 13678 | 11 634 | 11 631 | |
| Latin America | 1 742 | 1 590 | 891 | 1 148 | |
| Argentina | 256 | 250 | 140 | 223 | |
| Brazil | 697 | 667 | 416 | 514 | |
| Paraguay | 237 | 152 | 145 | 228 | |
| Africa | 787 | 803 | 892 | 802 | |
| Near East | 1 333 | 1 274 | 1 362 | 1 275 | |
| Egypt | 298 | 291 | 358 | 336 | |
| Sudan | 116 | 92 | 55 | 77 | |
| Turkey | 641 | 561 | 574 | 514 | |
| Far East | 7771 | 10 Oil | 8489 | 8406 | |
| China | 4 148 | 5675 | 4508 | 4 150 | |
| India | 2033 | 2053 | 2329 | 2210 | |
| Pakistan | 1 506 | 2 180 | 1 559 | 1 955 | |
| Developed countries | 6609 | 7149 | 6336 | 6843 | |
| United States | 3 129 | 3835 | 3 531 | 4038 | |
| Former USSR | 2 687 | 2490 | 2 050 | 2 380 | |
| Oceania | 346 | 502 | 373 | 327 | |
1 Season beginning 1 August of the year shown,
Source: ICAC.
Utilization1
| 1988-90 Average | 1991 | 1992 | 1993 | ||
| '000 tonnes | |||||
| World total | 18674 | 18350 | 18835 | 19286 | |
| Developing countries | 12052 | 12344 | 13114 | 13589 | |
| Latin America | 1 424 | 1 430 | 1 485 | 1 519 | |
| Africa | 333 | 351 | 387 | 409 | |
| Near East | 1 113 | 1 133 | 1 194 | 1 228 | |
| Far East | 9 181 | 9 430 | 10 048 | 10 433 | |
| China | 4618 | 4 379 | 4 833 | 5004 | |
| India | 1 865 | 1 899 | 2 025 | 2 106 | |
| Developed countries | 6622 | 6006 | 5721 | 5697 | |
| United States | 1 829 | 2 093 | 2 221 | 2 308 | |
| Europe | 1 964 | 1 552 | 1 504 | 1 526 | |
| EC | 1 266 | 1 139 | 1 099 | 1 096 | |
| Eastern Europe | 598 | 315 | 301 | 325 | |
| Former USSR | 1 966 | 1 594 | 1 322 | 1 257 | |
| Other developed countries | |||||
| Japan | 702 | 609 | 512 | 435 | |
1 Season beginning 1 August of the year shown.
Source: ICAC.
Exports
| 1988-90 Average | 1991 | 1992 | 1993 | ||
| '000 tonnes | |||||
| World total | 5343 | 4884 | 4589 | 5308 | |
| Developing countries | 2557 | 2144 | 2017 | 2 188 | |
| Latin America | 663 | 586 | 269 | 272 | |
| Argentina | 128 | 123 | 87 | 52 | |
| Paraguay | 210 | 252 | 117 | 183 | |
| Africa | 599 | 626 | 627 | 642 | |
| Near East | 378 | 310 | 337 | 336 | |
| Syria | 73 | 135 | 177 | 152 | |
| Turkey | 118 | 56 | 71 | 100 | |
| Far East | 916 | 622 | 784 | 938 | |
| China | 280 | 131 | 150 | 300 | |
| India | 153 | - | 303 | 265 | |
| Pakistan | 464 | 448 | 300 | 325 | |
| Developed countries | 2786 | 2740 | 2570 | 3 120 | |
| United States | 1 570 | 1 447 | 1 132 | 1 372 | |
| Former USSR | 610 | 640 | 830 | 1 220 | |
| Oceania | 323 | 459 | 381 | 327 | |
1 Season beginning 1 August of the year shown.
2 In addition trade between countries of the former
USSR was estimated at 1.2 million tonnes in 1991/92, and 0.95
million tonnes in 1992/93 and forecast at 0.9 million tonnes in
1993/94.
Source: ICAC.
Imports1
| 1988-90 Average | 1991 | 1992 | 1993 | ||
| '000 tonnes | |||||
| World total | 5505 | 5 157 | 4950 | 5210 | |
| Developing countries | 2854 | 3077 | 3030 | 3 260 | |
| Latin America | 252 | 320 | 630 | 810 | |
| Africa | 131 | 150 | 200 | 183 | |
| Near East | 135 | 159 | 250 | 184 | |
| Far East | 2 336 | 2 440 | 1 960 | 2 093 | |
| China | 988 | 695 | 343 | 368 | |
| Indonesia | 282 | 408 | 420 | 450 | |
| Korea Rep. | 453 | 392 | 377 | 338 | |
| Thailand | 297 | 357 | 320 | 391 | |
| Developed countries | 2653 | 2080 | 1 920 | 1 950 | |
| Europe | 1 836 | 1 390 | 1 330 | 1 420 | |
| EC | 1 108 | 990 | 900 | 990 | |
| Eastern Europe | 626 | 310 | 320 | 320 | |
| Former USSR | 59 | 200 | - | - | |
| Other developed countries | 758 | 490 | 590 | 530 | |
| Japan | 693 | 588 | 489 | 429 | |
1 Season beginning 1 August of the year shown.
Source: ICAC.
Value of exports1
| 1988-90 Average | 1991 | 1992 | 1993 | ||
| Million $ | |||||
| World total | 8333 | 7923 | 6 195 | 8239 | |
| Developing countries | 3707 | 3210 | 2545 | 3 154 | |
| Latin America | 842 | 808 | 311 | 356 | |
| Argentina | 132 | 152 | 84 | 58 | |
| Paraguay | 287 | 373 | 132 | 237 | |
| Africa | 871 | 958 | 876 | 1 018 | |
| Near East | 737 | 586 | 554 | 636 | |
| Syria | 133 | 284 | 280 | 276 | |
| Turkey | 171 | 93 | 96 | 135 | |
| Far East | 1 256 | 893 | 874 | 1 203 | |
| China | 468 | 234 | 218 | 498 | |
| India | 249 | - | 282 | 283 | |
| Pakistan | 580 | 668 | 340 | 422 | |
| Developed countries | 4626 | 4713 | 3649 | 5086 | |
| United States | 2 512 | 2364 | 1 593 | 2219 | |
| Former USSR | 1 202 | 1 261 | 996 | 1 671 | |
| Oceania | 576 | 684 | 526 | 520 | |
1 Season beginning 1 August of the year shown.
Source: Derived from official trade data.
Stocks1
| 1987-89 Average | 1991 | 1992 | 1993 | ||||||
| Million tonnes | |||||||||
| World total | 6.53 | 6.30 | 8.71 | 8.16 | |||||
| China | 1.23 | 1.38 | 3.15 | 2.78 | |||||
| United States | 1.15 | 0.51 | 0.81 | 1.01 | |||||
| Net exporters | 5.07 | 4.92 | 7.47 | 7.02 | |||||
| Net importers | 1.47 | 1.38 | 1.24 | 1.14 | |||||
1 Opening stocks of season beginning 1 August of the year shown. Source: USDA.
Export unit value1
| 1988-90 Average | 1991 | 1992 | 1993 | ||
| US cents/kg | |||||
| World total | 156 | 161 | 134 | 154 | |
| Developing countries | 145 | 150 | 126 | 144 | |
| Latin America | 127 | 137 | 115 | 132 | |
| Argentina | 102 | 123 | 97 | 111 | |
| Paraguay | 136 | 148 | 113 | 130 | |
| Africa | 146 | 152 | 139 | 159 | |
| Near East | 194 | 189 | 163 | 187 | |
| Syria | 175 | 211 | 158 | 182 | |
| Turkey | 142 | 167 | 135 | 155 | |
| Far East | 137 | 144 | 112 | 128 | |
| China | 165 | 180 | 145 | 166 | |
| India | 176 | - | 93 | 107 | |
| Pakistan | 127 | 149 | 113 | 130 | |
| Developed countries | 166 | 172 | 142 | 163 | |
| United States | 160 | 163 | 141 | 162 | |
| Former USSR | 196 | 197 | 120 | 137 | |
| Oceania | 177 | 149 | 138 | 159 | |
1 Season beginning 1 August of the year shown.
Source: Derived from official trade data.
Prices1
| 1988-90 Average | 1991 | 1992 | 19939 | |
| US cents/kg | ||||
| Cotlook 'A' Index2 | 170 | 139 | 127 | 128 |
| United States3 | 177 | 147 | 139 | |
| Mexico4 | 168 | 151 | 138 | |
| Pakistan5 | 155 | 128 | 116 | |
| Turkey6 | 181 | 165 | 148 | |
| Egypt7 | 540 | 393 | 307 | |
| Polyester A8 | 174 | 161 | 165 | |
| Polyester R8 | 182 | 169 | 172 | |
1 Cotton prices are c.i.f. United Kingdom. Season
beginning 1 August of the year shown.
2 Source: Cotton Outlook.
3 United States: Memphis Territory Middling 1 3/32
inches.
4 Mexico: Middling 1 3/32 inches.
5 Pakistan: Afzal 1 3/32 inches.
6 Turkey: Izmir/Antalya ST 1 White 1 3/32 inches RG.
7 Egypt: Gisa 70.
8 Polyester: Average market price for 1.5 denier
reported by the United States Department of Agriculture; A =
Actual, R = Raw fibre equivalent.
9 First six months (August 1993 to January 1994).
Source: ICAC.