Prospects for another small crop in 1993/94
World production of jute, kenaf and allied fibres was forecast to decline by 6 percent to about 3 million tonnes in 1993/94. Sharp reductions in production in Bangladesh and India would more than offset some increases in China and Thailand. The main reasons for this decline were the late arrival of the monsoon and an area reduction reflecting diminished producer prices and prospects compared to alternative crops. Production in Thailand recovered slightly from the previous season's greatly diminished output while in China, the third largest jute producing country, production was likely to recover further. with increased domestic demand.
Fibre stocks remain adequate
Despite the low level of production for the second consecutive year, supplies were likely to be adequate in 1993/94 as a result of relatively large stocks at the beginning of the season. Moreover, recessionary economic conditions were expected to continue to dampen recovery in demand for jute fibre and products in some markets.
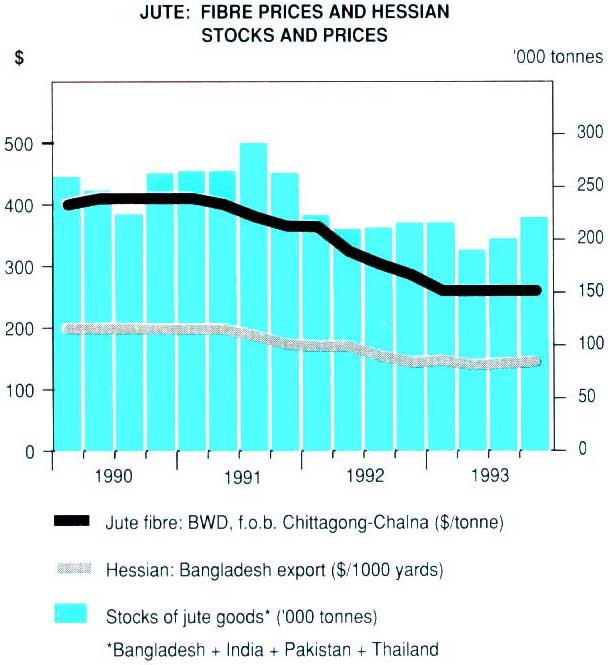
Jute: Fibres prices and hessian stocks and prices
Exports of fibre continued to decline in 1992/93
World exports of raw jute, kenaf and allied fibres declined in 1992/93 for the third consecutive year. Although global exports, at 348 000 tonnes, were only slightly below the previous year's level, they were 31 percent below the 500 000 tonnes peak in 1989/90. Exports from Bangladesh, the largest supplier to the world market, recovered slightly in 1992/93 but those from India and China fell further. Exports from Thailand and Nepal were maintained. Total earnings from fibre exports fell 16 percent to $97 million in 1992/93.
Product earnings declined despite higher volume
World exports of jute and kenaf products grew for the second consecutive season in 1992/93 in contrast with the contraction in the fibre trade. Exports rose by 2.4 percent to 934 000 tonnes. although they remained below the average level of the late 1980s. A sharp recovery in exports from India accounted for the bulk of rise. There, production and exports recovered with the return to normal mill working following a long strike in the previous season. Shipments from Bangladesh and China rose slightly, while those from Thailand declined. Among individual products only exports of sacking from the major exporting countries increased in 1992/93. The total value of products exported fell slightly in 1992/93 with a decline in many of their prices.
Stocks of jute products in the major manufacturing countries fell from 210 000 tonnes in 1991/92 to 196 000 tonnes in 1992/93. The fall reflected reduced stocks of hessian and sacking in Bangladesh and India, but increased stocks of carpet backing in Bangladesh and India and of sacking in Thailand and Pakistan.
Imports of fibre continued to decline but those of products had recovered in 1992/93
A sharp decline in the imports of the developed countries in 1992/93 was not offset by a further recovery in the fibre imports of the developing countries, which account for about 80 percent of trade. The decline in imports into the developed countries was due to a sharp contraction in Europe and countries of the former USSR which was not offset by a small increase in North America. A considerable increase in imports into Thailand was mainly responsible for the market growth in the developing countries, although India also imported larger quantities in 1992/93. However, consignments to Pakistan, the leading largest importer of fibre, fell due to the closure of some mills.
World imports of products recovered in the 1992 calendar year reflecting a marked increase in developing countries. By contrast, imports into developed countries declined further due to recession and substitution by synthetics. Among the developing regions, an increase in the imports of the Near East, of over 60 percent, more than offset declines in Africa, the Far East and Latin America and the Caribbean. In the developed countries. market losses in North America and the countries of the former USSR negated a recovery in Europe.
Prices of jute fibre and most products remained depressed
The decline in export prices of raw jute since 1990/91 continued through the 1992/93 season. The average f.o.b price of the representative grade of raw jute, BWD grade from Bangladesh ports, fell by 22 percent to $277 tonne in 1992/93. Depressed import demand was responsible for this fall. Export prices of kenaf, however, remained stable at relatively high levels, because of scarcity of supplies. The f.o.b. price for Thai "A" grade in 1992/93 was $361 per tonne.
Annual average export prices of jute products declined in 1992/93 except those of carpet backing from India and yarn from Thailand. Although prices of carpet backing from India were 11 percent up in 1992/93, quotations in July 1993 were well below those of 12 months earlier.
Price outlook highly dependent on crop prospects for 1994/95
The reduced production of jute, kenaf and allied fibres in prospect for 1993/94 compared with mill. export and other requirements indicated a decline in stocks. The mid 1994 stock levels were forecast to be unusually low. Price developments in the latter part of the season would therefore be particularly sensitive to prospects for the 1994/95 crop. Should grower prices remain depressed during the season or the weather be adverse, global fibre production may decline. This, combined with diminished stocks, could destabilize prices and scale down the markets for jute fibre and products.
Production
| 1988/89- 1990/91 Average |
1991/ 1992 |
1992/ 1993 |
1993/ 19941 |
||
| '000 tonnes | |||||
| World total | 3338 | 3409 | 3 153 | 2976 | |
| Developing countries | 3292 | 3363 | 3107 | 2930 | |
| Far East | 3220 | 3 320 | 3 063 | 2 888 | |
| Bangladesh | 850 | 945 | 885 | 783 | |
| China | 642 | 513 | 619 | 650 | |
| India | 1 455 | 1 620 | 1 332 | 1 224 | |
| Indonesia | 14 | 14 | 7 | 19 | |
| Myanmar | 35 | 22 | 43 | 30 | |
| Nepal | 16 | 19 | 10 | 10 | |
| Thailand | 173 | 157 | 130 | 134 | |
| Developed countries | 46 | 46 | 46 | 46 | |
1 Forecasts issued by Intergovernmental Group on Jute, Kenaf and Allied Fibres in December 1993.
Imports of fibres
| 1988/89- 1990/91 Average |
1991/ 1992 |
1992/ 1993 |
||
| '000 tonnes | ||||
| World total | 393 | 378 | 368 | |
| Developing countries | 252 | 269 | 286 | |
| Africa | 37 | 40 | 37 | |
| Algeria | 4 | 5 | 5 | |
| Côte d'Ivoire | 9 | 6 | 8 | |
| Morocco | 8 | 9 | 6 | |
| Tunisia | 2 | 3 | 2 | |
| Near East | 32 | 39 | 36 | |
| Egypt | 15 | 19 | 20 | |
| Iran | 10 | 12 | 9 | |
| Turkey | 6 | 8 | 7 | |
| Far East | 165 | 172 | 198 | |
| China | 6 | 5 | 4 | |
| India | 23 | 9 | 18 | |
| Indonesia | 19 | 20 | 28 | |
| Pakistan | 106 | 118 | 100 | |
| Thailand | ... | 15 | 44 | |
| Developed countries | 141 | 109 | 82 | |
| United States | 9 | 7 | 6 | |
| Europe | 88 | 63 | 48 | |
| Former USSR | 27 | 25 | 15 | |
Exports
| 1988/89- 1990/91 Average |
1991/ 1992 |
1992/ 1993 |
||
| '000 tonnes | ||||
| World total | ||||
| Fibre | 422 | 350 | 348 | |
| Products | 992 | 912 | 934 | |
| Developing countries | ||||
| Fibre | 402 | 338 | 337 | |
| Far East | 401 | 338 | 334 | |
| Bangladesh | 318 | 276 | 282 | |
| China | 47 | 36 | 32 | |
| Products | 885 | 817 | 841 | |
| Far East | 880 | 817 | 829 | |
| Bangladesh | 480 | 487 | 492 | |
| China | 62 | 48 | 50 | |
| India | 209 | 186 | 215 | |
| Nepal | 11 | 12 | 10 | |
| Thailand | 98 | 69 | 65 | |
| Developed countries | ||||
| Fibre | 21 | 12 | 12 | |
| Products | 107 | 95 | 93 | |
Jute products output1
| 1988/89- 1990/91 Average |
1991/ 1992 |
1992/ 1993 |
||
| '000 tonnes | ||||
| World total | 3509 | 3 142 | 3225 | |
| Developing countries | 3336 | 2991 | 3097 | |
| Far East | 3 134 | 2 784 | 2 953 | |
| Bangladesh | 610 | 558 | 618 | |
| China | 713 | 608 | 589 | |
| India | 1 471 | 1 361 | 1 437 | |
| Indonesia | 18 | 11 | 11 | |
| Myanmar | 18 | 12 | 15 | |
| Nepal | 15 | 19 | 19 | |
| Thailand | 184 | 137 | 123 | |
| Developed countries | 173 | 151 | 128 | |
| Europe | 66 | 64 | 43 | |
1 Output of jute products in fibre equivalent.
Value of exports
| 1988/89- 1990/91 Average |
1991/ 1992 |
1992/ 1993 |
||
| Million $ | ||||
| World total | 804 | 726 | 700 | |
| Fibre | 147 | 116 | 97 | |
| Products | 657 | 610 | 603 | |
| Developing countries | ||||
| Fibre | 137 | 108 | 89 | |
| Far East | 137 | 108 | 89 | |
| Bangladesh | 112 | 87 | 75 | |
| China | 16 | 15 | 12 | |
| India | 4 | 4 | 1 | |
| Nepal | 2 | - | - | |
| Thailand | 2 | 2 | 2 | |
| Products | 525 | 493 | 478 | |
| Far East | 524 | 492 | 476 | |
| Bangladesh | 267 | 290 | 266 | |
| China | 41 | 29 | 30 | |
| India | 153 | 119 | 134 | |
| Nepal | 5 | 5 | 4 | |
| Thailand | 59 | 49 | 43 | |
| Developed countries | ||||
| Fibre | 11 | 8 | 8 | |
| Products | 131 | 117 | 125 | |
Closing stocks of fibres
| 1988/89- 1990/91 Average |
1991/ 1992 |
1992/ 1993 |
1993/ 19941 |
|
| '000 tonnes | ||||
| World total1 | 673 | 866 | 689 | 357 |
| Bangladesh | 281 | 243 | 241 | 160 |
| India | 299 | 576 | 396 | 162 |
1 Forecasts issued by Intergovernmental Group on
Jute, Kenaf and Allied Fibres in December 1993.
2 Includes Bangladesh, India, Myanmar, Nepal and
Thailand only.
Imports of products
| 1988-90 Average | 1991 | 1992 | ||
| '000 tonnes | ||||
| World total | 936 | 881 | 923 | |
| Developing countries | 318 | 280 | 347 | |
| Africa | 63 | 77 | 64 | |
| Algeria | 11 | 23 | 18 | |
| Kenya | 5 | 5 | 2 | |
| Tanzania | 1 | 1 | - | |
| Zimbabwe | 19 | 15 | 11 | |
| Near East | 152 | 134 | 218 | |
| Iran | 27 | 35 | 48 | |
| Sudan | 45 | 40 | 62 | |
| Syria | 18 | 24 | 53 | |
| Turkey | 14 | 15 | 14 | |
| Far East | 77 | 57 | 51 | |
| China | 3 | 0 | 0 | |
| Indonesia | 8 | 6 | 11 | |
| Myanmar | 5 | 5 | 5 | |
| Pakistan | 10 | 16 | 9 | |
| Developed countries | 617 | 601 | 576 | |
| United States | 91 | 89 | 74 | |
| Europe | 272 | 280 | 288 | |
| EC | 261 | 266 | 277 | |
| Former USSR | 131 | 120 | 110 | |
Prices f.o.b.
| 1988/89- 1990/91 Average |
1991/ 1992 |
1992/ 1993 |
|
| $/tonne | |||
| Jute: Bangladesh White D | 390 | 356 | 277 |
| Kenaf: Thai 'A' | 318 | 364 | 364 |