![]()
![]()
![]()
Material and methods
Results
Discussion
References
K.W. Mchau and O. Syrstad
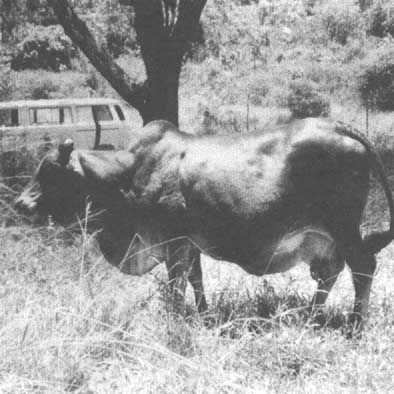
Mr Mchau is Principal Livestock Research Officer, Uyole Agricultural Centre, PO Box 400, Mbeya, United Republic of Tanzania. Mr Syrstad is Senior Scientist in the Norwegian Centre for International Agricultural Development (NORAGRIC), Agricultural University of Norway, Box 2, 1432 As-NLH Norway. This research was carried out when Mr Mchau was studying at the Agricultural University of Norway, supported by a fellowship from the Norwegian Agency for International Development (NORAD).Part 1 of this article, "Lactation yield and length", appeared in World Animal Review No. 65. Part 2 outlines a study on the lactation curve of Mpwapwa cattle carried out in central Tanzania. Although many studies have been made on the lactation curve of temperate dairy breeds, this article is of particular interest as the Mpwapwa is a unique and unconventional dairy breed - a cross of four zebu and one temperate dairy breed.
The change in level of milk yield in the course of a lactation is described by the lactation curve. The lactation curve has been the subject of many studies, especially in temperate dairy breeds. The main reason for repeating it here is that the Mpwapwa, as a synthetic dairy breed, is unique in having so much zebu blood (about 90 percent) from four zebu breeds. Therefore findings from more conventional dairy breeds may not be applicable to the Mpwapwa breed in the environment of central Tanzania. Hence the objective of this study is to document the characteristics of the lactation curve of the Mpwapwa breed and to determine the influence of several environmental factors on its shape.
The background of Mpwapwa cattle, the general management of the cows and the environment in which they performed have been described in Part 1 of this article (Mchau, 1988). In the present study, only lactations of 200 days or more have been considered. All lactations were divided into periods of four weeks, beginning with the first day of lactation. Thus the first four-week period covered the first 28 days of lactation and the 11th four-week period involved the last 25 days of a 305-day lactation.
Four-week milk yields were determined by adding up the daily milk yields of each period. Milk yield was assigned the value zero for all days a cow was dry before the 305th day of lactation. Four-week milk yields for each of the 11 periods were analysed separately by computer using the "Statistical Analysis System" programs for general linear models. The influence of the supposedly most important sources of variation, namely year of calving, lactation number, calving interval and month of calving, was examined according to the following model (model 1):
Yijklm = m + ai + cj + dk + fl + eijklm
where,
Yijklm = four-week milk yield
m = overall mean
ai = effect of the ith year of calving, i = 59-81
cj = effect of the jth lactation number, j = 1-7
dk = effect of the kth calving interval group, k = 1-10
fl = effect of the lth month of calving, I = 1-12
eijklm = a random element
In another analysis all four-week records were merged and assigned to the appropriate stage of lactation and period of the year. The year was divided into 13 periods of 28 (or 29) days, and each record assigned to the period during which it was initiated. The records were then analysed according to model 2:
Yijklm = m + ai + cj + dk + fl + eijklm
where,
ai = effect of the ith year, i = 59-81
dk = effect of the kth period of the year, k = 1-13
fl = effect of the lth stage of lactation, I = 1-11
and the other symbols were as defined above.
1. Means and standard deviations for tour week milk yields in various periods of lactation (1493 lactations)
Moyennes et écarts types de la production laitière sur quatre semaines a diverges périodes de lactation (1 493 lactations)
Medias y desviaciones estándar de la producción de leche durante cuatro semanas en diversos periodos de la lactación (1493 lactaciones)
|
Period of lactation |
Mean yield |
Standard deviation |
Residual standard deviation 1 |
|
(kg) |
(kg) |
(kg) |
|
|
1st four weeks |
217.2 |
83.2 |
65.7 |
|
2nd four weeks |
213.8 |
77.2 |
62.4 |
|
3rd four weeks |
190.8 |
70.7 |
58.0 |
|
4th four weeks |
171.8 |
66.1 |
54.3 |
|
5th four weeks |
155.1 |
59.8 |
51.0 |
|
6th four weeks |
141.4 |
56.9 |
49.4 |
|
7th four weeks |
128.4 |
55.2 |
48.6 |
|
8th four weeks |
110.2 |
55.2 |
49.7 |
|
9th four weeks |
89.8 |
58.8 |
52.2 |
|
10th four weeks |
71.6 |
56.6 |
52.0 |
|
11th four weeks |
49.8 |
47.8 |
43.5 |
1 After accounting for the effect of year and month of calving, lactation number and calving interval
2. Analysis of variance showing the proportions of sums of squares accounted for by year of carving, lactation number and carving Interval, and month of calving
Analyse de variance mettant en évidence les proportions des sommes des carres résultant de l'année de vêlage, du nombre de lactations, de l'intervalle de vêlage et du mois de vêlage
Análisis de la varianza que Indica las proporciones de las sumas de cuadrados correspondientes al año de parto, numero de lactación e Intervalo entre partos y mes del parto
|
Trait |
Percentage of total sum of squares accounted for by: |
||||
|
Model |
Year of calving |
Calving interval |
Lactation number |
Month of calving |
|
|
Four-week milk yields |
|||||
|
1st period |
40 |
122 |
32 |
242 |
22 |
|
2nd |
37 |
122 |
42 |
182 |
32 |
|
3rd |
35 |
142 |
42 |
142 |
32 |
|
4th |
35 |
162 |
62 |
112 |
32 |
|
5th |
30 |
142 |
42 |
92 |
32 |
|
6th |
27 |
132 |
62 |
62 |
22 |
|
7th |
25 |
122 |
52 |
32 |
22 |
|
8th |
21 |
102 |
52 |
11 |
22 |
|
9th |
18 |
92 |
62 |
<13 |
22 |
|
10th |
18 |
92 |
72 |
<13 |
22 |
|
11th |
20 |
92 |
82 |
11 |
13 |
1 significant at 0.001 < P < 0.01
2 significant at P < 0.001
3 non significant (P > 0.05)
Differences between means were tested for significance by the Newman-Keuls method (described by Snedecor and Cochran, 1967) as modified by Kramer (1956) for means with unequal numbers of observations.
The means and standard deviations for four-week milk yields at various stages of lactation are given in Table 1. Maximum mean four-week yield was observed in the first period (217.2 kg) and minimum mean yield in the 11th period (49.8 kg), the respective coefficients of variation being 38 and 96 percent. The coefficients of variation were 36-40 percent in the first six periods and then increased sharply in subsequent periods.
Table 2 shows the proportions of the total variation in four-week milk yields accounted for by year of calving, lactation number, calving interval and month of calving, for each of the 11 periods. The proportion of total variation explained by the model decreased from 40 percent in the first period to 18 percent in the ninth and tenth periods. In the 11th period, there was a slight increase to 20 percent. This suggests that the influence on milk yield, by factors not included in the model, tended to increase as lactation progressed.
Year of calving. This had a highly significant (P<0.001) effect on four-week milk yields in all periods. The proportion of variation accounted for by year of calving ranged from 9 percent (in the ninth, tenth and 11th periods) to 16 percent (in the fourth period). Four-week milk yields in different years followed the pattern of lactation yields as described in Part 1 of this article (Mchau, 1988).
Lactation number. The effect of lactation number was very large at the beginning of the lactation, but decreased gradually as it advanced. The least squares means revealed that the main difference was between the first and all subsequent lactations. Lactation curves for first, second and third lactations separately are given in Figure 1. In the first part of the lactation, cows calving for the first time had considerably lower yields than the older cows, but this difference was reduced as lactation progressed, and in the last period the ranking was reversed.
Calving interval. This showed a highly significant association with milk yield at all stages of lactation. Again the only difference of importance was between the first (calving interval <13 months) and all the other groups. As the difference occurred even before any of the cows had conceived it could not be ascribed to the effect of the new pregnancy only. However, the difference increased considerably toward the end of lactation as shown in Figure 2.
Month of calving. The effect of month of calving was highly significant for all periods except the last, accounting for 2-3 percent of the total variation. Thus, the effect of month of calving was more apparent on four-week milk yields than on lactation yields, where it accounted for only 1 percent (P<0.05) of the total variation (Mchau, 1988).
1. Lactation curves for first, second and third lactation - Courbes de la première, de la deuxième et de la troisième lactation - Curvas de lactación pare la primera, segunda y tercera lactación
2. Lactation curves for lactations associated with short (<13 months) and long calving intervals - Courbes des lactations associées a des intervalles de vêlage courts (moins de 13 mois) et longs - Curvas de lactación pare lactaciones asociadas con intervalos cortos (13 meses) y largos entre partos
As breeding was restricted to two breeding seasons per year, most of the calving occurred during two short periods, June to July and December to January. In order to simplify the presentation, results obtained for the various calving months were combined into two classes, corresponding to calving in April to September and October to March, respectively. Within each of these two classes no significant differences between various months were found at any stage of lactation. The lactation curves for the two calving seasons are shown graphically in Figure 3. Although the lactation yields were similar in the two classes (1 519 and 1 560 kg, respectively) the distribution of the yields is quite different. Cows calving in October to March had higher yields in the first months after calving, but were lagging behind toward the end of lactation. The reason is, of course, that the most favourable season occurs at different stages of lactation in the two groups.
When all four-week records were analysed jointly according to model 2, means obtained for various stages of lactation were similar to the means presented in Table 1. However, the main purpose of this analysis was to study the seasonal variation in milk yield, when this is freed from the effect of stage of lactation. This variation is shown in Figure 4. The graph shows that the level of milk production went through a pronounced yearly cycle, with a maximum in January (period 1) and a minimum in September (period 9-10).
The coefficients of correlation between milk yields in various periods of the same lactation, and between these yields and total lactation yield, are entered in Table 3. The coefficients were computed after removal of the effects included in model 1. The coefficients of correlation between yields in adjacent periods were consistently above 0.9 except for the correlation between the two first periods. The coefficients decreased by increasing interval between the periods (toward the upper right corner of the table).
Coefficients of correlation between lactation yields and yields m various periods of lactation showed a maximum for periods in the middle of lactation and decreased toward both ends (right-hand column of Table 3).
The production level of this herd was only 20-40 percent of that-achieved in most temperate countries. However, the lactation curve was only slightly steeper than those reported elsewhere. As an example, in the data used by Auran (1973) cows produced on-average 43.9 percent of their 305-days' milk yield during the first 100 days of lactation, as compared with 46.8 percent in the present data.
The coefficient of variation in milk yield was larger at all stages of lactation in this study than in studies from temperate countries, but followed the same trend in the course of lactation, i.e. it increased as lactation proceeded.
3. Lactation curves for lactations initiated in two different seasons - Courbes de lactations commencées a deux saisons différences - Curvas de lactación pare lactaciones iniciadas en dos estaciones distintas
4. Seasonal changes in level of milk production - Variation s saisonnières du volume de la production laitière - Cambios estacionales en el volumen de producción de leche
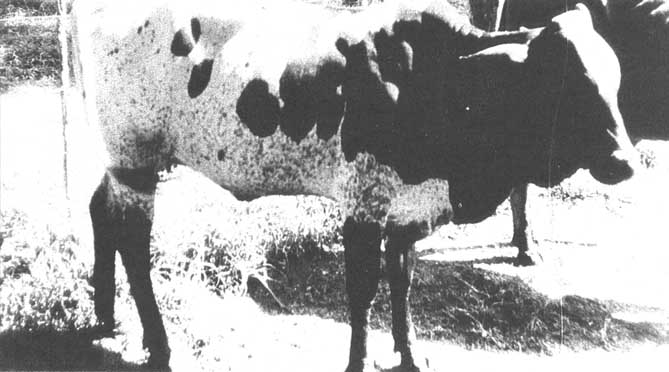
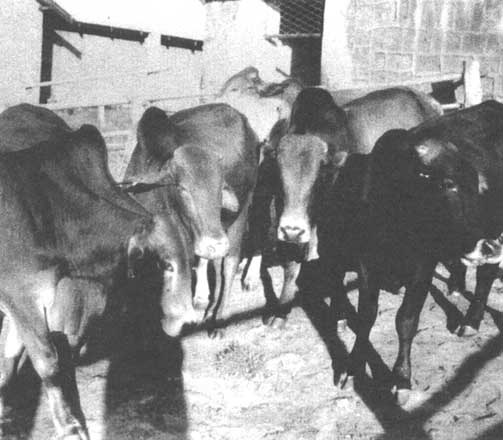
A group of young Mpwapwa bulls - Groupe de jeunes taureaux Mpwapwa - Grupo de toros Mpwapwa jóvenes
The proportion of variance accounted for by identifiable non-genetic factors decreased by advancing lactation. This was due mainly to the decreasing effect of lactation number, and it is parallel to the decrease in effect of age observed by Auran (1973) and others.
Contrary to lactation number, the effect of the length of concurrent calving interval increased as lactation advanced. This is attributed to the depressive influence which pregnancy in the late stages has on milk yield. However, milk yield in the first months of lactation is also associated with length of calving interval. The same has been found by Auran (1974) and others, and is supposed to arise because high milk yield often leads to nutritional stress, which again delays conception.
The change in level of milk production throughout the year (see Figure 4) reflects the seasonal variation in availability and quality of pasture. If supplementary feeding (hay and concentrates) had not been used, it would certainly have been even more dramatic. It emphasizes the need for improved feeding during the dry season if a reasonable level of milk production is to be maintained.
Coefficients of correlation between milk yield in various periods of lactation were slightly higher in the present data than reported elsewhere, for example (Auran, 1973). This is probably due to more precise records, as milk yield was recorded at each milking, while most other studies have been based on monthly recording. The correlation between lactation yield and yield at a particular stage of lactation was also higher than that found by other authors, but again the same pattern was found, namely very high correlations between lactation yield and yield in mid-lactation.
Auran, T. 1973. Studies on monthly and cumulative monthly milk yield records. 1. The effect of age, month of calving, herd and length of first-period. Acta Agric. Scand., 23: 189199.
Auran, T. 1974. Studies on monthly and cumulative monthly milk yield records. 2. The effect of calving interval and stage in pregnancy. Acta Agric. Scand., 24: 339-348.
Johansson, I. & Rendel, J. 1968. Genetics and animal breeding. Edinburgh and London, Oliver & Boyd.
Kramer, C.Y. 1956. Extension of multiple range tests to group means with unequal numbers of replications. Biometrics, 12: 307310.
Mchau, K.W. 1988. Production characteristics of Mpwapwa cattle. 1. Lactation yield and length. Wld Anim. Rev., 65: 11 17.
Snedecor, G.W. & Cochran, W.G. 1967. Statistical methods. Ames, The Iowa State University Press.
![]()
![]()
![]()