![]()
![]()
![]()
Population
Economic development
The economic importance of forestry in the region
Economic and social changes are key determinants of the demand for, and often the supply of, forest goods and services. Among the most important developmental parameters are population and income. Obviously, even if the per capita level of income remains constant, gross consumption capacity will increase as the number of people increases. Similarly, total consumption capacity will expand dramatically as per capita income increases. In fact, the high levels of consumption observed in wealthy nations bear witness to the frequently stronger effect of incomes compared with population in conferring capacity to consume. Both population and income are expected to rise substantially in Asia and the Pacific and will thus be key determinants of the future overall "forestry situation" in the region.
Trends and current status
Pressures on the land
Future population projections
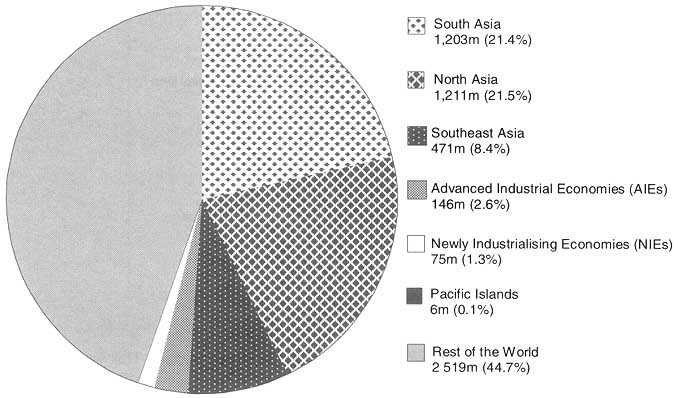
The Asia-Pacific region is home to more than 3 billion people and has, on a population basis alone, the greatest potential for consumption of forest products of any region in the world. As Figure 2.1 shows, the region included more than 55 percent of the world's total population in 1994. The region's proportionate share of the world's population has remained roughly the same over the last 35 years, although the distribution of population within the region has changed due to differences in population growth rates among the countries. Consequently, while the People's Republic of China alone accounts for nearly 39 percent of the region's population, the countries of South Asia, particularly India, Pakistan and Bangladesh have grown more quickly in the past 35 years; collectively, the population of these three countries is estimated to have overtaken that of the People's Republic of China in 1997. Relative sub-regional growth rates and other population statistics are shown in Table 2.1.
The rate of population growth has slowed in the overall region during the past 35 years from 2.5 percent per annum to 1.4 percent per annum. The Advanced Industrial Economies (AIEs) have the lowest population growth rate and this has levelled-off in recent years. Population growth in the Newly Industrialising Economies (NIEs) and North Asia (dominated by the People's Republic of China) has fallen dramatically and is now at the level experienced in AIEs about 20 years ago. Population growth has declined only slightly in the rest of the region, and in recent years has begun to increase again in the Pacific Islands.
An important demographic dimension is the impact on the age structure of the population. Large Asian countries including Indonesia, India, Malaysia, the Philippines and Viet Nam have populations with more than 50 percent of the people 25 years old or younger. More than 60 percent of the population of Bangladesh and Pakistan are 25 or under. During the next 15 years these people will likely form an increasingly heavy consumption base for forest products and services. In many countries, they will be increasingly literate, urban and sophisticated and will have different needs and tastes.
Figure 2.1: The Asia-Pacific region's share of world population, 1994
Source: FAO (1997a)
Table 2.1: Selected population statistics for the Asia-Pacific region
|
Country group |
Annual population growth rate (%) |
Land resources in 1994 (ha/capita) |
Rural population (% of total) |
Agricultural population (% of total) |
||||
|
1994 |
Trend 1962-1996 |
All land |
Agricultural land |
1994 |
Trend 1961-1996 |
1994 |
Trend 1961-1996 |
|
|
AIEs |
0.3 |
-1.1 |
5.7 |
3.3 |
21 |
-12 |
6 |
-5 |
|
NIEs |
1.0 |
-2.1 |
0.2 |
0.0 |
17 |
-50 |
11 |
-21 |
|
North Asia |
1.0 |
-1.6 |
0.9 |
0.5 |
70 |
-13 |
71 |
-3 |
|
Southeast Asia |
1.7 |
-0.9 |
0.9 |
0.2 |
67 |
-17 |
54 |
-7 |
|
South Asia |
1.8 |
-0.5 |
0.3 |
0.2 |
74 |
-10 |
58 |
-10 |
|
Pacific Islands |
2.2 |
-0.6 |
8.8 |
0.3 |
79 |
-11 |
69 |
-5 |
|
Asia-Pacific |
1.4 |
-1.1 |
0.9 |
0.5 |
68 |
-12 |
59 |
-7 |
|
World |
1.4 |
-0.7 |
2.4 |
0.9 |
55 |
-11 |
46 |
-6 |
Source: FAO(1997a).
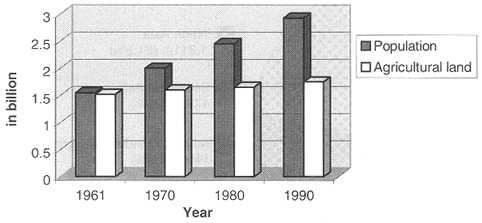
An important social dimension for forestry is the location of people and the availability of land. Large rural populations, especially if associated with low incomes, low agricultural productivity and limited land availability, are likely to put pressures on the land that will result in a persistent loss of forests. The Asia-Pacific region has several countries and areas that fit such a profile (most notably in South Asia). Conversely, high-income countries with low populations are able to reforest significant areas of agricultural and pastoral land (e.g. Australia, New Zealand). Figure 2.2 shows how agricultural land area has grown in relation to population in Asia and the Pacific since 1961. It would require further analysis to determine the relative contributions that agricultural productivity gains and food imports might have made in slowing agricultural expansion relative to population growth.
Figure 2.2: Changes in population and agricultural land area in the Asia-Pacific region
Source: FAO 1995.
In 1994 the average density of population across the region was 1.1 people per hectare. This was more than double the world average. In terms of agricultural land, the region has about 0.5 hectares per capita, slightly more than half the world average. Among those that vary markedly from the regional average: Australia, New Zealand, Mongolia, Papua New Guinea and New Caledonia are sparsely populated; Japan, Maldives and the NIEs have very high population densities.
A major proportion (68 percent) of the population in the region lives in rural areas and is largely dependent on agriculture as its main source of income. This is particularly the case in the countries of North Asia, South Asia and the Pacific Islands. The AIEs and NIEs are much more urbanised and less dependent on agriculture. There has been a marked shift from rural to urban-based societies in the NIEs during the past 35 years. The same trend is, to a lesser extent, observable in the countries of Southeast Asia. In contrast, there is very little evidence of any proportionate increase in urbanisation in the countries of South Asia or in the Pacific Islands. Among the most populous countries, the People's Republic of China, Indonesia and Japan will by 2010 have fewer rural people than now; India, Pakistan and Bangladesh will have more.
United Nations population projections (1996 revision) have been used in this study (Table 2.2). The medium fertility scenario projections (the UN's "most likely" scenario) suggest that population growth in the Asia-Pacific region will decline to just over 1 percent per annum by 2005-2010. The region's population is expected to grow by about 21 percent by 2010 to around 3.8 billion people.
The UN projections also suggest that the rural population in the region will decline in absolute numbers between 1994 and 2025. Adjusting these projections to the period of the outlook study, it is estimated that the rural population in the region will decline by 22 million by 2010, a reduction of just over 1 percent of the 1994 rural population. This small overall reduction in rural population, however, will be accompanied by the rapid growth of many urban areas in the region.
Table 2.2: United Nations population projections for the Asia-Pacific region (medium fertility)
|
Country group |
Actual and projected population(in million) |
Total increase (%) |
Rural population in 1994 |
Rural population in 2010 |
|||||
|
1994 |
2000 |
2005 |
2010 |
1994-2010 |
(in millions) |
% of total |
(in millions) |
% of total |
|
|
AIEs |
146 |
149 |
151 |
152 |
+4 |
31 |
21 |
25 |
17 |
|
NIEs |
75 |
79 |
82 |
84 |
+12 |
9 |
17 |
6 |
9 |
|
North Asia |
1,211 |
1,279 |
1,325 |
1,365 |
+13 |
848 |
70 |
763 |
56 |
|
Southeast Asia |
471 |
518 |
556 |
590 |
+25 |
317 |
67 |
315 |
53 |
|
South Asia |
1,203 |
1,336 |
1,448 |
1,557 |
+29 |
888 |
74 |
962 |
62 |
|
Pacific Islands |
6 |
7 |
8 |
8 |
+39 |
5 |
79 |
6 |
67 |
|
Asia-Pacific |
3,112 |
3,369 |
3,570 |
3,758 |
+21 |
2,099 |
68 |
2,076 |
55 |
Source: UN (1996).
Trends and current status
The foundations for economic growth
Future economic projections
Resilience of economies
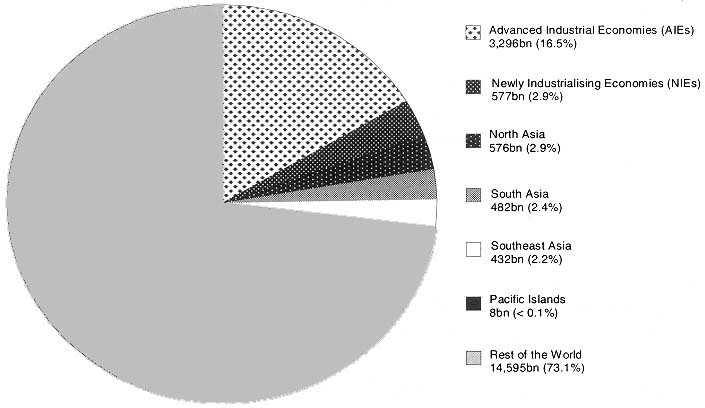
Despite having more than half the world's population, the Asia-Pacific region currently accounts for only about a quarter of the world's Gross Domestic Product (GDP) (Figure 2.3). However, the situation is a vast improvement over 40 years ago, when the region's share was less than 5 percent. This increase has been achieved as a result of an economic growth rate in the region about seven times the world average.
This dramatic growth has not been experienced everywhere in the region (Table 2.3), however, and can be attributed mainly to a handful of countries and territories (most notably, Japan, the Republic of Korea, Singapore, Indonesia, Malaysia, Thailand and the People's Republic of China). By contrast, in eight other countries of the region, half of the rural population lives below the poverty line. Across the region, however, even in less rapidly developing countries, a significant proportion of the population enjoys some prosperity. Thus, due to the size of the overall population, this translates into a major purchasing capacity in absolute terms.
Japan's economy accounted for 58 percent of the total Asia-Pacific GDP in 1995 and dominates the 64 percent share held by the AIEs. In total, the five largest economies (i.e. Japan, the People's Republic of China, India, Australia and the Republic of Korea) account for 84 percent of regional GDP.
Figure 2.3: The Asia-Pacific region's share of world GDP, 1995
Source: FAO (1997b). Note: All figures are in terms of US$ at 1987 prices and exchange rates.
Table 2.3: Trends in GDP in the Asia-Pacific region
|
Country group |
Real GDP at factor cost (in billion US$ at 1994 prices) |
GDP per capita (US$ at 1994 prices) |
Real GDP growth (average annual % growth) |
|||||
|
1980 |
1985 |
1990 |
1994 |
1994 |
1980-1984 |
1985-1989 |
1990-1994 |
|
|
AIEs |
2,770 |
3,220 |
3,756 |
4,243 |
25,000 |
3.0 |
3.0 |
3.0 |
|
NIEs |
315 |
429 |
586 |
750 |
10,000 |
6.0 |
6.0 |
6.0 |
|
North Asia |
213 |
323 |
491 |
749 |
620 |
8.0 |
8.0 |
10.0 |
|
Southeast Asia |
236 |
322 |
439 |
562 |
1,190 |
6.0 |
6.0 |
6.0 |
|
South Asia |
354 |
434 |
532 |
627 |
521 |
4.0 |
4.0 |
4.0 |
|
Pacific Islands |
8 |
8 |
9 |
10 |
1,666 |
2.0 |
2.0 |
2.0 |
|
Asia-Pacific |
3,896 |
4,736 |
5,813 |
6,941 |
2,230 |
2.4 |
2.5 |
3.0 |
Source: AsDB (1997a) and IBRD (1997).
There are a number of common threads that link the performances of the most successful economies in the Asia-Pacific region. In general, rapid growth has been the result of hard work, a high level of social discipline and targeted government policies. The principal engines for growth have been high levels of exports, private domestic investment and rapid development of quality (i.e. skilled) human capital. In part, growth has also resulted from exploitation of natural resources, effective use of cheap labour and high levels of economic protectionism.
A major factor contributing to development, particularly in East Asia, has been that governments have established a climate conducive for rapid macroeconomic growth. Other attributes of the fast-growing economies are high savings rates, low budget deficits, low rates of inflation and low levels of external debt. In absolute terms, external borrowing has been high but it was generally investment-oriented and was quickly serviced by earnings from fast-growing exports. A major contributory factor to the recent economic crisis was a slowdown in export performance which made it difficult to service debt immediately. A key driver of economic growth in the region has been the strength of the Japanese economy. In the past 30 years, Japan has provided a major intra-regional market for exports of goods produced elsewhere in Asia-Pacific. More recently, Japan has also provided a ready source of capital for investment in the region.
Other factors that have contributed to rapid economic growth in the region include sound population policies, a focus on export growth, high rates of investment in human and physical capital and pursuit of greater efficiency through improvements in factor productivity. Asia-Pacific countries have been open to foreign ideas and technology and have invested locally in technological development. Governments have also systematically intervened to ensure the development of specific high-potential industries.
The best performers have also tended (either purposefully, or as a side effect of other policies) to promote equity in income distribution. Indeed, the major social change currently influencing many of the economies of the region is the emergence of a large middle class. In addition to the roughly 80 million people in the region who can be considered extremely wealthy, a middle "class" of between 375 and 500 million people is developing. A further 750 million people are also leaving their poverty behind and beginning to have significant spending power.
Several key features have strongly influenced the rates of development in the region (Table 2.4). The clear linkages between savings and GDP growth are particularly evident. The fastest growing economies in the region in 1994 all had savings rates in excess of 34 percent. A very similar pattern (reflecting domestic capital formation) can be observed with regard to rates of investment.
The Current Account Balances of Asia-Pacific countries (Table 2.4) illustrate one of the most significant differences between the economic structures of developed Western countries and Asia. Most Asian countries have limited social welfare structures and consequently government spending comprises a smaller and less burdensome proportion of GDP. Consequently, other than the AIEs, only Hong Kong SAR, China and India ran significant current account deficits in 1994.
Table 2.4 also provides evidence of the region's dependence on trade as a vehicle for growth, particularly in the NIEs. With the exception of Japan (10 percent) and Indonesia (23 percent), exports from all of the fastest growing economies in the region exceeded 30 percent of GDP in 1994. In Hong Kong SAR, China and Singapore, the volume of trade exceeded GDP (hence the very high average value reported for the NIEs in Table 2.4). Notably, however, 70 percent of the countries in the region (for which statistics were available2) ran Balance of Trade deficits in 1994.
2 Statistics not available for Bhutan, Brunei, Korea DPR and New Caledonia.
Table 2.4: Selected macro-economic statistics for the Asia-Pacific region, 19943
|
Country group |
Savings rate |
Govt. Current Acct. Surplus |
Investment (GFCF)4 |
Exports |
Trade balance |
|
(% of GDP) |
(% of GDP) |
(% of GDP) |
(% of GDP) |
(% of GDP) |
|
|
AIEs |
28 |
-0.6 |
19 |
12 |
1 |
|
NIEs |
36 |
2.7 |
31 |
81 |
-4 |
|
North Asia |
26 |
2.5 |
32 |
22 |
1 |
|
Southeast Asia |
23 |
2.0 |
28 |
28 |
. -2 |
|
South Asia |
20 |
1.6 |
25 |
17 |
-15 |
|
Pacific Islands |
10 |
6.7 |
17 |
27 |
-35 |
|
Asia-Pacific |
24 |
2.5 |
26 |
37 |
13 |
3 The statistics presented are calculated as a "per country percentage" average for the countries in each region for which individual statistics are available. As a consequence, small countries' statistics are given disproportionate weight in sub-regional totals and, where these achieve large values, have significantly biased the statistics.4 Gross Fixed Capital Formation.
Source: AsDB (1997a), IMF (1997), and IBRD (1997).
Projections of future GDP are usually based on past trends, which are then adjusted for factors that are likely to alter the future. The estimation process can be very difficult in periods of rapid change or for countries undergoing major structural shifts. This is certainly the case in the Asia-Pacific region at the current time. Uncertainty has been starkly demonstrated by the economic turmoil that has disrupted the fastest-growing economies of the region. Box 2.1 addresses aspects of this development and its implications and a scenario examining the possible magnitudes of the impacts of this downturn is modelled in Chapter 10.
Two sets of GDP growth rates are presented in Table 2.5. The first is extrapolated from Compendium of Demographic and Macro-economic Assumptions5 produced for a forthcoming FAO study. The second set has been assumed as a broad basis for modelling a wood-products scenario in Asia-Pacific in view of the recent economic downturn.
5 FAO (1997b).
The growth rates presented in Table 2.5 for many of the developing countries in the region are relatively high and it remains questionable whether these rates are sustainable. Until recently, the best evidence suggested that the Asia-Pacific region would continue to record the very high growth rates of the past two decades, as a result of continuing aggressive investment strategies and the apparent resilience of many of the economies in the region. For example, rates of economic growth of 5 to 10 percent were maintained in many of the developing countries in the region during the entire downward cycle of the Japanese economy.
Table 2.5: GDP projections for the Asia-Pacific region
|
|
GDP forecasts (in billion US$ at 1994 prices) |
GDP Growth rate forecasts (annual percentage growth) |
||||||||
|
Base year |
FAO (1997b) |
FAO (1997b) |
APFSOS downturn scenario (1998) |
|||||||
|
1994 |
2000 |
2005 |
2010 |
1994-2000 |
2001-2005 |
2006-2010 |
1994-2000 |
2001-2005 |
2006-2010 |
|
|
North Asia |
||||||||||
|
Japan |
4,222,622 |
5,071,474 |
5,879,228 |
6,815,637 |
3.10 |
3.00 |
3.00 |
2.10 |
2.50 |
2.90 |
|
Korea DPR |
11,257 |
12,677 |
13,996 |
15,453 |
2.00 |
2.00 |
2.00 |
1.40 |
1 60 |
1.80 |
|
Mongolia |
732 |
824 |
955 |
1,107 |
2.00 |
3.00 |
3.00 |
1.90 |
270 |
3.00 |
|
The People's Republic of China |
540,492 |
862,469 |
1,226,710 |
1,744,780 |
8.10 |
7.30 |
730 |
7.00 |
6.80 |
7.10 |
|
- Hong Kong SAR, China |
130,580 |
176,999 |
231,330 |
302,339 |
5.20 |
5.50 |
5.50 |
320 |
4.40 |
5.00 |
|
- Taiwan Province of China |
241,014 |
241,014 |
241,014 |
241,014 |
|
|
|
|
|
|
|
The Republic of Korea |
380,825 |
549,445 |
745,746 |
1,012,179 |
6.30 |
6.30 |
6.30 |
2.50 |
4.00 |
570 |
|
Southeast Asia |
||||||||||
|
Brunei |
4,495 |
5,062 |
5,588 |
6,170 |
2.00 |
2.00 |
2.00 |
1.50 |
1.60 |
2.00 |
|
Cambodia |
2,376 |
3,371 |
4,511 |
6,036 |
6.00 |
6.00 |
6.00 |
3.80 |
4.80 |
5.70 |
|
Indonesia |
175,500 |
275,417 |
395,396 |
567,642 |
7.80 |
7.50 |
7.50 |
2.50 |
3.80 |
5.80 |
|
Malaysia |
74,146 |
117,661 |
170,495 |
247,052 |
8.00 |
7.70 |
7.70 |
4.40 |
5.90 |
7.30 |
|
Myanmar |
74,005 |
105,572 |
130,934 |
162,389 |
6.10 |
4.40 |
4.40 |
4.10 |
4.40 |
4.20 |
|
Laos |
1,515 |
2,030 |
2,717 |
3,635 |
5.00 |
6.00 |
6.00 |
3.30 |
4.50 |
5.50 |
|
Philippines |
64,114 |
87,403 |
113,153 |
146,490 |
5.30 |
5.30 |
5.30 |
3.10 |
4.10 |
5.20 |
|
Viet Nam |
15,478 |
21,956 |
30,081 |
41,214 |
6.00 |
6.50 |
6.50 |
4.50 |
5.20 |
630 |
|
Singapore |
69,516 |
103,741 |
141,468 |
192,915 |
6.90 |
6.40 |
6.40 |
4.70 |
5.50 |
6.20 |
|
Thailand |
143,177 |
205,410 |
288,098 |
404,072 |
6.20 |
7.00 |
7.00 |
1.70 |
3.30 |
5.20 |
|
South Asia |
||||||||||
|
Bangladesh |
26,034 |
34,888 |
47,352 |
64,269 |
5.00 |
6.30 |
6.30 |
3.60 |
510 |
5.60 |
|
Bhutan |
255 |
342 |
437 |
557 |
5.00 |
5.00 |
5.00 |
3.60 |
4.30 |
4.50 |
|
India |
272,527 |
390,982 |
523,222 |
700,189 |
6.20 |
6.00 |
6.00 |
4.80 |
5.20 |
5.20 |
|
Maldives |
241 |
342 |
457 |
612 |
6.00 |
6.00 |
6.00 |
4.70 |
5.20 |
5.20 |
|
Nepal |
3,786 |
5,103 |
6,670 |
8,717 |
5.10 |
5.50 |
5.50 |
3.90 |
4.60 |
4.70 |
|
Pakistan |
46,955 |
65,113 |
85,100 |
111,222 |
5.60 |
5.50 |
5.50 |
4.40 |
4.70 |
4.70 |
|
Sri Lanka |
11,719 |
16,436 |
22,519 |
30,854 |
5.80 |
6.50 |
6.50 |
4.40 |
5.50 |
5.80 |
|
Oceania |
||||||||||
|
Australia |
288,934 |
357,237 |
424,286 |
503,919 |
3.60 |
3.50 |
3.50 |
2.90 |
3.20 |
3.40 |
|
Cook Islands |
87 |
98 |
114 |
132 |
2.00 |
3.00 |
3.00 |
1.90 |
2,70 |
3.00 |
|
Fiji |
1,597 |
1,799 |
2,055 |
2,348 |
2.00 |
2.70 |
2.70 |
1.70 |
2.40 |
2.60 |
|
Kiribati |
38 |
43 |
47 |
52 |
2.00 |
2.00 |
2.00 |
3.20 |
3.60 |
4.00 |
|
New Caledonia |
894 |
949 |
1,022 |
1,101 |
1.00 |
1.50 |
1.50 |
1.0 |
1.40 |
1.50 |
|
New Zealand |
44,290 |
51,967 |
59,662 |
68,495 |
2.70 |
2.80 |
2.80 |
2.00 |
2.40 |
2.80 |
|
Papua New Guinea |
6,994 |
7,830 |
8,773 |
9,830 |
1.90 |
2.30 |
2.30 |
1.30 |
2.00 |
210 |
|
Samoa |
127 |
139 |
149 |
161 |
1.50 |
1.50 |
1.50 |
1.50 |
1.50 |
1 50 |
|
Solomon Islands |
186 |
249 |
326 |
426 |
5.00 |
5.50 |
5.50 |
3.90 |
4.80 |
5.30 |
|
Tonga |
135 |
161 |
192 |
227 |
3.00 |
3.50 |
3.50 |
2.90 |
3.30 |
3.50 |
|
Vanuatu |
193 |
211 |
233 |
258 |
1.50 |
2.00 |
2.00 |
1.20 |
1.80 |
2.00 |
More recently, however, the region has undergone a major economic correction. hi the past year, the major Asian stock indices have declined by 10 to 50 percent. The currencies of several NIEs and Southeast Asian countries have been battered, leaving East Asian economies with little liquidity. Consequently, very few new investments are being made and demand for consumer goods, including forest products, is muted. In the short run, growth in the worst-affected economies (i.e. the Republic of Korea, Thailand and Indonesia) is likely to stagnate or even reverse slightly while awaiting a recovery that is likely to be led by more competitive export prices and investment from offshore.
|
Box 2.1: POSSIBLE IMPACTS OF THE RECENT ASIAN ECONOMIC DECLINE The recent Asian economic crisis is already having impacts on the industrial forestry sectors in most countries of the region. The most important but difficult challenge is to predict the speed at which the region will bounce back from this upset. At the January 1998 World Economic Forum in Davos, there was talk of a five-year period being required for full recovery but, significantly, there was also conviction that Asia can regain its dynamism. The immediate prospects for the forestry sectors in the region are gloomy. The enormous destruction of financial capital tied up in Asian sharemarkets and associated rapid depreciation in currency exchange rates has left many commercial and financial institutions in Asia with severe liquidity problems while personal consumers' finances and confidence have also suffered markedly. In the worst affected economies (i.e. the Republic of Korea, Indonesia, Thailand, Malaysia, the Philippines, and Japan), demand for all forest products will undoubtedly be curtailed. Commercial and housing construction projects are being deferred, and production of consumer goods (and hence demand for packaging materials) has declined. Currency devaluations so far have largely failed to stimulate exports because the main markets within Asia-Pacific have also devalued and there are lingering difficulties in financing export contracts. As a consequence, countries less directly involved in the crisis, including Australia, New Zealand, Papua New Guinea, Fiji, Solomon Islands, Cambodia, Myanmar, and Laos, will be adversely affected through their trade balances. Some anecdotal evidence on impacts follows: · According to the Indonesian Plywood Association (APKINDO), 1997 exports of Indonesian wood panels are expected to have totalled about 8 million cubic metres, a decline of about half a million cubic metres from 1996 levels; further declines are expected in 1998. · In Papua New Guinea, the Forest Industry Association estimates that 30 percent of the industry's capacity is shut down and 1997 log exports are likely to have been at least 12 percent below 1996 levels. It is estimated that there are currently 350,000 cubic metres of unsold logs in stock in Papua New Guinea; several logging operators have suspended all felling operations. · In the Solomon Islands, log markets have been stagnant, even at substantially reduced prices; several logging companies have suspended felling operations. While previously more than 50 percent of Sarawak's lumber exports went to Thailand and the Philippines, most Thai importers have stopped buying lumber from Sarawak; exports from Sarawak to the Philippines have also fallen by half. Some dramatic changes in the policies and conditions affecting the region's forests are already being initiated. For example, the Indonesian Government has agreed to conditions with the IMF that include: reducing export taxes on logs and rattan to a maximum of 10 percent by March 1998; previously, very high export taxes made it almost impossible to legally export unprocessed logs or rattan; · eliminating APKINDO's monopoly over plywood exports; · transferring control over all government-owned commercial forestry companies from the Ministry of Forestry to the Ministry of Finance; · reducing land conversion targets to environmentally sustainable levels and implementing a system of performance bonds for forest concessions by the end of 1998; and · establishing new resource rent taxes on timber resources, including increased timber stumpage fees and a new auction system to allocate concessions. In the long run these measures should contribute to the Indonesian forestry sector being both more economically efficient and environmentally friendly. In the near term, however, rapid implementation of such a major structural adjustment package seems likely to further disrupt operating conditions for an already burdened sector. On the regional plane, the longer term effects on forestry are less clear and are largely dependent on how long the downturn persists and how widespread its effects eventually become. Partly this will depend on how long the dislocation will continue and how deep it will remain. One viewpoint regarding long-term effects on forestry suggests the crisis will probably have a greater impact on the region's forest than any other event during the last 15 years. The exodus of jobless urban workers could, if they returned in a major tide to the rural areas, have an impact on forest loss and degradation but it is too early to speculate on the magnitude of the exodus itself or on its impacts. Sources: Various; anecdotes excerpted from issues of the ITTO Tropical Timber Market Information Bulletin and reprinted in Forest News, Vol. XI, No. 4, FAO, Bangkok. |
In the longer run, there seems little reason to doubt the region will return to rapid growth trajectories although the very high historical rates may no longer be achievable. Notwithstanding the current slowdown, the region's economic prospects in the medium term are optimistic in view of expected healthy expansion of global and inter-regional trade in an environment of increasing post-Uruguay Round liberalisation and commitment to regional and Pacific Basin economic agreements. World Bank simulations of "boom-bust" cycles suggest that Asia is very resilient to adversity. Southeast Asia and South Asia demonstrate the most resilience, due to their relatively low reliance on primary commodities, the competitiveness of their manufactured exports, growing intra-regional trade, low debt and likely continued access to external financing (due to a good borrowing record). Consequently, provided the Asian recession does not spread substantively to the rest of the world and that it does not destroy significant production potential, the major Asian economies should resume their previously impressive growth paths around the turn of the century.
A major factor relevant to the resilience of the fast-growing economies is their particular dependence on exports. Exports have been the engine for growth but also leave these economies highly exposed to the vagaries of external demand for products.
The economic importance of a country's forests is reflected in the contribution of the forest sector to GDP and the volume of production and trade in forest products. Rough estimates suggest that the average contribution to GDP of the forestry sector in the Asia-Pacific region (as well as its share in international merchandise trade) is about 2 percent. There are, however, a few countries in the region where the share is 10 percent or higher. Table 2.6 lists the countries for which forestry is a major economic sector. Box 2.2 provides information on the importance of forest products among the exports of Laos.
Within the region, Indonesia and Malaysia are the largest exporters of forest products. Together these countries account for 6.4 percent (in value terms) of total world exports. The value of forest product exports from the region increased from about US$1.4 billion in 1970 to US$19.7 billion in 1995, with wood-based panels the largest contributing product. The region as a whole, however, is a net importer of forest products, the value of imports in 1995 being US$44.1 billion. Japan, the Republic of Korea and the People's Republic of China are the largest importers, accounting for 23.5 percent (in value terms) of total world imports of forest products.
Table 2.6: The share of forestry in GDP and trade in selected Asia-Pacific countries
|
Gross Domestic Product (GDP) |
Merchandise trade | ||
|
Country |
Forestry share(%) |
Country |
Forestry share(%) |
|
Bhutan |
22 |
Cambodia |
43 |
|
Solomon Islands |
16 |
Solomon Islands |
42 |
|
Laos |
15 |
Myanmar |
35 |
|
Papua New Guinea |
11 |
Laos |
21 |
|
Indonesia |
10 |
Fiji |
13 |
|
Malaysia |
10 |
Indonesia |
12 |
|
|
|
Bhutan |
11 |
|
|
|
New Zealand |
10 |
Source: FAO (19970.
|
Box 2.2: FOREST PRODUCTS EXPORTS OF LAOS The forestry sector is one of the main sources of export revenue for the government of Laos. Forest product exports, as a share of total exports, have progressively increased from about 10 percent in 1985 to between 30 and 45 percent during the 1990s. In 1996, the share grew to about 40 percent. The most important export product is sawnwood, followed by logs, stumps and knobs, parquet and plywood. In principle, there is a ban on the export of logs, but due to technical "loopholes" some logs (mainly Pinus merkusii) are still being exported. An interesting feature from the viewpoint of sustainable forest management is that the main source for log exports is "salvage" of material from infrastructure clearance sites such as dam construction areas. Due to the opportunistic nature of such "harvest", the volume and value of annual log exports varies greatly. Source: Summary of the Country Outlook - Laos: Document APFSOS/WP/38. |
![]()
![]()
![]()