![]()
![]()
![]()
Introduction and overview
Services of forests
Non-wood forest products
Woodfuels and energy
Industrial wood products
The demands placed on the forests of Asia and the Pacific are intense, and are steadily increasing in complexity and scope. No longer can the forests be viewed simply as a source of material goods for local people or perhaps as a supplier of industrial wood. The forests have become focal points for local, national, regional and global interests -interests that often compete with each other and are often incompatible.
As populations have increased and people have become wealthier, perceptions of the forests have changed considerably. People are demanding more and more from the region's forests. Seldom are old demands relaxed; rather, new demands are simply added to the list of needs and expectations people have of the forests.
Services provided by forests, which include many vital life-supporting roles, have gained particular attention in recent years. Foremost among these is the maintenance and enhancement of quality water supplies, which has long been recognised as a key contribution of forests. Of more recent recognition are demands for forests to serve as repositories of biological diversity, to store carbon and to provide recreational and educational opportunities for tourists. Services of forests tend to be intangible, or in any case difficult to quantify. They are important, but in the absence of easy measures of their worth, they tend to be publicised less than they deserve.
For centuries, rural people in Asia and the Pacific depended on forests for a wide array of non-wood forest products (NWFPs). Increasing attention is now being focused on the potential of NWFPs and services to provide alternative or complementary sources of income to timber harvesting. A major constraint on development, however, is the lack of knowledge relating to the effective utilisation, management and marketing of these products and services. Nonetheless, Asia-Pacific countries already lead the world in the production and trade of a number of NWFPs including bamboo, rattan, pine oleoresins, lac, natural silk, medicinal plants, bidi leaves, forest-derived spices and chestnuts. NWFPs comprise a significant proportion of total forest exports from some countries. In India, for example, more than 70 percent of all forest-based exports are NWFPs.
Demands for fuelwood are exceedingly high in Asia and the Pacific. Although it is now known that much of the woodfuel consumed in the region comes from non-forest sources, forests remain a major source of energy in rural areas. Considerable investment is also made by rural people to grow and collect woodfuels outside forests. India, the People's Republic of China and Indonesia account for 70 percent of the region's total consumption of woodfuels, with India alone consuming 30 percent of production. However, on a per capita basis, resource-rich Indonesia consumes an average of 0.76 cubic metres of fuelwood per person per year, compared with India's 0.29 cubic metres per capita and the People's Republic of China's 0.17 cubic metres. By contrast, Japan, as a developed nation, consumes a negligible 0.005 cubic metres per capita per year.
The Asia-Pacific region produced almost 1.2 billion cubic metres of roundwood in 1995, constituting about one-third of global wood production. The bulk of this production, slightly more than 75 percent, was utilised as fuelwood. The industrial wood harvest totalled 275 million cubic metres, or slightly less than 19 percent of global industrial wood production.
In a global context, the Asia-Pacific region has made a number of impressive changes in consumption. The growth of consumption of forest products in Asia-Pacific has transformed the global balance. For example, the Asia-Pacific region has moved from consuming 15 percent of world industrial roundwood in 1970 to 21 percent now (equal to consumption of Europe). Similar shifts have occurred for other commodities. For example, the region presently consumes 32 percent of world paper and paperboard production.
With more than half of the world's population, it is not surprising that the Asia-Pacific is a significant wood-deficit region. Net imports of wood products to the region were valued at US$24 billion in 1994. It is worth noting, however, that it is the level of "developedness," rather than population, that contributes to Asia-Pacific being a net-importing region. Japan alone, for instance, runs a forest products trade deficit of US$18 billion, while Singapore, the Republic of Korea, Thailand, the People's Republic of China and Hong Kong SAR, China are the other major importers.
In assessing generalised statistics of the Asia-Pacific region as a whole, the overwhelming dominance of a few countries in production, consumption and trade is readily apparent. The region contains six of the world's ten most populous countries (the People's Republic of China, India, Indonesia, Pakistan, Japan and Bangladesh) and three of the world's six largest wood producers (the People's Republic of China, India and Indonesia). These latter three countries account for 68 percent of wood production in the region. However, among these largest countries there is an enormous amount of heterogeneity in wood utilisation.
In the production of industrial wood, the People's Republic of China dominates the Asia-Pacific region, producing 32 percent of the total. Six other countries (Indonesia, Malaysia, Japan, India, Australia and New Zealand) produce more than 15 million cubic metres annually. Together, these seven countries account for 91 percent of industrial roundwood production in the region.
In terms of trade, the same seven countries play major roles in the region. Total trade in the region, both intra-regional and inter-regional, amounted to US$63 billion in 1995. The seven major wood producing countries, along with Singapore, Thailand and Hong Kong SAR, China accounted for 95 percent of all trade. On the importing side, Japan alone accounted for 44 percent of all imports in the region. Japan, the People's Republic of China and its territories, and the Republic of Korea together accounted for 78 percent of all imports. On the exporting side, Indonesia and Malaysia are responsible for 46 percent of forestry exports. These two countries, along with Japan, New Zealand and the Republic of Korea account for 70 percent of all exports.
Types of services of forests
Socio-cultural roles and nature-based ecotourism
Agricultural services of forests and trees
Watershed services of forests
Carbon sequestration
Conservation of wildlife habitats and biological diversity values
Services of mangrove ecosystems
A setting for the future
Forests provide a vast range of beneficial non-extractive services alongside wood and non-wood forest products. What distinguishes services is that their value comes from performing particular roles rather than producing physical goods. Services cover a wide range of ecological, economic, social and cultural considerations and processes. This diversity means management solutions are necessarily more complex when service considerations are incorporated in decision-making.
Services of forests can be categorised into two broad types: (a) those for which a formal market exists or could be developed (e.g. clean water, grazing, ecotourism, recreation, hunting and gathering); and (b) those functions that are largely intangible and not sold through markets (e.g. cultural and spiritual values, influences on climate, erosion control and biological diversity conservation). This second type of services might be better classified as forest externalities; that is, services of forests that deliver a welfare benefit but are not fully accounted for in price and market systems. Recently, progress has been made to price and sell several forest services that were largely non-marketed in the past. For example, the carbon sequestration and storage functions of forests are becoming more "marketable" under new international agreements.6 Similarly, forest genetic resources, and the associated functions of biological diversity conservation, are increasingly being valued and marketed.
6 Under Article 6 of the Kyoto Protocol to the UN Framework Convention on Climate Change, trading in carbon functions among countries may soon be formalized and a significant market could thus develop, thus making this ecological function also an economic/financial one.
Services of forests can also be categorised according to whether they primarily serve an economic, ecological, socio-cultural or aesthetic function. These categories are not exhaustive, nor are they mutually exclusive or discrete.
Most forests have the potential to provide many of the vast range of services of forests. Particular forest types will, however, provide enhanced levels of specific services over others. For example, a virgin stand of dipterocarp forest in Malaysia may have greater ecotourism potential than a mangrove forest in Australia. Conversely, the mangrove forest is likely to provide better coastal protection service. It is consequently very difficult to generalise about the value of services of forests.
Studies around the world have estimated the value of nutrient cycling, climate regulation, erosion control and other services at more than 60 percent of the total "average" value of forests. However, such very high valuations of services of forests largely lack credibility in practice since it is not currently possible to capitalise the value of most ecological functions (i.e. since they are mostly non-transacted externalities, there are no market indicators of "reasonable" values for them).
For forest-dependent communities in the Asia-Pacific, the more urgent interest is in developing financially viable services that can provide alternative sources of revenue to excessive harvesting or clearing of forests. While the intrinsic economic value of these more viable services may be less (on average) than for ecological services, their marketability gives potential for immediate financial gain and this can be a powerful incentive for promoting conservation. In wealthier countries, the inability to capture forest values in financial terms may not necessarily deter governments from subsidising forestry for the purpose of generating intangible benefits. Japan, for example, provides a wide range of subsidies7 for silviculture aimed at protecting land and conserving water resources, creating a "healthy living environment," establishing recreational opportunities, forming "natural environments," and promoting the economies of mountain communities. Subsidies range from 30 to 50 percent of costs, are long-term and cover all activities that contribute to the public good rather than private gain.
7 Japan Forestry Agency, Japan International Cooperation Agency (JICA) & Japan Overseas Forestry Consultants Association (JOFCA) (1996): Silvicultural subsidy and loan system in Japan. Doc TIH-JR-96-232 (8).
Forests often play important cultural roles in Asia and the Pacific. Maintaining forests or trees in traditional burial grounds is common in most countries in the region, for example. In a few countries, specific provision is made in government-protected forests for cultural functions. For example, Nepal has designated religious forests and Sri Lanka has protected forest areas around temples. In these cases, the cultural functions of the forest are a major factor favouring conservation.
A more modern, and rapidly growing, social function of forests is serving as destinations for ecotourism and recreation. Ecotourism is still a relatively small component of the world's huge travel and tourism industry, but it already generates significant incomes for many countries. Ecotourism can create and capitalise on a symbiotic relationship between tourism and the environment. It provides an economic incentive to protect natural resources such as forests, wildlife, scenery and waterways. It also offers jobs and the potential for economic advancement to residents of impoverished rural communities.
A few key trends highlight the prospects for ecotourism to contribute to forest conservation in the Asia-Pacific region. They are notably:
· tourism in general already makes a substantial contribution to the region's economy;88 N. Byron (CIFOR, Personal communication, December 1997) reports, however, that the net benefits of tourism in general and ecotourism in particular may not necessarily be positive. Research in the South Pacific on the differential contributions of say "Back-packer" through to "5-star resort" tourism suggests that the net returns to the country from backpackers was actually higher - even though they spent less. This is because very little of what they consumed was imported, and me differential between gross expenditures and the cost of supplying/servicing them, was actually higher (i.e. more value added). The "five-star" tourism had virtually zero, sometimes negative value added.· tourism has grown rapidly in the region (especially in Australia, New Zealand and the Pacific Islands), and this growth is expected to continue;
· ecotourism in the region and globally has grown faster than tourism generally, and this probably will continue over the next several years;
· domestic and intra-regional visitors are an important component of the region's ecotourism, and this importance is expected to increase in the future; and
· ecotourism demand will evolve over time, and the region's ecotourism sites will need to adapt to these changes.
There has been much discussion and debate regarding the size and growth of the Asia-Pacific ecotourism market. Estimates of market size depend on the definition used to describe ecotourism (Box 3.1). Assuming, however, that the Asia-Pacific region follows the global pattern, then around 7 percent9 of the region's international tourism might be viewed as ecotourism with several countries exhibiting a higher proportion (Box 3.2); an equivalent estimate is not yet possible for domestic tourism. The current value of the Asia-Pacific ecotourism market could, therefore, be estimated at around US$6 billion annually, of which only a limited proportion would accrue to forest owners.
9 Lindberg et al. (1997).
|
Box 3.1: DEFINING ECOTOURISM The Ecotourism Association of Australia defines "Ecotourism" as being "... ecologically sustainable tourism that fosters environmental and cultural understanding, appreciation and conservation." The same country's Office of National Tourism defines it as".... nature-based tourism that involves interpretation of the natural and cultural environment and ecologically sustainable management of natural areas." |
|
Box 3.2: ECOTOURISM PRESSURES ON FORESTS Tourists tend to flock to the same destinations, so that only a few countries receive most visitors and, within countries, a few sites are crowded or have their carrying capacity exceeded. Information is scarce on whether this is a significant problem yet in the region but it is something to monitor closely in ecotourism as it can undermine the very "nature appeal" which provides the initial attraction. Some of the pressures can arise from demand for basic natural resource needs such as fuelwood. For example, in the Khumbu region of Nepal, tourists trekking to Mount Everest have placed excessive pressure on the forest resources. As a consequence, the rhododendron alpine forests around Namche Bazar are heavily degraded, having been overcut by villagers for cooking, heating and warming water for tourists' showers and baths. |
The best estimates of the growth of ecotourism in the Asia-Pacific region suggest recent growth is about 10 to 25 percent annually, with potential for even higher growth in coming years. Despite these projections, it is far from clear that the market is sufficiently large, or that it is linked closely enough to forests, to ensure the conservation of more than a few areas with exceptional tourism values. The best prospects appear to be those forest areas that are set aside in national parks or other protected areas, thereby creating a highly visible ecotourism destination.
Experiences in Australia (Box 3.3) and Indonesia (Box 3.4) illustrate some contrasts and similarities in the evolution of ecotourism development in the region. A common concern is the degree to which revenues from ecotourism accrue to local communities. In Indonesia and elsewhere, there is concern that the local benefits from ecotourism may be minimal after the costs of imported inputs and services are taken into account.
|
Box 3.3: CASE STUDY - FOREST-BASED ECOTOURISM IN AUSTRALIA The Australian Office of National Tourism (1997) reports foreign exchange earnings for all tourism of A$ 13.1 billion (US$10 billion) in 1995. This figure is projected to increase to A$21 billion by the year 2000. The industry accounts for some 500,000 jobs, or around 6.6 percent of Australia's workforce. Ecotourism alone (not all of which is forest-based) employed some 6,500 people (equivalent to 4,500 full-time jobs) and had a turnover of about A$250 million in 1995; there were then estimated to be approximately 600 ecotourism operators. Domestic interest in ecotourism is strong. In a 1995 survey, 53.2 percent of those interviewed about holiday plans intended to visit a natural attraction or national park to enjoy nature during their next holiday. Visits to national parks have generally increased since the early 1990s - in some parks the number of visits has increased substantially, at over 10 percent per annum. Australia's appeal gains much from images of nature, including its forests and bushland. Australia has established a National Ecotourism Strategy and funding has been allocated for ecotourism infrastructure development, environmental management, and other projects through the Forest Ecotourism Programme and the National Ecotourism Programme. In addition, various tourism and land management agencies within state governments have undertaken ecotourism evaluations and/or have developed ecotourism strategies. The Ecotourism Association of Australia (EAA) has members from the industry, government, universities and other groups. To promote standards, an industry-based National Ecotourism Accreditation Programme (NEAP) has been created. The Association also has a Code of Practice for Ecotourism Operators to foster best practices. Since government now only partially funds natural area management and funding may well decrease rather than increase, there is a trend toward "user pays" systems. There is also a greater role for the private sector. For example, the state of Victoria recently corporatised its service delivery functions, while the state of Queensland is pursuing private sector management of park visitation. There is some concern that the private sector will be less attentive than public agencies to conservation objectives. Source: Adapted from Lindberg et al. (1997). Ecotourism And Other Services Derived From Forests In The Asia-Pacific Region: Outlook To 201 a Document APFSOS/WP/24. Country Report - Australia: Document APFSOS/WP/13. Leaflets of the Ecotourism Association of Australia. |
|
Box 3.4: CASE STUDY - STATE OF ECOTOURISM IN INDONESIA International visitor arrivals in Indonesia have increased by more than 400 percent over the decade 1985 to 1994, with arrivals in 1994 totalling over 4 million people. Tourism receipts in 1995 totalled US$5.2 billion, of which ecotourism receipts can be estimated at more than US$350 million. Continued growth in both arrivals and receipts is expected. The primary beneficiaries of these earnings are, however, airlines, tour companies and hoteliers. Little money is paid directly to local communities and even less is collected by forest managers. Tourism policies in Indonesia's current 5-year plan include: tourism to support quality of life improvements; encouraging development in remote areas; and promoting the preservation of natural resources and culture. Goals for nature tourism are: · to encourage conservation efforts at nature-oriented tourist sites and the surrounding environment to ensure the sustainability of site attractions; · to optimally use the typical and unique potential of each site as tourist attractions; · to promote employment in addition to business opportunities; and · to advance national cultural values in the international community and to counter current negative impressions about tropical forest management in Indonesia. The 1990s have seen increased development of Indonesia's national parks for tourism, with almost all parks now providing at least basic tourist facilities, and with substantial investment in some parks. Thirty percent of park revenues go to the province where the park is located, but none of the revenue is retained by the parks to support management or facility development. Some businesses and other groups within the country have embraced ecotourism principles but despite recent development of Indonesian natural areas, attention appears focused on traditional concepts of tourism, rather than ecotourism. The first national community-based ecotourism workshop was held in 1995 and a second workshop, held in Bali in July 1996, resulted in the "Bali Declaration for Ecotourism" and an agreement to form the Indonesian Ecotourism Society in order to: · increase awareness to conserve the natural tourism resources in Indonesia; · develop environmental education materials for tourists that visit ecotourism destinations; and · stress the need for local community benefits. Source: Lindberg et al. (1997). Ecotourism and Other Services Derived From Forests In The Asia-Pacific Region: Outlook To 2010: Document APFSOS/WP/24. FAO, Rome/Bangkok. |
The positive interactions between forests and agriculture mark a major non-marketed benefit that trees and forests make to human welfare. At the most basic level, forests provide a restorative service for agriculture, most clearly evident in shifting cultivation. Both within and outside swidden-cultivation systems, forests' support of agriculture is well known: replenishing degraded land, recycling nutrients, maintaining and rehabilitating soil structure, contributing to the water cycle and regulation of water, protecting watersheds, providing shade and shelter. Windbreaks are another important service in specific situations (Box 3.5).
One of the most prominent agriculture-related forest services is grazing (Box 3.6). In many developing countries, 30 to 40 percent of domestic animals rely on forests for some or all of their grazing and fodder. The value of this fodder is estimated to be US$40 to US$50 billion annually, hi India alone, the value is estimated at US$12 billion annually. Forest grazing is generally carried out under traditional access rights and fees are rarely levied. Consequently overgrazing is common, particularly in heavily populated rural areas. Integrating grazing and other agricultural support functions of forests into market systems could be possible in some areas, but it would impose significant hardship on many traditional grazing communities.
|
Box 3.5: TREES FOR PROTECTION OF FARMLANDS The Chinese government gives high priority to land protection by trees and forests. The aim is to maintain or regain productivity of threatened agricultural lands or to prevent degradation of threatened lands. By 1994, over 13 million hectares of land had been afforested under the Three-North Shelterbelt Development Programme, some 5 million hectares under the Shelterbelt Development Programme along the Upper and Middle reaches of the Yangtze River, 15,000 kilometres of framework shelterbelts under the Coastal Shelterbelt Development Programme, and pilot areas under the Taihang Mountains Afforestation Programme. Under a major Plains Farmland Shelterbelt Development Programme, over 80 percent of the plain farmland suitable for shelterbelts has been protected; some 10 percent of the desertified land is under control; large areas of degraded grassland were rehabilitated and protected; and sand and/or wind-prone, low-yielding farmland was protected. Well over a million hectares of desert have already been reclaimed for fanning. It is estimated that of the 63 million hectares of plantable wasteland existing in the People's Republic of China, much can be used to produce food and oils from woody plants if adequate protective plant cover is established. Source: Adapted from Shi Kunshan et al. (1977): Document APFSOS/WP/14. |
|
Box 3.6: INDIA - WHICH WAY FOREST FODDER? India is often cited for the deliberate attention forestry authorities have given to fodder as an important contribution of trees and forests. As of 1995, forest grazing occurred in 78 percent of India's inventoried forests; high- and medium-intensity grazing occurred in half of these forests. Currently, the numbers of all types of livestock are increasing in India, especially the numbers of small ruminants. As the consumption of meat accelerates with increased prosperity, this trend will likely continue, further raising the demand for fodder. Yet the production of crop residues, which used to be a mainstay complement to natural pasture, is growing more slowly, particularly since the introduction of hybrid crops which produce less straw and other residues. Consequently, shortages of fodder for farm animals have become more serious and pressures on forests for grazing are likely to increase. It is estimated that currently 40 percent of cattle have access to forests for grazing and the grazing intensity is estimated at 4.1 cattle per hectare. This density is expected to rise to 5.6 cattle per hectare by 2010. Source: Ahmed, M. F. (1997). In-depth country study - India: Document APFSOS/WP/26. FAO, Rome/Bangkok. |
Forests contribute to watershed quality by stabilising on-site soil, reducing off-site sedimentation, reducing flood peaks on streams in small watersheds and replenishing groundwater and watercourses. These ecological stabilisation functions of forests also contribute to orderly management of hydropower and irrigation schemes (including delaying silting up of the costly infrastructure). Although large, the values of watershed protection do not enjoy a high profile and are mainly evident in retrospect, after a watershed forest becomes degraded.
A serious obstacle in valuing watershed protection arises because most of the benefits are realised by downstream communities while the costs of protection are incurred by watershed residents or owners. In Japan, the Republic of Korea and New Zealand, pilot programmes are pioneering mechanisms by which upland watershed communities and private landowners are compensated for watershed protection by downstream beneficiaries (Box 3.7).
|
Box 3.7: JAPAN - BENEFICIARY COMPENSATION FOR UPSTREAM WATER PROTECTION Japan's landscape is dominated by mountains, which occupy some 70 percent of the land. It has twice as much rainfall as the world average and often faces disasters such as floods and landslides. Forests play an indispensable role in safeguarding human life and property against those natural disasters as well as in conserving soil and water resources. · There are, however, many forests in Japan that are not well enough maintained to effectively perform such roles. In order to improve this situation some unique schemes have been developed by municipal governments that attempt to promote forest management not only through the efforts of forest owners but also by a wide spectrum of people, especially those in urban areas. Some examples of funding contributions (beneficiary compensation) from urban people are: · In 1994, a "City Headwater Conservation Fund" was set up in Toyota city with the aim of supporting forest management in upstream villages in the river basin to secure the quality of water resources. One yen per cubic metre of water used is being set aside from city water revenues for this purpose. In 1997, Kanagawa prefectural government, in the vicinity of Tokyo, decided that one percent of annual revenue (around 50 billion yen) from the prefectural water supply will be used to cover part of the project budget that assists private forest owners in the prefecture. Several other similar programmes have been implemented elsewhere. Source: H. Ishihara (Personal communication, 1987). |
Compensating upstream dwellers for the costs of watershed protection is difficult enough within a country. It becomes even more difficult when a watershed straddles international borders. For example, upstream management of the Brahmaputra, Ganges, Indus and Mekong rivers, all of which have their headwaters in the People's Republic of China, significantly affects life in Pakistan, India, Bangladesh and Viet Nam (Box 3.8). Such sharing of water resources has become a significant source of political tension, particularly in South Asia.
|
Box 3.8: FORESTRY AND SUSTAINABLE MANAGEMENT OF KEY HIMALAYA WATERSHEDS Importance: Six of the world's leading rivers, the Indus, Ganges, Brahmaputra, Mekong, Yangtze, and Yellow Rivers, originate in the Himalayas. These rivers are essential for some of the world's largest irrigation schemes and hydroelectric works. For example, in an area of very high rainfall variability, the Indus provides 120 billion cubic metres of water per year for one of the world's biggest areas of irrigated agriculture. The Ganges also supports agriculture but its considerable potential for hydropower is undermined by danger of seismic activities. The Brahmaputra is the lifeline of Bangladeshi agriculture and has potential for hydropower. The Yangtze, with more than 40,000 small and some large reservoirs, supports irrigation and power generation including the Three Gorges Project, one of the world's largest infrastructure projects. Main attributes: The six watersheds differ in steepness, population densities, and rainfall. For example, the Ganges, Yangtze and Mekong are dominated by elevations below 1,000 metres, while more than 50 percent of the Brahmaputra watershed is above 3,300 metres; the Indus has significant areas of both upland and lowland. Population densities range from 6 people per square kilometre in Tibet Autonomous Region of China to over 3,000 people in parts of northeast India. The monsoon-based rainfall tends to be intense and highly erosive so that forests or other good ground coverage are critical. All six rivers, but particularly the Yellow, carry very high sediment loads (all six rank within the 12 highest in the world); although a large portion of the sediment results from natural rather than man-made processes. Sediments may provide fertile lowland soils but raising of riverbeds increases flooding and damage to infrastructure and affects lives and livelihoods of millions of people. Erosion also adversely affects hydropower and irrigation by quickly silting up dams and canals. Forests: In the six watersheds, half the land is used for agriculture, a third for range and only an average of 12 percent is under forest. Forest cover is particularly low in the Indus where only 0.5 percent of the land is forested. Elsewhere forest cover is 2.9 percent (Yellow); 8.2 percent (Ganges); 8.5 percent (Yangtze); 14.5 percent (Brahmaputra); and 44.0 percent (Mekong). In general, most forest is at altitudes between 1,000 and 2,100 metres. The treeline generally ends below 2,100 metres and below 1,000 metres agriculture takes precedence and land pressures allow only trees in farming systems. The potential to increase forest area thus appears relatively small. Observations suggest that the condition of forests, rather than merely forest area, determines how successful they are in controlling erosion and other watershed degradation. A broad-leaved forest without litter can in fact cause more surface erosion than bare land due to size and intensity of raindrops. However, the presence of trees, through their root systems, can give a margin of safety in shallow landslips. It also appears that, on a large scale, the role of forests in reducing downstream flooding has usually been overestimated. Data show no discernible correlation between overall extent of forest cover in a watershed and a river's sediment load due to the overwhelming influence of natural stream-bank erosion and landslides. Future forest interventions might then seek to enhance forest effectiveness in combating flooding and watershed degradation through appropriate quality of forests and their proper location, as well as pursuing complementary non-forest interventions. Challenges and priorities for action: There are a number of important natural and man-induced challenges relating to forest roles in watersheds: · Co-operation in managing international watersheds and rivers: of the six rivers, all originating in the People's Republic of China, the Indus, Ganges, Brahmaputra, and Mekong are international. Water sharing is often the source of political tensions. New methods have to be devised to ensure that adequate quality water remains available in perpetuity for both upstream and downstream societies and economies. This might include the payment by downstream economies for upstream conservation measures so that irrigation and hydroelectric infrastructure development downstream can proceed and no unnecessary level of sacrifice is required of those upstream. Where large rivers cross international boundaries this will call for co-operation in sharing benefits and costs. · Environmentally most fragile altitudes: except for the Yellow River area, the zone between 1,000 and 3,000 metres is most fragile due to high intensity rainfall and steep slopes with slip-prone soils. Forest cover is also highest at this elevation and this provides a base on which to build forest-centred erosion strategies. · Conservation of riverine forests: given that gross forest area may not be critical for water quality and other protection, focus could be on riverine forests. This strategy could lead to conflict with residents as riversides are popular for gardening wherever steepness is not excessive. · Conservation of rich and varied or unique bio-resources and natural habitats: this challenge is best illustrated by the situation on the Brahmaputra. This watershed has unique biological diversity caused by the distinct vertical profile of forest in the Himalayan part of the watershed.10 10 The vertical steepness has led to a tremendous variety of ecosystems and high rates of species endemism within a very limited geographical expanse of territory: tropical evergreen forests in the foothills till 800 metres; sub-tropical forests between 900 metres and 1,800 metres; temperate forests between 1,800 metres and 3,500 metres; sub-alpine vegetation between 3,500 metres and 4,500 metres and alpine forests thereafter till 5,500 metres followed by a non-tree environment. The eastern Himalayan region, already identified as one of the 16 most threatened "biological diversity hotspots" in the world, requires focused attention. Success in implementing future forestry interventions will require that forest management be carried out for, and by, local communities. Efforts will have to focus on implementing integrated area plans, and no undue emphasis can be placed on commercial exploitation of forestry products (particularly timber) that the ecosystems cannot sustain. Assistance will have to be extended from the global community for the maintenance of biological diversity and to achieve other objectives that do not yield direct benefits to local people. Source: Myint, A.K. and T. Hofer (1997). Forestry And Key Asian Watersheds. Paper prepared for the Asia-Pacific Forestry Sector Outlook Study by the International Centre for Integrated Mountain Development (ICIMOD), Kathmandu. Published as ICIMOD Document ISBN 92 9115 760 0. APFSOS Document series number APFSOS/WP/39. |
One of the important ecological roles of forests, and one that currently provides possibly the greatest potential to realise an economic return, is the provision of carbon sinks. Growing trees absorb carbon dioxide and fix it in the wood. Faster growth means more carbon is captured. Conversely, when forests are cleared or degraded and vegetation is burned or decays, carbon dioxide is released into the atmosphere. When forests are in a steady state then emissions and absorption will offset one another. At present, on a global scale, forests are estimated to be net emitters of carbon dioxide, primarily due to deforestation and degradation in tropical regions, including the Asia-Pacific.
Currently, a variety of schemes are being mooted to mitigate the effects of climate change. International negotiations through the United Nations Framework Convention on Climate Change (UNFCCC) are showing increasing interest in developing a trading system for greenhouse gas emissions, including carbon dioxide (Box 3.9).
|
Box 3.9: JOINT IMPLEMENTATION OPTIONS The driving force behind possible investment in developing countries is that it would cost less to take actions there than to invest in solutions within the industrialised countries. One source11 suggests that the estimated cost of meeting UNFCCC greenhouse gas emissions reduction goals through action within the borders of developed countries is US$250 billion while reducing the same amounts of emissions in developing countries would cost only an estimated US$80 billion. 11 Comparative cost estimate from R. Castro and F. Tattenbach et al. (1997) (quoting A. Steer). The Costa Rican Experience with Market Instruments to Mitigate Climate Change and Conserve Biodiversity. Global Conference on Knowledge for Development in the Information Age, Toronto, Canada. Workshop on Global Climate Change and Biodiversity. June 24, 1997. |
Various estimates,12 admittedly speculative at this stage, suggest that poorer nations could receive more money from trading "emission reduction units" than they now get from official development assistance. Such potential opportunities deserve serious attention by the forestry sector, although a note of caution is also warranted (Box 3.10).
12 Anonymous. (1997). Money to bum. Controlling global warming will be expensive. Emissions trading is an intelligent way to lower the cost. In The Economist, Vol. 345, No. 8046, 6 December 1997, London.
|
Box 3.10: CARBON TRADING-CAN DEVELOPING COUNTRIES BENEFIT? Even while detailed negotiations proceed on post-Kyoto arrangements for tradable carbon rights, it is clear that third-party countries such as developing countries are admissible as beneficiaries and participants in carbon trading. Thus, for example, the United States could earn credits for paying Indonesia to plant carbon-sequestering trees. It may even be possible that activities begun now will receive formal credit after 2000. Thus, for example, companies that are undertaking pilot carbon offset work in the South Pacific or in Malaysia can earn their credit informally now but formalise it after 2000. Some limited funds will also be available to help particularly vulnerable developing countries, such as island states, to adapt to the consequences of climate change. The signatory countries (developed and transition) can not only trade credits among themselves but also benefit by paying for projects implemented in developing countries through what is called the "Clean Development Mechanism" (CDM). The CDM will allow developing countries to submit projects even where a developed country partner is not immediately available. European, Japanese and American companies are reportedly looking to commit substantial resources for activities in developing countries. Source: Adapted from A. DiNicola (Personal communication, January 1998). |
Forestry offers several opportunities to sequester carbon or avoid emissions, thereby earning "emission reduction units." These basically fall into three categories:
· Management for conservation (prevention of emissions): The goal of conservation management is mainly to conserve existing carbon pools in forests that might otherwise be released by controlling deforestation, protecting forests in reserves, changing harvesting regimes, and controlling other anthropogenic disturbances such as fire and pest outbreaks.· Management for storage (short-term measures over the next 50 years or so): The goal of storage management is to expand the storage of carbon in forest ecosystems by increasing the area and/or carbon density of natural and plantation forests, and to increase storage in durable wood products.
· Management for substitution (long-term measures): The goal of substitution management is to increase the transfer of forest biomass carbon into products (e.g. construction materials and biofuels) rather than using fossil-fuel-based energy products, cement-based products, and other building materials.
All of the forestry opportunities identified above have possible applications in Asia and the Pacific. However, there are currently only a few examples of forestry sector carbon-offset projects under implementation or being developed in the region. These include: reduced impact logging projects in Indonesia and Malaysia; a proposal for a plantation offset project in Fiji; proposals for integrated forest management systems including carbon sequestration in the Solomon Islands, and Papua New Guinea; and a forest rehabilitation project in Sabah, Malaysia.13 The prospects of the forestry section capturing carbon offset are commented on Box 3.11.
13 Serrill, M. S. (1997). Ghosts of the forests. Special issue on environment "Our precious planet - why saving the environment will be the next century's biggest challenge." In Time, November 1997.
|
Box 3.11: HOW ASSURED IS CARBON-OFFSET INVESTMENT IN FORESTRY? Notwithstanding the promise that the Kyoto accords bring, a word of caution is warranted with regard to the prospects of the forestry sector capturing very large investments from the carbon-offset opportunity. The point needs to be made that, polluting industries in developed countries (the source of expected funding) will carefully consider all options for addressing their pollution problem, of which compensation through sponsoring forestry would be only one. Selection of options will depend on which are cheapest, most easily managed, or do the most for the image of the company. It will therefore be essential for the forestry sector to show that it offers a better package than other options. Among such options, perhaps the most serious challenge to the forestry-offset solution is policy or technological breakthroughs within the industrialised countries themselves that could reduce the cost of scrubbing pollutants out of emissions. At the moment, technologies are costly because they are practically tailor-made for each task and so face high unit costs. If governments in industrialised countries were to offer tax breaks, accelerated depreciation, or other policy incentives, new technologies could soon be mainstreamed and costs of adoption could become competitive with overseas solutions such as tree plantations. Governments could also simply tax carbon-releasing fossil fuels more and, for the price of a few cents more per litre, capture the funding needed to finance pollution-reducing technologies while also giving a price incentive for less wasteful use of fossil fuels. |
Two prominent objectives for maintaining protected areas are to provide habitat for wildlife and to conserve biological resources. To meet these objectives, a wide range of ecosystems, from wetlands to woodlands and closed forests, needs to be protected.
Information from the WCMC14 shows that Asia-Pacific has a strong justification for maintaining protected areas. The People's Republic of China ranks third (after Brazil and Colombia) in terms of variety of flowering plants, with Indonesia not far behind. Indonesia also ranks second in the world in terms of species of mammals and fifth for birds. Another five countries in the region feature among the 20 "mega-biodiversity" countries.
14 Document APFSOS/WP/04, 1997.
Currently, protected areas of all IUCN categories cover some 250 million hectares (nearly 9 percent of the land area) in the Asia-Pacific region. This is considerably higher than the global average of 6 percent. Of the regional total, however, about 86 percent is accounted for by only five countries. Australia alone has 38 percent and the People's Republic of China has 27 percent; the other three countries are Indonesia, Mongolia and India (in descending order). An encouraging fact is that in all sub-regions, the area under protection continues to increase.
With its high population and rapid increase in absolute numbers, the Asia-Pacific region will have difficulty maintaining the high proportion of protected areas falling under strict and near-strict protection (IUCN categories I and II) in the future. In a few rapidly growing economies, the release of land for protection may become easier as livelihoods are transferred from agriculture to manufacturing and services. But in most countries, the only feasible alternative may be to shift toward more loose conservation with some development permitted, such as IUCN categories V (conservation with traditional uses and recreation) and VI (sustainable use of natural ecosystems), and integration of conservation goals with other land uses.
|
Box 3.12: CONVENTION ON BIOLOGICAL DIVERSITY Article 1 of the UN Convention on Biological Diversity establishes as an objective"... the fair and equitable sharing of the benefits arising out of the utilisation of genetic resources...." The Convention recognises that developing countries will need assistance to fulfil the requirements of the Convention and to be able to adequately benefit from it. Article 20 refers to financial resources for implementing the Convention, including new and additional funding. Article 21 sets out the financial mechanism to channel funds to developing country parties of the Convention. |
The Asia-Pacific region has impressive biological resources. Calculations of Biodiversity Indices,15 which measure the relative importance of a country for biological diversity conservation per unit area, place Indonesia particularly high with a score of 26.8. Following are the Philippines (14.0), Malaysia (13.7), Papua New Guinea (13.3) and Viet Nam (12.7).16 All of these and others need to further expand their conservation areas if they are to preserve fully representative biodiversity potential. The overall biodiversity resource base, however, potentially positions the region well to benefit from the recent global upsurge in biodiversity prospecting. This has so far generated significant revenues for only a few countries (such as Costa Rica) but has potential to grow rapidly.
15 WCMC in Document APFSOS/WP/04, 1997.16 Many other indices of importance of biological resources can be used. For example, China is one of the three major centres of origin for cultivated plants in the world, with numerous wild relatives of cultivated plants.
Private sector opportunities to capture revenues from biological diversity, while respecting the principles of sustainability and all measures of the Convention on Biological Diversity (Box 3.12), are among the ways which Asia-Pacific countries can actively capitalise on their rich resources. Sales of seed are a well-established source of revenue, increasingly important in countries like Australia. Sales of prospecting rights in forests that may yield valuable drugs to pharmaceutical companies are now another opportunity. Discovery of flora and fauna with pharmaceutical value generally conform to the laws of probability; therefore areas containing greater biodiversity are likely to command higher fees for prospecting rights. Once again, however, questions arise as to whether the benefits of biodiversity conservation will accrue to the people who bear the conservation costs.
A primary question is how the region can capture more effectively the potential commercial opportunities from bio-prospecting in forests while ensuring sustainability of the resource. To move from bio-prospecting to a usable commercialised drug is an expensive undertaking and requires technological capacity, which many biologically-rich countries do not currently possess. Before developing countries are able to develop such capacity, some risk exists that patents will be taken out on key genetic resources or the procedures for their manipulation - a development that could restrict their future options for commercialising their own resources.
Arguments can also be made that biological diversity conservation has both option and existence values. Option values reflect the potential benefits of forests in the future as opposed to their value for present consumption. Existence values reflect the satisfaction that people derive from knowing that a resource exists, even though they may never make use of the resource. For example, the conservation of panda bears in the People's Republic of China provides existence value to people around the world.
Mangroves provide a wide range of services and functions that is vital to many countries in the region. These can be grouped as follows:
· production functions: ranging from timber (including pulp chips), fuelwood and charcoal, medicinal and chemical products; wildlife products such as honey; and fishery products - the production of fish, prawns etc. in the Sundarbans, for example, is an important part of the national fishery catch of Bangladesh.· habitat functions: many fish species breed in mangroves as do molluscs and shrimps; mangroves are also ideal for some aquaculture. Many have rich biological diversity and some are a habitat for sometimes endemic or threatened wildlife (e.g. the Bengal tiger). Mangroves are important also for both resident and migratory bird populations.
· sink and other ecological functions: important sink functions include suspected holding of excess nutrients and pollutants that could otherwise be discharged directly into coastal lagoons, coral reefs and other near-shore areas.
· physical coastal protection: storm-protection functions for shorelines are critical in many cases. For this reason, Indonesia even requires establishment or maintenance of a mangrove "greenbelt."
The area of mangroves in the Asia-Pacific region is not well known and monitoring efforts are only partial. Two estimates are given in Box 3.13; noteworthy is the dominance of Indonesia and a few other countries. In terms of significance for the social and economic fabric of any one country, mangroves are probably most important in Bangladesh where the Sundarbans ecosystem at the joint mouth of the Ganges and Brahmaputra serves ecological, economic and cultural functions of inestimable worth for the country.
Mangroves face many threats. Most widespread and serious are over-harvesting of wood and non-wood resources without adequate regeneration, conversion of mangrove areas to intensive shrimp and fish ponds, and excessive hunting and fishing of wildlife. Many mangrove areas are also threatened by pollution from neighbouring or resident populations and by upstream agricultural fertilisers and pesticides. In many Pacific Islands, construction of roads has altered drainage patterns causing severe damage to mangroves. In some areas, new settlements are leading to the drainage of mangrove areas, with consequent loss of wetland functions.
|
Box 3.13: THE STATUS OF MANGROVES IN THE ASIA-PACIFIC REGION A useful, albeit dated, reference on mangroves in Asia and the Pacific is an FAO report issued in 1984.17 The approximate total mangrove area reported at that time was about 5.8 million hectares, of which some 43 percent (2.5 million hectares) was in Indonesia alone, the second largest area being in Myanmar (0.8 million hectares or 14 percent) and the third in Malaysia (0.6 million hectares or 11 percent). The five countries with the largest areas together accounted for 84 percent of the regional total. Some of the most important mangrove sites are in the deltas of principal rivers such as the Ganges/Brahmaputra, Indus, Irrawady, Mekong, etc. 17 FAO (1984). Mangrove forests in Asia-Pacific region - a summary of available information. Project GCP/RAS/106/JPN Field Document No. 1, Special Study on forest management, afforestation and utilisation of forest resources in the developing regions. FAO, Bangkok. A 1993 ITTO report18 presented updated information on mangroves, but only for selected countries. For Indonesia, it reports over 4.25 million hectares of mangroves of which three-quarters are in Irian Jaya. There are clear differences in measurement and definition between the ITTO and FAO reports, since the area reported in the 1993 ITTO document is nearly twice that reported by FAO in the early 1980s. In any case, only 14 percent of Indonesia's mangroves were reported as being under official conservation while 17 percent were designated for log production. The bulk of Indonesia's mangrove resource is subject to a "no-clear" policy. Malaysia was reported to have 0.64 million hectares, of which some 70 percent had been gazetted into reserves. Nevertheless, between 1980 and 1990 there was a 12 percent loss of mangroves in Malaysia, mostly due to chipping of wood for the pulp industry. In Thailand early loss rates were even higher, with a 9 percent loss in only 4 years between 1975 and 1979, and a near 50 percent reduction between 1980 and 1990. In Bangladesh, available information indicates more degradation of mangroves than actual loss in area. Myanmar reports alarming degradation due to over-exploitation for fish, food, small timber, fuelwood, charcoal and other forest products, as well as agricultural encroachment. 18 ITTO (1993). The economic and environment value of mangrove forests and their present state of conservation. Document PCF(XII)/14. Prepared for 12th Session, Permanent Committee on Reforestation and Forest Management, Kuala Lumpur, Malaysia, 11-19 May 1993, by the Japan International Association for Mangroves and the International Society for Mangrove Ecosystems. Source: FAO (1984); ITTO (1993); Document APFSOS/WP/08. |
Among the key challenges that are likely to shape the future with regard to forest-based services are:
· altering public and political perceptions to bring about recognition that: (a) forest values, other than those solely related to timber, can be financially realised and are important; and (b) ignoring values of ecological services of forests is likely to incur substantial downstream costs;· securing reliable and effective inter-country co-operation for responsible management of major transboundary watersheds in order to protect water supply functions;
· developing more acceptable valuation methods for pricing externalities and for identifying beneficiaries: this will include designing innovative approaches for measuring externalities and incorporating benefits and costs of forest-provided services in both policy decisions and investment analyses;19
19 Costanza, R. et al. The Value Of The World's Ecosystem Services And Natural Capital. In Nature, 387:253, 15 May 1997. A recent attempt to value the ecosystem services supplied by wildlands suggested an average annual value of US$33 trillion, a sum that is double the annual Gross Global Product. Even if this estimate is substantially wide of the mark, it nonetheless indicates a huge equivalent monetary value for these difficult-to-value services.· developing mechanisms to maintain the diversity of services from forests while continuing to derive economic benefits from them: such an approach will need to recognise the socio-cultural basis for these services, including how they relate to indigenous and local people's rights;
· mobilising investment for developing forest-provided services: the challenge is to create self-sustaining "markets" for services, by developing methods whereby beneficiaries share the costs of sustaining service functions (e.g. through taxes, charges, or voluntary contributions); and
· ensuring integrated and sustainable management of forest-provided services: that is, ensuring that continued provision of forest services is an integral component of the objectives and actions of forest resource management.
At international levels, there is urgent need for countries to agree on:
· the value of upstream conservation for river systems where upper catchment forests protect and preserve water quantity and quality for use in countries downstream;· mechanisms for acknowledging and compensating the carbon sequestration benefits of forests, including the possibilities of trading and selling "emission reduction units;" and
· valuing and compensating the commercial applications of genetic resources, which can be used far from their native habitats.
The outlook for forest-provided services will likely range between two extremes. One scenario is for a continuing disregard for the value of forest services and subsequent widespread deforestation and forest degradation. This will result in increasing social costs such as falling agricultural productivity, environmental hazards, erosion of biological diversity, deterioration of wildlife habitats, impairment of water quality and alteration of streamflow regimes. A more positive future would be marked by enhanced awareness of the benefits and values of forest-provided services and clear mechanisms for compensating the people who provide and protect them.
20 Much information and a full analysis of NWFP issues in the region are in the working paper by Mittelman et al.. Document APFSOS/WP/28.
Types of non-wood forest products
Trends in consumption, production and trade of NWFPs
Issues and possible responses
A setting for the future
Over time, people have discovered innumerable uses for non-wood forest products (NWFPs). As a consequence, millions of people living in the vicinity of forests, particularly in developing countries, have become heavily dependent on NWFPs for food, shelter, and increasingly for cash incomes. A universally agreed definition of NWFPs is yet to be adopted. For purposes of this outlook study, however, NWFPs are defined as all goods of biological origin, other than wood, that are derived from forests and associated land uses.
Across the Asia-Pacific region, NWFPs come from diverse sources, ranging from large plants (palms, grasses, herbs, shrubs, trees) and animals (insects, birds, reptiles, large animals) to micro-flora and micro-fauna. While some NWFPs are found only among the biological richness and ecological diversity of natural forests, others have been domesticated and are grown as pure crops or as mixed crops under agro-forestry systems. Thus, some NWFPs have become intensively managed agricultural and horticultural crops, while others remain grouped as "minor" products of forests, an appellation used in spite of their often high real or potential value. Table 3.1 provides a broad categorisation of NWFPs based on key end-uses.
The number of NWFPs produced and traded in Asia-Pacific far surpasses those of most other regions. From the medicinal plants of Mongolia and Nepal to the butterfly farms of Papua New Guinea and bush krucker enterprises in Australia, the scope and nature of NWFPs vary considerably.
For purposes of economic analysis, NWFPs are perhaps best classified according to their level of use and marketing:
· At the subsistence level, most NWFPs are consumed immediately after harvesting, with minimal processing (e.g. fruits, wild meat) or after primary processing (e.g. edible nuts, bamboo products). At this level, NWFPs are occasionally bartered, but are more generally used directly by the families collecting them.· At the local-use level, processing generally takes place in small, dispersed, family-owned units that are often financially weak and technologically unsophisticated. At this level, NWFPs are sometimes bartered, but more often they are sold for cash in local markets. Generally, however, these operations generate limited financial returns since local markets are usually small and local spending power is weak.
· At the commercial level, NWFPs often go through several levels of processing and pass through several transactions on their way to final use. Some products are sold to meet bulk demands (e.g. rattan, resins) and others reach specific international niches (special types of honey, aromatic chemicals).
Table 3.1: Categorisation of NWFPs by end-use
|
End-use |
NWFP examples |
|
Food products and additives |
wild meat, edible nuts, fruits, honey, bamboo shoots, birds nests, oil seeds, mushrooms, palm sugar and starch, spices, culinary herbs, food colourants, gums, caterpillars and insects, fungi |
|
Ornamental plants and parts of plants |
wild orchids, bulbs, cycads, palms, tree ferns, succulent plants, carnivorous plants |
|
Animals and animal products |
plumes, pelts, cage birds, butterflies, lac, cochineal dye, cocoons, beeswax, snake venom |
|
Non-wood construction materials |
bamboo, rattan, grass, palm, leaves, bark fibres |
|
Bio/organic chemicals |
phytopharmaceuticals, aromatic chemicals and flavours, fragrances, agrochemicals/insecticides, bio-diesel, tans, colours, dyes |
In individual countries, the importance of NWFPs is particularly impressive (Box 3.14). For example, in India, about 7.5 million people are engaged as part-time collectors of tendu (Diospyros melanoxylon) leaves, and another 3 million process the leaves into bidi cheroots. Estimated revenues from tendu leaves are US$200 million per year. In Manipur State, 90 percent of the population depends on forest products as a major source of income, including a quarter of a million women.
Particularly prominent at international levels are bamboo and rattan. The total estimated area of forest used for commercial bamboo production in Asia is just less than 11 million hectares, predominantly in the People's Republic of China, India and Myanmar. For rattan, Indonesia is the world's largest producer; the People's Republic of China is second.
A recent study21 suggests that at least 150 NWFPs are significant in international trade. The total value of world trade in NWFPs and the contribution of individual products, however, vary considerably from year to year. During the 1990s, the annual value of NWFPs trade ranged from US$5 billion to US$11 billion. The Asia-Pacific region's share of exports is estimated to be between US$2 and US$4 billion. Most NWFPs are traded in small quantities, although for some (e.g. rattan, gum arable and edible nuts) trade has reached substantial levels.
21 Mohammad Iqbal (1993). International trade in non-wood forest products: an overview. FO: Misc/93/11 Working Paper. FAO, Rome.
Until recently, the international markets for NWFPs were generally in decline, largely due to the development of cheaper synthetic substitutes. Prices for NWFPs correspondingly declined. Unstable supplies, inconsistent quality and unreliability in the sourcing of NWFPs also contributed to this trend. The recent resurgence of interest in natural products, however, has generated renewed interest in NWFPs in the international markets.
The future outlook for NWFPs is variable, depending on the product involved and the circumstances of utilisation. Key trends include increasing commercialisation of NWFPs (sustainable only if resource management and/or domestication accompanies the demand growth), declining importance of NWFPs for subsistence use, disintegration of traditional systems depending on NWFPS, including resource management systems, and devolution to community-based management.
Of the features that emerge about the future, two should be highlighted:
· The overall trend is toward depletion of many NWFP resources. This is due to inadequately regulated harvesting and increasing market demand for commercially popular species. These products include rattan, damar resin, gaharu trees (Aquilaria malaccensis), various barks, roots, stems and leaves used as medicines, and a large number of rare and endangered fauna.· There is likely to be increased domestication and cultivation of selected NWFPs (e.g. rattan cultivation in Indonesia and Malaysia). This trend will apply only for products with strong demand in the marketplace. For inferior products, demand is likely to decline with growing economic prosperity. Domestication and cultivation of these products are unlikely.
|
Box 3.14: NON-WOOD FOREST PRODUCTS - INDIA, THAILAND AND SRI LANKA India: Nearly 400 million people living in and around forests in India depend on NWFPs for sustenance and/or supplemental income. NWFPs contribute significantly to the incomes of about 30 percent of rural people. More than 80 percent of forest dwellers depend on NWFPs for basic necessities. Collection of NWFPs comprises the main source of wage labour for 17 percent of landless people, and 39 percent are involved in NWFP collection as a subsidiary occupation. The annual value of direct contributions of NWFPs in India is estimated to be about US$27 billion, compared to about US$17 billion for wood products. NWFPs account for about 50 percent of total forest revenue to the Indian Government. Because India has only limited wood products exports, NWFPs are proportionately very important in that country and account for around 70 percent of forest-based export earnings (US$500 million). NWFPs provide 55 percent of total employment in the primary forest sector, with considerable multiplier effects in downstream processing and trade of some products. The major NWFPs of India include bamboo, rattan, beedi leaf, gums and resins, oil seeds, essential oils, fibres, flosses, lac and medicinal plants. In terms of industrial capacity, annual production of bamboo is currently estimated at around 4.5 million tonnes. Around 25 percent of fibre-furnish used in India's paper industry is bamboo pulp. Another of the largest NWFP contributors, the beedi leaf (Diospyros melanoxylon), is used in cheroot manufacturing in India. Cheroots are mainly produced as a cottage industry - one that provides employment for some 10 million people and has a production valued at about US$200 million. Thailand: About 30 to 40 percent of the Thai population rely on traditional remedies rather than modern health services. These traditional remedies include the use of more than 1,000 species of medicinal plants. In 1980, about 400 million baht (US$16 million) worth of medicinal plants were consumed domestically. Of this amount, about 126.6 million baht (US$5 million) worth were imported, but imports have declined in recent years. Medicinal plant collection is estimated to employ the equivalent of 15,000 to 20,000 full-time workers, although actual collection is normally a part-time or seasonal endeavour for most collectors. Trading and processing employ the equivalent of 30,000 to 40,000 full-time workers. An important boost to commercial utilisation of medicinal plants has come from institutional improvements: establishment of the Medicinal Plants Information Centre at Mahidol University in 1997, and greater interest by the Government Pharmaceutical Organization. Hundreds of private companies are also licensed for drug production apart from small unlicensed home workshops. The medical sector has problems in promoting traditional medicine because knowledge is lacking or inadequately documented, there is inadequate research, medical practitioners rely heavily on modern medicine and industrial products, and there is a shortage of medicinal plant supplies, especially those from the forest. Support from the forestry sector is needed in conserving the resource base for medicinal plants. Sri Lanka: Medicinal plants are commonly found in natural forests, non-forest lands and herbal gardens. More than 50 percent of the plants used in Ayurveda, however, are found in the natural forests. Assessments reveal heavy dependence on these plants. In one forest area, medicinal plants collected were worth as much as Rp2,500 (US$57) per family per year. Source: For India, adapted from C. Chandrasekharan (Personal communication, 1997); for Thailand, Document APFSOS/WP/46; for Sri Lanka, Document APFSOS/WP/16. |
Current trends indicate that the natural stocks of many commercially important NWFPs may be totally or nearly totally decimated in the coming years.22 An alternative scenario would require the emergence of viable NWFP policies and strategies that successfully incorporate elements of community-based management, niche market development, domestication and cultivation of NWFPs, and promotion of fair trade in world markets. It is likely that both trends will evolve simultaneously within any given country - for different types of products and markets. In this regard, the fate of NWFPs is very dependent on an enabling policy environment designed to promote and support favourable scenarios.
22 A.J. Mittelman, C. K. Lai, N. Byron, G. Michon and E. Katz (1997). Non-Wood Forest Products Outlook Study For Asia And The Pacific: Towards 2010. Document APFSOS/WP/28. FAO Rome/Bangkok.
The fundamental issues and challenges for most NWFPs are closely related to the small scale of their production, their limited significance in markets, and their lack of development in an industrial sense. These attributes tend to keep NWFPs unnoticed by national policy-makers. A number of key themes can, however, be distilled from the overarching issues outlined below. These issues and constraints will need to be addressed effectively if NWFPs are to play significant roles in Asia-Pacific forestry in the future.
Lack of focus in NWFP support programmes: A key constraint to the sustainable development of NWFPs is the tendency to treat all NWFPs as being "good" without selecting those with the best commercial prospects for development support. This tendency stems from a lack of consensus on development objectives related to NWFPs. Social objectives oriented toward helping the poor often lead to the promotion of subsistence NWFPs as if they had commercial potential. Moreover, where commercial potential does exist, there is sometimes a reluctance by governments to promote development that might further marginalise subsistence users. Separating objectives, or at least clarifying them, would help direct resources to where they can be most effective.
In most countries, NWFPs have not been screened to identify those with the most potential for mainstream development. Promotional efforts are thus dispersed over too many NWFPs, many of which have no real future in modern economies. In the future, it may be necessary to ruthlessly select for priority attention only those products with great potential (according to location and socially sensitive criteria) and focus development efforts on them. This can be done while simultaneously supporting subsistence products; efforts should reflect and complement clearly defined development objectives.
Lack of investment in research and development: The potential for research-based improvements in techniques, systems, and technologies supporting the production of NWFPs in the region is enormous. However, because most collection of NWFPs is done on a very small scale, often without clearly identified downstream marketing opportunities, there is little attraction for commercial research and development. The challenge for NWFP producers is to demonstrate sufficient long-term development potential as economies grow so as to attract funding and appropriate scientific skills.
Institutional and policy neglect: One of the major problems afflicting the NWFP sector is institutional neglect. Unlike wood-based industries, which often benefit from a host of policy, strategic and legislative support mechanisms, NWFPs are generally given minimal attention. As a consequence, NWFP issues are not appropriately addressed in plans, programmes and projects.
A number of organisations in the Asia-Pacific region are working to remedy this institutional neglect. These include the International Neem Network; International Society of Ethnobotany; International Society of Ethopharmacology; International Network on Bamboo and Rattan; Under-utilised Forest Trees Network for Asia; World Federation of Proprietary Medicine Manufacturers; International Federation of Essential Oil and Aroma Traders; Asia-Pacific Medicinal and Aromatic Plant Network; and various bee-keepers associations. Integrated conservation and development project (ICDP) approaches offer prospects for mainstreaming NWFP activities among other livelihood and prosperity initiatives. Development of local NWFP enterprises is one of the principal components of such programmes.
Small scale of industry: Most NWFPs are of primary importance at local levels and are often associated with traditional uses that are not widespread. Transactions take place between households and other small-scale units, mostly outside mainstream commercial marketing systems and channels. As a consequence these NWFPs tend to be overlooked or discounted in national-level statistics and resource planning.
Economic weakness of NWFP-dependent communities: NWFPs are usually collected by individuals with limited marketing options or negotiating power. Typically, collectors are faced with only a single buyer. Networks of local collectors and intermediaries are often bound by long-term, often debt-based, relationships. Individuals who hold collection licenses or concessions often hire casual or contract labourers, who are usually paid on piece rates. This practise encourages aggressive, often-unsustainable, harvesting. Institutions such as the Tribal Co-operative Marketing Development Federation of India Ltd. (TRIFED) are helping to redress such issues and improve the marketing of NWFPs.
One of the key social aspects of production and trade in NWFPs is the extent to which local people benefit from the development of the industry. Generally, the higher the level of processing carried out at or near the source of raw materials, the more local people benefit. NWFPs are particularly well suited for enterprise development in situations of capital scarcity. For example, capital investment requirements in rattan processing are estimated at US$1,750 per job created. By comparison, the petrochemical industry requires US$26,250 per job created.
Absence of inventory information: The absence of proper inventory information for NWFPs is a major impediment to effective planning for integrated forest management systems. Nonetheless, developing inventories of the multitude of NWFPs in the Asia-Pacific region is also a mammoth task. An initial step would be to develop a means of identifying the broad range of NWFPs produced in a management area and to determine those that can usefully be inventoried at more detailed levels.
Dominance of timber-oriented forest management: Foresters have been developing and refining silvicultural systems for managing tropical forests for over 100 years. These systems, however, have generally been designed to maximise the production of commercial timber. Silvicultural systems that promote the management of non-wood resources in forests, in combination with timber, have received much less attention. This omission has been a source of conflict in resource management, particularly between concerned user groups. The success of NWFP development in many places will depend on the ability to implement management systems which recognise and promote the production of both timber and non-timber resources.
Domestication of NWFPs: An important consideration to complement natural forest management, is the potential for NWFP production through domestication and intensive cultivation. Historically, once products achieve mainstream commercial importance, their supply from wild sources tends to be replaced by cultivated sources with a view to bringing production, quality and cost under control. Oil palm, rubber, cashew, coffee, cocoa and pepper are but a few of the many wild forest products that have been largely replaced by production from cultivated sources. Domestication and plantation cultivation can only be justified, however, if there are good long-term commercial prospects for the product.
Unsustainable and wasteful harvesting: Presently, there are numerous incentives to over-exploit many NWFPs, and generally few regulatory checks on their harvesting. Extensive extraction and inadequate or inappropriate management regulations have often caused resource depletion in the region. Many NWFPs are highly sensitive to exploitation and to disruption of ecosystems. The high species diversity of tropical forests means that unregulated harvest of parts of plants for NWFPs can disrupt bio-chemical cycles and affect the entire ecosystem. Moreover, current extraction methods are often particularly wasteful due to a lack of appropriate tools and techniques, and a lack of concern for sustaining the resource. For example, studies in Indonesia indicate that wastage in conventional harvesting of rattan is of the magnitude of 14 to 28 percent, with further wastage during transportation and storage in the vicinity of 4 to 12 percent. By using improved harvesting methods, total wastage can be reduced to about 4 to 6 percent.
Inefficiency in processing: sophisticated downstream processing of NWFPs is rarely done in developing countries. This is partly attributable to inadequate technology, a shortage of skilled workers, weak management expertise, and inadequate investment and marketing arrangements.
Challenges from synthetics: particularly in the post-war years, synthetic products have provided increasing competition to NWFPs, with this challenge only somewhat mitigated in recent years by the rise of "green consumerism." Aggressive marketing of the "environment-friendly" attributes of NWFPs could go a long way to maintaining consumer loyalty but may succeed only in capturing niche markets rather than mainstream success in the market.
For broader success, extensive research and development will be crucial to maintain competitiveness and marketability. For example, the survival of essential oil and flavour industries is largely due to intensive research on breeding new and better oil-yielding varieties, improvements in agrotechnology and post-harvest technology, value added product development and new formulations. These measures resulted in improved competitiveness vis-a-vis synthetic substitutes.
Developing a perspective on the future for NWFPs is complicated by a variety of factors. The information base for NWFPs is very weak and the products are heterogeneous; hence their aggregate outlook requires separate studies of component groups and specific products within the groups. With increasing human population and wealth, however, along with an emerging preference for natural products, an appreciable increase in industrial demand and global use and trade of selected NWFPs is likely. This demand should promote increased quality and efficiency in NWFPs operations.
More broadly, it is evident that the future of NWFPs cannot be assured on the basis of pious hopes or claims by advocates that they have vast scope and potential. Policies and actions need to be put in place to ensure the integrity and stability of non-wood forest resources as well as efficient processing and marketing. None of this can succeed if the intention is to promote all of the thousands of NWFPs simultaneously. The NWFP agenda has been fragmented for too long; consequently progress has been limited. Agriculture has succeeded by selecting a few crops and animal types that now supply most of mankind's needs. The same can be done for NWFPs without destroying the many others that would receive less specific attention but would not be neglected in conservation efforts or subsistence management.
Pursuing aggressive development of selected products carries a risk that those who depend on collection in the wild may lose their livelihoods. Therefore, ways must be found to involve them in the domestication process or alternative livelihood opportunities must be provided.
With regard to resources, management systems need to recognise that ecosystem relationships tend to be symbiotic. Therefore, development of integrated systems of management that include NWFPs is likely to enhance the health of forests. Symbiosis can also be economic in the sense that NWFPs can generate income during the prolonged periods between timber harvests in natural forests or in the early years of plantations before they are mature.
Research and technological development will be a key. Forests constitute an enormous reservoir of chemical and pharmaceutical compounds, many of which remain untapped or may have, as yet, undiscovered properties. Box 3.15 outlines several research breakthroughs in the Republic of Korea using forest-based chemicals.
|
Box 3.15: PRODUCTION OF CHEMICAL COMPOUNDS FROM FOREST SPECIES IN THE REPUBLIC OF KOREA THROUGH THE USE OF BIOTECHNOLOGICAL TOOLS The Korean Forestry Administration has long realised the importance of non-wood forest products and has tried to find new materials from native trees and herbs. Recently researchers successfully found several new materials for medicinal and industrial purposes, and have conducted research toward the commercial mass production of the species possessing such characteristics. Three examples are given below: · Extraction and purification of natural preservatives: Components of tree species in the family Theaceae have long been used both in folk medicine and as vegetables for human consumption. The trees contain antimicrobial substances effective in protecting against tooth decay. Recently, it was discovered that some of the antimicrobial compounds can also be used to prolong the shelf life of foods. In experiments in which compounds from five plant species belonging to the family Theaceae were extracted and chemically purified, Shima liukiuensis showed the most promise for this latter purpose. · Degradable plastic (PHB) production from transgenic poplars: PHB (Polyhydroxy butyrate) is a biopolymer with several physical and chemical properties similar to polypropylene. However, unlike synthetic plastic, once discarded it is readily degraded by soil micro-organisms. The production of PHB using microbial fermentation is too costly and therefore research was undertaken to use plants as an alternative way to produce precursors of PHB through photosynthesis. Attempts were made earlier to produce PHB from some herbaceous plants but poplars were recently tried because they are fast growing trees and thus might produce PHB at low cost, over relatively short periods of time. The Korean Forestry Administration used a hybrid poplar (Populus alba x P. glandulosa) for the production of PHB. The poplar clones were genetically transformed to incorporate genes involved in PHB biosynthesis, using as a vector Agrobacterium tumefaciens. It was demonstrated through standard methodologies that these genes could be inserted into the genome, that they manifested themselves and that they were stable. The resulting tissues synthesised PHB. · Hepatitis B vaccine production from transgenic poplars: The hepatitis B type virus (HBV) is a small, enveloped virus with a double-stranded DNA genome that causes acute and chronic hepatitis and hepatocellular carcinoma. Conventional vaccines use attenuated infectious agents that are incapable of causing disease, but which trigger an immune response in the recipient. While earlier there have been a number of such prophylactic vaccines against HBV on the market, no therapeutic vaccines have been available until recently. The new system developed in the Republic of Korea utilises a small synthetic peptide (called epitopes) which restricts the spread of the disease or cures the infected cells. As synthesis of epitopes seemed too costly, genetic transformation of plants to produce these was considered a potential low-cost alternative. A system was developed for the production of the vaccine using a transformed hybrid poplar clone (Populus alba x P. glandulosa), into which the synthetic epitope producing gene was introduced. Through this method, poplar plants that carry and produce HBTV (hepatitis B type therapeutic vaccine) in the cell have been produced. An application has been made for the patent rights, and efforts are underway to introduce systems that would allow forest owners to apply the results of this successful research for added income from the forest. Source: Dr Byoung II Yoo, Forestry Research Institute, the Republic of Korea, March 1998. |
The continuing utilisation of NWFPs is largely bound up in the traditional dilemma of balancing operational efficiency with conservation concerns. Aside from technological improvements, this suggests the need for new arrangements of access, ownership, control and management. It also points toward the need for clear understanding of the respective roles of local people, management agencies, industry and government.
23 hi this section, unless specifically mentioned, basic information has been derived from two sources that should be consulted for greater detail. The first is the Regional Study on Wood Energy Today and Tomorrow in Asia, prepared specifically for the outlook study by the FAO Regional Wood Energy Development Program in Asia (RWEDP) in Bangkok. The second is Wood Energy Today for Tomorrow - a Study for Asia by Lefevre et al. at the Asian Institute of Technology, also in Bangkok.
Trends in production and consumption
Demands on resources and possible responses
Woodfuels supply the basic energy needs for over 2 billion people in Asia and the Pacific (Box 3.16). In the 16 Regional Wood Energy Development Programme (RWEDP)24 countries, about 18 percent of total energy needs are obtained from woodfuels, estimated to be worth approximately US$29 billion annually. Approximately three-quarters of all roundwood production in Asia and the Pacific is used as woodfuel (Figure 3.1). And although per capita use of woodfuels is declining in some countries, increasing populations mean that consumption is increasing in absolute terms. According to RWEDP studies, by 2010 woodfuel consumption is expected to be about 25 percent higher than at present.
24 RWEDP is a Netherlands-funded, FAO-executed project. Member countries are Bangladesh, Bhutan, Cambodia, PR China, India, Indonesia, Laos, Malaysia, Maldives, Myanmar, Nepal, Pakistan, the Philippines, Sri Lanka, Thailand and Viet Nam. Given that RWEDP membership includes all the region's most populous countries, RWEDP references practically apply to the whole region as far as developing countries are concerned.
|
Box 3.16: ENERGY TERMINOLOGY Conventional energy refers to mainstream commercial energy inducting electricity from all sources and fossil fuels in gas, liquid or solid forms; woodfuels means fuelwood plus charcoal; biomass energy means woodfuels plus non-wood renewable organic fuels (such as crop residues and dung). |
Figure 3.1: Share of woodfuel in total roundwood production in RWEDP countries, 1995
|
Box 3.17: SUMMARY OBSERVATIONS WOOD - ENERGY IN ASIA-PACIFIC Wood energy is and will remain an important sub-sector in all RWEDP member countries but less so in the newly industrialised developing countries and definitely a minor concern in industrialised ones. The consumption of wood and other biomass fuels will increase in the foreseeable future. Aggregated for all the RWEDP member countries, potential woodfuel supply exceeds current demand. The primary concern is not the availability of woodfuels per se, but their distribution or accessibility to people in need. Non-forest land, mostly agricultural, already is and will continue to be the main source of woodfuels, accounting in the RWEDP countries for an average of two-thirds of supplies. Where woodfuel scarcity is locally significant, other biomass fuels (also mostly from agricultural lands) are important. Salient points of the current situation follow: · In heavily forested countries such as Malaysia and Indonesia, at national level there is much more wood than can be used as fuel given current technologies. · In the People's Republic of China, India, Sri Lanka, Thailand and Viet Nam, aggregate national consumption is not presently limited by aggregate potential supply. · In Bangladesh and Pakistan, as well as Nepal to some extent, present woodfuel demand is under strain, with net deficit or near deficit even in aggregate terms at national levels. Use of crop residues and other biomass may exceed that of woodfuels in some cases. · In practically all RWEDP countries, localised woodfuel scarcities may occur in particular areas. · Wood energy constitutes a low share in total energy use in AIEs, except for wood and biomass residues used as energy sources by industries. · In those countries where economies are growing fast, growth of woodfuels demand is either slowing down or may soon even decline (as happened in the Republic of Korea following rapid industrialisation). The People's Republic of China is beginning to show signs of this trend. At the same time Chinese consumption of crop residues for energy purposes is increasing which suggests local shortages of fuelwood. · Households are the biggest energy consuming sector in many countries and especially so for woodfuels. · The contribution of fuelwood to total energy consumption may vary over a wide range but its share in household energy consumption has remained well above 50 percent in most Asia-Pacific countries. The exceptions are generally the AIEs and the NIEs. · Non-household fuelwood consumption, such as for rural industries or for food establishments in urban areas, is significant in some countries. Source: Adapted from RWEDP (1997) and Lefevre et al. (1997). |
Both production and consumption of woodfuels occur largely in informal sectors where records are poorly kept. Consequently, available data are limited. Nevertheless, enough studies relating to woodfuel have been conducted in recent years to make a confident assessment of the important role of wood energy. Box 3.17 summarises the current wood energy scene in the region, based on observations for the RWEDP countries.
The use of biomass fuels (wood and non-wood) is prominent in most RWEDP member countries, with the share of woodfuel in total energy consumption ranging from 9 percent in Malaysia to over 80 percent in Bhutan, Cambodia and Laos (Table 3.2).
Woodfuel supply and use generate substantial employment throughout the region. In the Philippines, for example, woodfuel activities are reported to be the main source of income for about 10 percent of rural households, accounting for about 40 percent of their cash earnings, and involving many women. Rapid surveys suggest that per unit of energy, woodfuels offer between 11 and 17 times the employment generated by kerosene; per unit woodfuel employment is also higher than for petroleum gas, coal and electricity. Charcoal has particularly high labour requirements per unit of energy (Table 3.3).
Table 3.2: Consumption of energy types in RWEDP countries, 1993-1994
|
|
Total energy (petajoules) |
Conventional energy (petajoules) |
Woodfuels (petajoules) |
Biomass energy (petajoules) |
Share of woodfuels in total |
Share of biomass in total |
|
Bangladesh |
714 |
210 |
141 |
504 |
20% |
71% |
|
Bhutan |
14 |
2 |
12 |
12 |
86% |
86% |
|
Cambodia |
94 |
14 |
79 |
81 |
84% |
86% |
|
PR of China |
31,256 |
23,866 |
3,290 |
7,390 |
11% |
24% |
|
India |
8,751 |
5,822 |
2,603 |
2,929 |
30% |
33% |
|
Indonesia |
2,796 |
1,978 |
818 |
818 |
29% |
29% |
|
Laos |
47 |
5 |
42 |
42 |
89% |
89% |
|
Malaysia |
994 |
898 |
93 |
96 |
9% |
10% |
|
Maldives |
2 |
1 |
1 |
1 |
55% |
55% |
|
Myanmar |
348 |
77 |
271 |
271 |
78% |
78% |
|
Nepal |
279 |
23 |
192 |
256 |
69% |
92% |
|
Pakistan |
1,984 |
1,066 |
521 |
918 |
26% |
46% |
|
Philippines |
965 |
507 |
298 |
458 |
31% |
47% |
|
Sri Lanka |
174 |
79 |
85 |
95 |
49% |
55% |
|
Thailand |
1,837 |
1,352 |
353 |
485 |
19% |
26% |
|
Viet Nam |
1,076 |
260 |
423 |
816 |
39% |
76% |
|
Total RWEDP |
51,331 |
36,159 |
9,223 |
15,172 |
18% |
30% |
|
RWEDP (without China) |
20,075 |
12,293 |
5,933 |
7,782 |
30% |
39% |
|
RWEDP (without China and India) |
11,324 |
6,471 |
3,330 |
4,853 |
29% |
43% |
Source: RWEDP (1997).
Table 3.3: Estimated employment by fuel type
|
Fuel type |
Amount of fuel per terajoule |
Estimated employment per terajoule energy consumed in person days1 |
|
Kerosene2 |
29 Kilolitre |
10 |
|
LPG2 |
22 Tonnes |
10-20 |
|
Coal3 |
43 Tonnes |
20-40 |
|
Electricity4 |
228 MWh |
80-110 |
|
Fuelwood5 |
62 Tonnes |
110-170 |
|
Charcoal5 |
33 Tonnes |
200-350 |
Source: World Bank/ESMAP (1991).
Notes:
1. Where applicable, employment covers growing, extraction, production, transmission, maintenance, distribution and sales, including reading metres. It excludes employment generated outside the country for fuels that are imported in semi-finished or finished state.2. This assumes that crude oil (for refining), kerosene and LPG are imported.
3. This varies according to capital intensity of the mine, seam thickness, energy value of the coal as well as the distance from demand centres.
4. This varies according to production method ranging from hydro to traditional oil/coal fired units and the efficiency of electricity generation, transmission and distribution.
5. This depends on the productivity of the site, efficiency of producers and distance from the market.
Trends indicate an overall increase in the consumption of woodfuels in RWEDP member countries of about 1.6 percent a year, a pace similar to overall population growth. In several countries, per capita consumption is also increasing.25 A number of demographic, physical, social and economic factors, including population growth, disparity in household size and income, climate and topography are responsible for the continuing growth of woodfuel consumption in the region. However, the growth of conventional fuels has been so fast that woodfuels have lost share progressively and steadily in recent years (Figure 3.2).
25 In fact, consumption per capita is very site-specific and influenced by factors like climate, household size, availability and reliability of supply of the various fuels and their potential substitutes as well as their costs, the appliances required for utilisation, and culture and tradition.
Decades of strong economic growth have increased overall energy consumption tremendously in several countries, particularly consumption of conventional energy. Because many people remain poor even in these rapidly growing economies, however, they have little choice but to continue using the cheapest fuels available - usually woodfuels or other biomass. The "transition" in energy mix has therefore involved not so much substitution of conventional fuels for woodfuels but rather a "complementation." In other words, during development, users consume more of all energy types, including biomass fuels such as wood and residues. Only after incomes pass a certain threshold does household consumption of woodfuels start to decline.
In parallel with the use of woodfuels by households is industrial woodfuel use. With innovations in combustion technologies in recent years, a new trend in energy supply is progressively emerging in favour of bio-energy development. The technology for co-generation of heat and power from biomass for modem applications has received increasing attention in many countries in the region. It has recently captured the attention of planners and policy-makers seeking to promote carbon-neutral renewable energy.
Households dominate woodfuel use in all RWEDP countries, with cooking as the primary end-use (the dominance of cooking as an end-use makes fuelwood issues particularly important for women). In urban areas, even in households, other end-uses may also be significant. In Nepal, cooking consumes 75 percent of all biomass energy, with agro-processing using only 5 percent. Corresponding figures for Bangladesh are about 66 percent and 17 percent. Within the household sector, income is an important determinant of relative energy end-use. In India, for example, for families with monthly incomes below Rp1,000 (US$25), nearly 80 percent of all energy consumed is used in cooking. For families with incomes above Rp6,000 (US$150), the percentage of energy used for cooking drops to only 37 percent.
If they can afford otherwise, users usually prefer to use fuels other than woodfuels or biomass. The pattern in household preferences and switching among energy types lead to a discernible "fuel ladder" (Box 3.18) that consumers seek to climb, according to their economic capacity.
As countries develop, industries become ever more significant energy users. Numerous industries in Asia, including many that are small-scale and based on traditional technologies, rely on biomass fuels for process heat and drying of products. Fuelwood, charcoal and other biomass fuels are extensively used in enterprises such as brick-making, lime production, pottery and ceramics, metal works, textile processing, tea and tobacco processing, preparation of animal feeds, hotels and restaurants, food stalls, etc. Brick-making and lime production are among the most significant users of woodfuels in the region.
|
Box 3.18: THE "FUEL LADDER" The "fuel ladder" concept implies that with socio-economic development, the fuel used by a household will change. Fuel-users consider the top of the ladder more attractive - more convenient, prestigious, efficient, modern or superior in some other way. In South Asia, climbing the fuel ladder generally means changing from dung cakes to crop residues, wood, kerosene, gas, and finally electricity. In Southeast Asia charcoal tends to be very high on the ladder, perhaps even at the top. Climbing up the fuel ladder also implies climbing up a health ladder, given the present stoves and combustion technologies in use in Asia. A variety of factors determine whether or not a household is able to move up the ladder, the main ones being: household income and size, availability and costs of fuel, availability and cost of the required appliances, climate, settlement size and culture and tradition. In the 1980s, it was believed that energy transitions away from wood and biomass were an option - this may still be true for some, but it is now realised that for the majority of Asia's poor it may not be a realistic goal during the horizon of this study. They can, at best, reach the lower rungs of the fuel ladder, which means continued heavy use of woodfuels. Source: Adapted from RWEDP (1997). |
Increasingly, a number of agricultural and wood-based industries in many rapidly industrialising Asian countries (e.g. India, Indonesia, Malaysia, the Philippines, Thailand) are also adopting technologies that produce co-generated bio-energy from residues and wastes, both for in-factory consumption and for commercial sale. Overall, the industrial sector is estimated to account for 10 to 30 percent of all woodfuel use in the region.
Both household and industrial users of woodfuels are largely located in rural areas. However, in some metropolitan cities (e.g. Bangkok, Colombo, Dhaka, Jakarta, Manila and Mumbai), woodfuels contribute significantly to the energy budgets in both the household and industrial/service sectors.
In most RWEDP countries, a majority of the low-income rural households gather fuelwood "for free." The urban poor, however, have little choice but to buy woodfuel in local markets since there are limited opportunities for free gathering of fuelwood in the cities. Rural and urban users of fuelwood exhibit the following contrasts:
· Responsiveness to income level: urban users have a much higher propensity to change their energy mix. In many cases, this includes substituting away from woodfuels after achieving a certain level of income.· Alternative energy sources: in rural areas, the major alternative energy source is biomass, although kerosene is widely used, at least for lighting. In urban areas, a wide selection of energy alternatives exists. Choices are made largely on the basis of income but also are influenced by relative prices of fuels and appliances, efficiency, convenience of use, accessibility and availability.
· Reliance on collected and purchased supplies: rural users generally collect rather than purchase woodfuels and the converse occurs in urban areas. A large part of consumption is not monetised. Specific country estimates26 are for some 60 percent of households (in Pakistan) and 78 percent (in the Philippines) using free fuelwood. In India (1995), about 5 percent of total energy was commercialised in rural areas and over 58 percent in urban areas.27
26 World Bank/ESMAP studies (1991).27 The India case well illustrates rural/urban contrasts: in rural areas, even at high household incomes of Rp18,000 and above (about US$450 in 1997 equivalent), only 10 percent of energy is commercialised while in urban areas, over 37 percent of energy is commercialised even at incomes below Rp3,000 (about US$75 in 1997 equivalent).
· Concentration of demand:28 in urban and peri-urban areas, concentrated demand is rarely matched by adequate local supplies. This leads to longer-distance trade for which charcoal is often more suitable or competitive in terms of transportation costs.
28 Similar shortages can also be observed in rural areas with large concentrations of rural industries (brick and pottery makers, lime burners, sugar palm production, etc.).
These differences suggest that a variety of policy interventions may be necessary to effectively address woodfuel problems in various rural and city situations. In rural areas, local market signals are likely to be weak, at least in the household sector. In urban centres, the income profile is important.
For households, the amount of energy consumed depends on household size and income, types of energy applications being used, efficiencies and costs of devices, and accessibility to fuels. Determinants of accessibility are location, prices of fuels, and physical access to sources and the time needed to collect these fuels (particularly for freely collected wood and other biomass fuels).
The use of wood and other biomass fuels by industries and other enterprises depends on the prices and supply security of these fuels relative to conventional fuels. In Sri Lanka,29 woodfuels have shown demand sensitivity to general economic conditions and to prices of alternative fuels. After the liberalisation of the economy in 1977, for example, the demand for energy increased substantially. In addition, the sharp increase in the price of petroleum products in the 1970s caused many industries to switch from petroleum to fuelwood. As a result, by 1992, fuelwood provided 49 percent of the country's industrial sector energy.
29 Country Report - Sri Lanka: Document APFSOS/WP/16.
Factors that will drive continued or increased use of traded woodfuels include relatively low woodfuel prices, large populations too poor to afford conventional fuels, constraints in the supply of conventional fuels, and increased acceptance of modern wood-energy technologies. Consumption by households and traditional small-scale industries and enterprises is affected by the first three factors. Consumption in modern applications is affected by these first and last factors. In the near term, the bulk of the consumption of traded woodfuels will continue to be in households and traditional industries and enterprises.
At the regional level, and often at national levels (but with significant exceptions), potential woodfuel supplies exceed consumption both at present and in future extrapolations to year 2010. As shown in Table 3.4, woodfuels can come from the forest, other wooded land, trees on agricultural land (and around households themselves), and from land clearing for conversion to other land use (i.e. deforestation).30 For RWEDP countries, deforestation alone (although an unsustainable source) yields almost enough potential woodfuels31 to meet present needs (Table 3.5). Much of the wood from land clearing, however, is generated far from woodfuel demand centres. Consequently, its use for energy is not presently feasible. The most important practical supply sources are non-forest lands. According to studies for seven RWEDP member countries, non-forest areas supply about two-thirds of all woodfuels consumed (Table 3.5). Non-wood biomass, especially crop residues, is a third important source of collectable fuels.
30 Typically, non-commercial sources of woodfuels are located within a 20 km radius of the end-users, and commercial sources within a 100 km radius of the market.32The fact that land clearing may constitute a threat to future supplies, is not of immediate importance to users. Much potential woodfuel is therefore wasted even though there may be a likelihood that supplies will be short in years to come.
Wood residues from industrial logging operations and mill processing and recycled materials from manufactured wood products may also be locally significant sources of woodfuels. Data indicate that as much as 80 percent of all woody biomass harvested in tropical forestry operations ends up as logging or processing residues. 50 percent of tree wood volume is left behind on the felling site (after sawlog extraction), and another 30 percent remains as residue after conventional wood processing (Figure 3.3).
The main factors influencing supply are agro-ecological conditions, climate, physical terrain, land use/tenure policies, local resource management practices, and infrastructure. These factors affect the availability, accessibility and affordability of woodfuels, both in absolute and relative terms. For example, in the Philippines, where wood is relatively abundant, about 86 percent of rural households use predominantly fuelwood to meet energy needs. Conversely, in the People's Republic of China, fuelwood accounts for less than 35 percent of rural household energy, with crop residues providing more than 40 percent of household consumption.
Competition for wood supplies between woodfuel users and other wood users can influence woodfuel supply availability. Non-wood biomass fuels also have other competing uses such as animal fodder, soil conditioners, or raw material for paper and pulp.
Table 3.4: Indicative sources of fuelwood used in various RWEDP member countries
|
Country |
Year and sector |
Tonnes (in million) |
Forest land1 (% of total) |
Other land2 (% of total) |
Public land3 (% of total) |
Unknown(% of total) |
|
Bangladesh4 |
1981, HH and Ind. |
5.5 |
13 |
87 |
- |
- |
|
India5 |
1996, HH |
162 |
51 |
49 |
- |
- |
|
Indonesia6 |
1989, Urban HH |
0.5-1.0 |
6 |
65 |
- |
29 |
|
Nepal7 |
1995/96, HH |
6.9 |
73 |
27 |
- |
- |
|
Pakistan8 |
1991, HH |
29.4 |
12.6 |
84.1 |
- |
3.3 |
|
Philippines9 |
1989, HH |
18.3 |
13.7 |
86.3 |
- |
- |
|
Sri Lanka10 |
1993, HH and Ind. |
9.2 |
11 |
75 |
- |
14 |
|
Thailand11 |
1992, Rural HH |
5.74 |
- |
56 |
37 |
7 |
HH = Households
Ind. = Industry
1 Forest land includes forest plantations as well.
2 Other land is mainly own land, neighbours'land, common land.
3 Public land may include forest.
4 Government of Bangladesh (1987).
5 Ministry of Environment & Forests, 1996.
6 World Bank/ESMAP (1990).
7 WECS(1997).
8 World Bank/ESMAP and UNDP (1991).
9 World Bank/ESMAP (1991).
10 Ministry of Agriculture, Lands and Forestry (1995).
11 RFD(1993).Source: RWEDP (1997), Table 4.2.
In the past, forests were assumed to be the main, sometimes the sole, source of woodfuels, to the point where non-forest trees were often ignored in supply assessments. This lack of recognition of non-forest wood was a key reason for overstating the potential severity of fuelwood shortages and for spawning the so-called "gap-theory" which suggested that fuelwood supplies were inadequate to meet demand. Subsequent studies by RWEDP and others have shown this theory to be unfounded since about two-thirds of woodfuels originate from trees outside forests. In the Philippines, for example, a household energy survey revealed 85 percent of fuelwood coming from trees outside forests. The importance of non-forest trees in supplying fuelwood is amply demonstrated in some countries and territories (e.g. Bangladesh, Pakistan, Java, Sri Lanka, and many parts of India, Thailand and the People's Republic of China) that have less than 10 percent forest cover but still consume large volumes of locally produced fuelwood (Box 3.19).
Table 3.5: National fuelwood supply (potential/demand balances for selected countries (in kilotons [Kt]), 1994
|
|
RWEDP countries |
Malaysia |
Indonesia |
The People's Republic of China |
Thailand |
India |
Bangladesh |
Pakistan |
||||||||
|
Kt |
Index* |
Kt |
Index |
Kt |
Index |
Kt |
Index |
Kt |
Index |
Kt |
Index |
Kt |
Index |
Kt |
Index |
|
|
CONSUMPTION |
645,895 |
100 |
6,187 |
100 |
54,474 |
100 |
219,122 |
100 |
46,069 |
100 |
173,412 |
100 |
9,396 |
100 |
34,687 |
100 |
|
POTENTIAL SUPPLY, BY SOURCE: |
||||||||||||||||
|
Wood: |
||||||||||||||||
|
Forest |
669,812 |
103 |
31,737 |
513 |
183,106 |
336 |
235,541 |
107 |
12,741 |
28 |
85,695 |
49 |
1,765 |
19 |
1,960 |
6 |
|
Agricultural land |
601,407 |
93 |
17,809 |
288 |
67,744 |
124 |
288,700 |
132 |
23,243 |
50 |
125,323 |
72 |
5,593 |
60 |
15,371 |
44 |
|
Other wooded land |
53,994 |
8 |
- |
- |
6,673 |
12 |
15,957 |
7 |
- |
- |
5,150 |
3 |
215 |
2 |
640 |
2 |
|
From deforestation |
605,565 |
94 |
87,754 |
1,418 |
181,526 |
333 |
58,347 |
27 |
31,046 |
67 |
18,999 |
11 |
1,426 |
15 |
4,598 |
13 |
|
Sub-total woodfuel |
1,930,778. |
299 |
137,301 |
2,219 |
439,049 |
806 |
598,546 |
273 |
67,030 |
145 |
235,167 |
136 |
8,999 |
96 |
22,569 |
65 |
|
Wood only: balance |
1,284,883 |
199 |
131,114 |
2,119 |
384,575 |
706 |
379,424 |
173 |
20,961 |
45 |
61,755 |
36 |
-397 |
-4 |
-12,118 |
-35 |
|
Crop processing residues (50%): |
218,915 |
34 |
2,470 |
40 |
20,421 |
37 |
78,003 |
36 |
10,863 |
24 |
70,267 |
40 |
5,606 |
60 |
7,806 |
22 |
|
Total supply |
2,149,693 |
333 |
139,771 |
2,259 |
459,470 |
843 |
676,549 |
309 |
77,893 |
169 |
305,434 |
176 |
14,602 |
155 |
30,375 |
88 |
|
OVERALL BALANCE |
1,503,798 |
233 |
133,584 |
2,159 |
404,996 |
743 |
457,427 |
209 |
31,824 |
69 |
132,022 |
76 |
5,206 |
55 |
-4,312 |
-12 |
* Index, where 1994 consumption = 100.Source: Adapted from RWEDP, Section 8.1 tables (1997).
Figure 3.3: From standing tree to kiln-dried sawnwood
Source: RWEDP, Field Document No. 50, Figure 4 (1997).
|
Box 3.19: FUELWOOD SOURCES IN INDIA In recent times India has banned commercial fuelwood collection from natural forests. Even without this formal ban, however, surveys show that, between 1978-1979 and 1992-1993, the proportion of rural households collecting fuelwood from forests has halved from 35 percent to 17 percent, while those collecting fuelwood from their own farms increased to almost half. Stocks of non-industrial tree plantations and social/community and agroforestry development programmes have also been boosted through massive participatory tree planting in recent decades. Increasingly, however, trees (especially plantations) originally planted to provide woodfuels are being utilised as industrial wood. Nonetheless, non-forest sources are increasingly dominating the supply of woodfuels. |
Potential supply/demand balances for woodfuels are presented in Table 3.5 for countries selected to represent a range of forest endowment levels. The balances are necessarily crude, as they are based on aggregated national data that sometimes mask local shortages. Nonetheless, several salient points emerge:
· in any given country, woodfuels can come from a range of sources, from forest and non-forest areas as well as from inventoried and non-inventoried sources;· wood "salvaged" from land-clearing (i.e. deforestation) can be enough to cover all present fuelwood needs in some countries, particularly in highly forested countries;
· crop residues, even at a 50 percent recovery rate, are an important potential fuel source; and
· all countries except Pakistan appear to have adequate potential supplies of biomass fuels; distribution and accessibility are the limiting factors.
The main policy challenge for wood-energy development in Asia is to ensure continuous improvement in the technical viability, economic efficiency and environmental sustainability of woodfuel use. The broad policy areas that need to be addressed include:
· improving the information base for wood energy
· improving the functioning of woodfuel markets
· developing wood-energy strategies
· strengthening wood-energy planning capabilities
Improving the information base for wood energy: Basing policies on highly aggregated data and speculation about the driving forces behind the demand and supply of woodfuels and the responses to fuelwood shortages is a prescription for failure. In most cases, the current level of information does not allow for accurate assessment of the economic benefits and costs of various fuelwood policy options. Clearly, the dearth of quality information in nearly all aspects of the household energy front must be addressed if greater woodfuel policy success is to be achieved.
Improving the functioning of woodfuel markets: Past fuelwood policies have all too often focused on symptoms rather than the underlying causes. Market and policy failures often produce situations in which benefits are disassociated from costs, prices from scarcity, rights from responsibilities and actions from consequences. For example, open-access forests encourage wood producers to shift the costs of over-exploitation to future generations. Similarly, policies that distort prices act as disincentives to improved efficiency and conservation, and result in non-optimal fuel mixes. The key market and policy failures are inappropriate property rights, incorrectly priced resources, policy-induced price distortions in capital, labour and commodity markets and over-valued currencies.
Developing wood-energy strategies: Fuelwood policies need to be co-ordinated through fuelwood sector strategies that effectively address specific local fuelwood problems and opportunities. Such strategies will determine the appropriate technical packages for managing existing fuelwood supplies, enhancing supplies through increased production, managing demand through conservation initiatives, guiding fuel-switching policies, and improving the efficiency of fuelwood use. They will also provide a structure for prioritising efforts and co-ordinating the activities of planning agencies and local communities.
Strengthening wood-energy planning capabilities: Clear woodfuel policies and strategies are of limited usefulness if local institutions lack the capacity to implement them. This is clearly the case in many areas, in part reflecting the inherently cross-sectoral nature of fuelwood issues. This problem of co-ordination is exacerbated by a lack of effective channels for the involvement of local people in planning and implementing wood-energy programmes.
Wood-energy development faces several other challenges, as outlined below:
Social challenges are primarily related to the low socio-economic status of the majority of traditional woodfuels users. Since woodfuel users are largely outside formal markets, they attract little attention from policy-makers and investors. Furthermore, few traditional woodfuel users own land that can be allocated for woodfuel production. Chronic hunger for land for agriculture tends to further marginalise users from fuel supplies. Thus opportunities to increase woodfuel supplies are often limited to community and public wastelands, which are frequently saddled with numerous competing interests.
Technological challenges are primarily associated with making improved combustion and conversion systems (e.g. briquettes, gasification, pyrolysis, co-generation, etc.) more affordable and accessible. Research and development in the areas of biomass fuel production and use have not received attention commensurate with their application in the region although progress has been made with regard to improved (fuel-saving) stoves, gasification and co-generation.
Institutional challenges relate to non-existent or ambiguous government policies for bio-energy development and undefined roles for the private sector. Information flows on bio-energy development are inadequate because institutional arrangements are weak at country, regional and global levels. There are no dedicated systems for the collection and analysis of wood-energy data. Extension and support services, and incentive/credit facilities for wood and non-wood energy development are weak or non-existent in most countries.
Legislative and regulatory challenges stem from the fact that existing policies and legislation in forestry, agriculture and energy are often not conducive for developing wood energy. Constraints on land and tree tenure land still prevail in addition to many restrictions on production, flow and utilisation of wood and woodfuel from non-forest sources. Many country policies discourage wide-scale application of woodfuels in industries, under misperceptions that it will lead to deforestation and environmental pollution.
Technological advances (such as fuel preparation, co-generation, combustion and gasification) have allowed woodfuels to become a modem and accepted fuel for industry and power generation in many industrialised countries. Particularly notable is the indirect use of wood energy in recovery of waste pulping liquors in the pulp industry. However, the applications are still limited in many countries of Asia where further extension effort may be required. There is a predominant perception throughout the Asia-Pacific region that wood is only a subsistence fuel that will eventually be phased out. This expectation is unlikely to materialise within the horizon of this outlook study and long beyond it.
Rural people have been the main users of woodfuel in the past and they will remain so in the future. Irrespective of national energy policies, however, many urban poor will also continue to depend heavily on woodfuels, although there will likely be a greater shift to charcoal use compared with present consumption patterns. With ongoing trends toward strengthening market mechanisms and widening gaps in income distribution, an increasing number of traditional woodfuel consumers (both households and industries) are likely to be further marginalised. Therefore, enhancement of woodfuel supplies in rural areas where fuelwood is not traded, but where people's reliance on it is heavy, is an issue that may require attention by national governments.
The findings of this study do not support the widely held assumption that increases in conventional energy consumption are accompanied by decreases in wood-energy consumption. On the contrary, as economies grow, there is a tendency for all energy types to be consumed in greater quantities, at least initially. Planning should take this into account.
Co-generation technologies are generally mature and ready for application by industries in the region. Considerable promotional effort is needed, however, to encourage their broad acceptance. For more advanced technologies (e.g. wood-based liquid fuels), there is still room for technological development, followed by assessment of their competitiveness with other fuels. If major breakthroughs can be made, they could change the future scenario in favour of wood but this is unlikely within the outlook period to 2010. Technological breakthroughs alone, however, are insufficient - there will also be a need for substantial policy and institutional shifts which would make these new fuels competitive with those that are now in the industrial mainstream.
Finally, in all aspects of wood-energy development, a sustained effort is needed to bring about attitudinal changes that recognise the renewable and carbon-neutral characteristics of woodfuels and place woodfuels on equal footing with conventional fuels. This will be a major task considering the enormous advantages of conventional fuels with regard to convenience, proven and known technologies, modest costs per unit of energy, and well-functioning supply lines.
32 Throughout Section 3.5, data for Taiwan Province of China are incorporated in data for China. Consequently, information for Taiwan Province of China is incorporated in the North Asia sub-region, and not in the Newly Industrialising Economies group.
One of the defining trends in world forestry during the past 30 years has been the enormous growth in production and consumption of industrial wood products in the Asia-Pacific region. Particularly impressive has been the speed with which the region has emerged as a dominant consumer of wood products. In 1970, Asia and the Pacific was the third-largest regional consumer of wood-based panels and paper and paperboard (behind North America and Europe, respectively) and the fourth-largest consumer of sawn timber (behind the USSR, North America and Europe). Asia-Pacific consumption of wood products was roughly 70 percent that of North America and 80 percent that of the USSR and Europe. For paper products, the Asia-Pacific region's consumption was 50 percent that of Europe and only 38 percent that of North America.
During the past 25 years the Asia-Pacific region has increased dramatically in importance as a consumer of forest products. The region now surpasses Europe in the consumption of all major wood products, and trails only North America in the consumption of sawn timber and paper and paperboard. 1995, Asia-Pacific's consumption of all wood products was 72 percent of that of North America, while for paper and paper products the proportion had more than doubled to 82 percent.
The Asia-Pacific industrial forestry sector has expanded considerably in the past two decades, with marked increases in production, consumption and trade in all forest products. This trend is reflected by the fact that production and consumption of industrial roundwood has increased 51 percent and 54 percent, respectively, during the past 25 years. The increase in total wood consumption in the region accounts for half of the global increase in wood consumption over the past two and half decades.
It is apparent that the overall increase in the production of wood products has been demand-driven, with the key influences being increasing population and increasing wealth. Between 1980 and 1995, population in the Asia-Pacific region increased 29 percent. Wealth in the region, measured by real per capita GNP, increased 40 percent during the same period, although growth was not evenly distributed across the region.
Consumption of a number of forest products, notably wood-based panels, fibre-furnish and paper and paperboard, has outpaced both economic and population growth (Figure 3.4). Notably, however, total consumption of industrial roundwood grew slower than per capita GDP or population.
Three key underlying trends are important to note:
· Relative stagnation of sawn timber consumption, especially in comparison to panel products: There are several possible reasons behind this decline. The first reason is the increased substitution of wood-based panels for traditional sawn timber applications (e.g. the use of veneered fibreboard in furniture and joinery). The second reason is that the rapidly developing countries of Southeast Asia appear to have different building preferences than those which drove high consumption rates in more developed countries (e.g. a dominance of concrete apartments over wooden houses). Finally, the increasing scarcity of large diameter logs suitable for cost-competitive sawing may be encouraging a shift toward engineered wood products and other non-wood alternatives.· Improved roundwood utilisation'. This trend is evident when changes in the consumption of industrial roundwood are compared with the growth in the production of downstream wood products. Even allowing for increased imports into the region, roundwood is clearly being used more efficiently. This is due to higher mill conversion efficiencies, better utilisation of wood residues, increased production of reconstituted wood panels, and increased use of recycled fibre to supplement virgin fibre in paper manufacturing.
· Growth of wood products consumption has been markedly greater in developing countries than in developed countries: The AIEs have increased consumption of all products at a slower rate than all other groups of countries (with the exception of the Pacific Islands' consumption of fibre-furnish and paper and paperboard, which was slower than that of the AIEs). Consumption of industrial roundwood and sawn timber in the AIEs actually declined between 1980 and 1995, due to consumption reductions in Japan.
Figure 3.4: Changes in consumption of wood products in Asia-Pacific, 1980-1995
Sources: FAO Forest Products Yearbook; FRA 1990; FAO Provisional Outlook for Global Forest Products to 2010 (1997).
Apparent per capita consumption is summarised in Table 3.6. The data confirm the marked growth in consumption of panel products, fibre-furnish and paper, but relatively stagnant or declining per capita consumption of industrial roundwood and sawn timber.
Per capita consumption of forest products in AIEs is more than twice that in NIEs. Even greater disparity exists between AIEs and countries in other groups. However, the rate of growth in consumption by the AIEs, particularly for solid wood products, is markedly less than in other countries, especially in NIEs and the North Asia countries (Box 3.20). The gap between industrialised and developing countries is therefore declining and is likely to continue to decline. While wood scarcity and traditional patterns of wood use will constrain most developing countries from achieving consumption rates approaching those of the AIEs within the foreseeable future, AIE consumption rates provide an indication of the potential overall forest products demand in Asia and the Pacific.
|
Box 3.20: CASE STUDY OF THE REPUBLIC OF KOREA - INDUSTRIALISATION AND WOOD PRODUCTS CONSUMPTION Rapid industrialisation and economic growth has been a key trend in several Asia-Pacific countries over the past decade. The Republic of Korea has been at the forefront of this development. Korea therefore provides a good indication of likely developments in other rapidly developing countries, particularly countries such as Thailand and the Philippines, which are similarly dependent on wood imports. Consumption patterns for solid wood products in the Republic of Korea The Republic of Korea's per capita GNP has increased by an average of 11 percent annually since 1980. A measure of changing preferences and tastes as the country has become increasingly developed is illustrated by changing consumption patterns for wood products. Only in the consumption of more processed forest products, such as wood-based panels, pulp, paper and paperboard, has growth matched overall economic growth. Industrial roundwood consumption increased by only 50 percent in the period 1980-1994, while sawn timber consumption increased by 60 percent. Korean consumption of industrial wood has shifted markedly toward coniferous logs over the past decade. Consumption of coniferous logs has doubled, while consumption of hardwood logs has declined by 37 percent. However, consumption of non-coniferous sawn timber has remained largely static as a result of steady substitution of Korean production by sawn timber imports from Southeast Asia. Korean plywood production has similarly declined, offset by an increase in plywood imports. It is notable that the marked growth the consumption of coniferous logs has not been matched by consumption growth in sawn timber. Rather, in keeping with global trends in economic development, Korea's focus has moved toward production of capital-intensive paper and paperboard, which has increased threefold in the past decade. Graph Source: FAO Forest Products Yearbook, Adaptation, B. I. Yoo (1997). Document APFSOS/WP/06. |
Table 3.6: Apparent consumption of wood products (per thousand capita)
|
|
Industrial roundwood (m3) |
Sawn timber (m3) |
Panel products (m3) |
Fibre-furnish (MT) |
Paper and paperboard (MT) |
|||||
|
1980 |
1995 |
1980 |
1995 |
1980 |
1995 |
1980 |
1995 |
1980 |
1995 |
|
|
AIEs |
779 |
636 |
356 |
292 |
85 |
100 |
100 |
224 |
151 |
234 |
|
South Asia |
25 |
23 |
13 |
16 |
0.4 |
0.4 |
1 |
3 |
2 |
3 |
|
Southeast Asia |
177 |
162 |
39 |
32 |
7 |
9 |
6 |
14 |
6 |
17 |
|
NIEs |
245 |
220 |
82 |
104 |
33 |
112 |
17 |
125 |
59 |
160 |
|
North Asia |
89 |
81 |
22 |
22 |
1 |
9 |
5 |
28 |
7 |
24 |
|
Oceania |
265 |
295 |
70 |
54 |
7 |
22 |
0 |
0 |
5 |
5 |
|
TOTAL |
118 |
99 |
41 |
35 |
7 |
12 |
9 |
27 |
14 |
27 |
Source: FAOSTAT; FRA 1990; 1996 Provisional Forest Products Outlook.
Table 3.7 presents overall trends in the production and consumption of major wood products in the region from 1970 to 1995. The data suggest extensive gains in processing efficiency have been achieved throughout the region. Comparing industrial roundwood consumption in each sub-region with production of processed products shows that, in general, more products are now being produced with less raw material (i.e. growth in processed product output has surpassed growth in roundwood consumed). Technology improvements apparently have filtered throughout the region. Nonetheless, an important countervailing trend is toward less-efficient processing carried out in less-developed countries. For example, production of sawn timber in the AIEs declined by 35 percent (largely as a result of declining Japanese production) between 1970 and 1995, while production increased substantially in several less-developed countries, presumably using less efficient technology.
Historically, a small number of countries have dominated the production of wood products in Asia and the Pacific. Raw material supplies have generally been secured from a small number of forest-rich countries, although the list of suppliers has shifted over the years. Processing has similarly been concentrated, although production of certain products tends to be concentrated in developed countries while others are produced primarily by developing countries. For example, paper and paperboard production is mainly carried out in highly developed, capital-rich countries, while sawn timber is generally produced in less developed countries with low labour costs. In 1995, the five largest producer countries for each commodity accounted for:
· 78 percent of industrial roundwood production in the region;
· 83 percent of sawnwood production in the region;
· 87 percent of wood-based panels production in the region;
· 91 percent of total fibre-furnish production in the region; and
· 82 percent of paper and paperboard production in the region.
Industrial roundwood
Industrial roundwood production is highest in North Asia (particularly the People's Republic of China, which produces nearly a third of all industrial roundwood in the region), Southeast Asia (predominantly Indonesia and Malaysia), and the AIEs. A key trend not readily apparent from Table 3.7 is the major increase in roundwood production in Oceania, particularly increased softwood harvests in New Zealand. Most of this increase is being exported to North Asian markets where considerable substitution of softwood logs for hardwood logs (previously imported mostly from Southeast Asia) has occurred.
Consumption of industrial roundwood is greatest in North Asia, the AIEs, and Southeast Asia. Apparent consumption of industrial roundwood in Southeast Asia has increased 15 percent since 1987, mainly as a result of Malaysian and Indonesian logs being processed in-country rather than exported in raw form.
Table 3.7: Trends in production and consumption of wood products in Asia-Pacific
|
PRODUCTION |
Fuelwood and charcoal (1,000m3) |
Industrial roundwood (1,000m3) |
Sawnwood (1,000m3) |
|||||||||
|
1970 |
1980 |
1990 |
1995 |
1970 |
1980 |
1990 |
1995 |
1970 |
1980 |
1990 |
1995 |
|
|
AIEs |
6,122 |
2,029 |
3,267 |
3,308 |
64,743 |
59,647 |
58,460 |
59,318 |
48,236 |
42,406 |
35,130 |
31,134 |
|
NIEs |
7,739 |
6,730 |
4,857 |
4,901 |
1,888 |
2,196 |
1,988 |
1,994 |
2,126 |
3,614 |
4,373 |
3,906 |
|
South Asia |
210,201 |
263,321 |
328,490 |
360,308 |
15,538 |
22,704 |
28,942 |
28,465 |
5,100 |
11,458 |
19,604 |
19,448 |
|
Southeast Asia |
175,735 |
221,063 |
270,208 |
295,091 |
54,466 |
81,626 |
94,238 |
86,119 |
8,685 |
15,578 |
21,462 |
18,030 |
|
North Asia |
131,366 |
159,651 |
193,188 |
208,682 |
43,594 |
80,842 |
92,823 |
94,581 |
15,315 |
21,760 |
23,949 |
25,571 |
|
Pacific Islands |
4,390 |
5,609 |
5,802 |
5,802 |
886 |
2,334 |
3,371 |
4,648 |
187 |
350 |
261 |
364 |
|
TOTAL |
535,553 |
658,403 |
805,812 |
878,092 |
181,115 |
249,349 |
279,822 |
275,125 |
79,649 |
95,166 |
104,779 |
98,453 |
|
PRODUCTION |
Wood-based panels (1,000m3) |
Total fibre-furnish (1,000MT) |
Paper and paperboard (1,000MT) |
|||||||||
|
1970 |
1980 |
1990 |
1995 |
1970 |
1980 |
1990 |
1995 |
1970 |
1980 |
1990 |
1995 |
|
|
AIEs |
9,018 |
11,446 |
10,303 |
9,295 |
14,446 |
20,012 |
28,241 |
29,436 |
14,487 |
20,192 |
30,856 |
32,819 |
|
NIEs |
1,154 |
2,314 |
1,903 |
2,532 |
293 |
1,303 |
2,993 |
4,179 |
331 |
1,740 |
4,684 |
7,245 |
|
South Asia |
267 |
326 |
502 |
482 |
842 |
1,243 |
2,452 |
2,645 |
974 |
1,118 |
2,546 |
3,649 |
|
Southeast Asia |
1,465 |
3,033 |
11,590 |
17,341 |
214 |
699 |
1,678 |
3,913 |
217 |
1,010 |
2,908 |
7,258 |
|
North Asia |
937 |
2,299 |
2,976 |
14,780 |
4,167 |
6,47 |
19,684 |
35,530 |
3,036 |
6,947 |
17,408 |
33,593 |
|
Pacific Islands |
19 |
31 |
62 |
30 |
0 |
0 |
0 |
0 |
0 |
0 |
0 |
0 |
|
TOTAL |
12,860 |
19,449 |
27,336 |
44,460 |
19,962 |
29,729 |
55,048 |
75,703 |
19,045 |
31,007 |
58,402 |
84,564 |
|
CONSUMPTION |
Fuelwood and charcoal (1,000m3) |
Industrial roundwood (1,000m3) |
Sawnwood (1,000m3) |
|||||||||
|
1970 |
1980 |
1990 |
1995 |
1970 |
1980 |
1990 |
1995 |
1970 |
1980 |
1990 |
1995 |
|
|
AIEs |
6,219 |
2,141 |
3,819 |
3,596 |
108,476 |
105,495 |
97,812 |
93,065 |
51,912 |
48,237 |
44,955 |
42,855 |
|
NIEs |
7,992 |
6,945 |
4,793 |
5,220 |
7,249 |
9,925 |
12,556 |
11,888 |
1,692 |
3,327 |
5,065 |
5,801 |
|
South Asia |
210,203 |
263,161 |
328,483 |
360,326 |
15,519 |
22,607 |
30,304 |
28,942 |
5,145 |
11,564 |
19,670 |
19,522 |
|
Southeast Asia |
175,133 |
220,368 |
269,988 |
293,683 |
24,951 |
48,404 |
75,713 |
77,467 |
6,958 |
10,713 |
16,628 |
15,557 |
|
North Asia |
131,366 |
159,651 |
193,188 |
208,741 |
45,063 |
88,723 |
99,927 |
98,911 |
15,210 |
21,855 |
24,922 |
27,741 |
|
Pacific Islands |
4,390 |
5,609 |
5,802 |
5,802 |
464 |
1,283 |
1,681 |
1,941 |
210 |
316 |
265 |
355 |
|
TOTAL |
535,303 |
657,875 |
806,073 |
877,368 |
201,722 |
276,437 |
317,993 |
312,214 |
81,127 |
96,012 |
111,505 |
111,831 |
|
CONSUMPTION |
Wood-based panels (1,000m3) |
Total fibre-furnish (1,000MT) |
Paper and paperboard (1,000MT) |
|||||||||
|
1970 |
1980 |
1990 |
1995 |
1970 |
1980 |
1990 |
1995 |
1970 |
1980 |
1990 |
1995 |
|
|
AIEs |
8,950 |
11,559 |
13,784 |
14,734 |
15,501 |
21,861 |
31,034 |
32,501 |
14,399 |
20,405 |
31,569 |
34,357 |
|
NIEs |
293 |
1,327 |
3,266 |
6,062 |
371 |
1,867 |
4,839 |
6,952 |
756 |
2,383 |
5,940 |
8,867 |
|
South Asia |
266 |
347 |
515 |
486 |
885 |
1,304 |
3,013 |
3,170 |
1,160 |
1,525 |
2,927 |
4,263 |
|
Southeast Asia |
926 |
1,784 |
1,714 |
4,542 |
354 |
1,141 |
2,801 |
6,364 |
788 |
1,734 |
3,934 |
8,251 |
|
North Asia |
348 |
1,465 |
5,011 |
18,902 |
4,331 |
7,408 |
22,078 |
39,363 |
3,052 |
7,438 |
18,071 |
35,175 |
|
Pacific Islands |
32 |
28 |
69 |
142 |
0 |
0 |
0 |
0 |
11 |
22 |
26 |
30 |
|
TOTAL |
10,815 |
16,510 |
24,359 |
44,868 |
21,442 |
33,581 |
63,765 |
88,350 |
20,166 |
33,507 |
62,467 |
90,943 |
Source: FAOSTAT.
Sawnwood
Total production of sawnwood in the region has declined about 6 percent since 1987, while consumption has increased slightly. The People's Republic of China, Japan and India remain the largest producers. Production has declined in the AIEs (though only in Japan), NIEs, North Asia and Southeast Asia since 1987, while consumption in the NIEs and Southeast Asia has increased. Production and consumption in South Asia and the Pacific Islands have remained roughly in balance. The net effect is a deficit of about 13 million cubic metres of sawntimber region-wide. It is quite possible, however, that, rather than major increases in sawn timber being used for domestic end-uses, it is largely being remanufactured into more processed products like joinery, mouldings, and tongue-and-groove sawnwood, which are then exported. In some instances, where additional processing is carried out merely to avoid regulatory curbs, export restrictions may well be promoting inefficiencies.
|
Box 3.21: CASE STUDY - DEVELOPMENT OF THE PLYWOOD INDUSTRY IN INDONESIA One of the most interesting policy initiatives in the Asia-Pacific forestry sector has been the push to develop the Indonesian plywood industry. It provides a classical example of an interventionist approach to developing a wood-processing industry, thereby enabling a developing country to capture employment and export values through domestic processing; In 1973, Indonesia produced only 19,000 cubic metres of plywood from two mills. While the industry grew steadily throughout the 1970s it was not until 1980, when the government implemented a regulation phasing out log exports and instructing forest concession holders to build processing facilities, that the country began actively targeting export markets for plywood. At the same time, the government recognised that a rapid expansion in plywood production could easily see importers pitting Indonesian exporters against one another to depress prices. Consequently, export licences, export quotas and a Joint Marketing Board were established to enable greater leverage and regulation in establishing prices. Up until 1990, special export incentives were also paid to exporters to encourage the development of new markets. The Indonesian approach in developing the plywood industry aligns with the protectionist side of the policy coin. It argues that industries require critical mass to attract infrastructure and to achieve product acceptance before they can compete in international markets. In the Indonesian case, initial government support enabled the infant plywood industry to achieve a dominant position in global plywood markets. The flip side of the coin argues that protectionism equates with inefficiency. A protected industry is effectively guaranteed profitability by imposing costs on other sectors of the economy. For example, a log-export ban reduces the selling opportunities of forest owners, thereby reducing forest profitability and the incentives for forest management and reafforestation. Furthermore, it encourages the establishment of less efficient mills that are uncompetitive on a level global playing field. Both sides of the policy debate can draw ammunition from the Indonesian example. In 1995, Indonesia produced 9.5 million cubic metres of plywood, of which more than 8 million cubic metres were exported at a value of US$3.8 billion. The vast majority of Indonesia's wood harvest is now processed onshore. Log exports have declined from 20 million cubic metres in 1978, to a half-million cubic metres in 1994. Conversely, Indonesia has persisted with a log export ban but no known assessment has been made to show whether this suggests that Indonesian processors are currently still unable to compete with complete effectiveness against offshore processing facilities. It may well be that this is the case and, therefore, Indonesia's forests are not realising their true economic worth. Current reform agreements with the IMF may lead to liberalisation of markets and should lead to log prices that better reflect international levels. The Indonesian industry can retain profitability in this new environment by ensuring that it is, or becomes, at least as efficient as the competition. |
Panels
Growth in the consumption and production of panel products has been the most spectacular trend in the Asia-Pacific region over the past decade. North Asia, Southeast Asia and the AIEs dominate production, with the People's Republic of China, Indonesia (Box 3.21) and Japan being the largest individual producers. Rapid growth in Chinese production of plywood accounts for most of the increased production (and consumption) in North Asia since 1990, although caution is needed in interpreting the data for the People's Republic of China (Box 3.22). During the same period, Japanese production declined significantly, replaced largely by imports of plywood from Indonesia. Similarly, production declined in the Republic of Korea, although imports (primarily from Indonesia) allowed the country to increase its consumption of wood-based panels nearly threefold between 1991 and 1995.
|
Box 3.22: THE PEOPLE'S REPUBLIC OF CHINA AND REGIONAL ESTIMATES OF PANEL PRODUCTION No one disputes that panel production has increased dramatically in Asia and the Pacific over the past 25 years. Future projections of regional production must be made with utmost caution, however, because of the great sensitivity of the data from the People's Republic of China. Because Chinese panel production is so large, misinterpretation of the statistics from China can be very misleading. Statistics from China account for nearly all of the recently reported panel production increases in the region. However, the apparent rapid expansion of production is more a reflection of changes in reporting than actual production increases. Previously, panel production outside the state-owned enterprises in China was largely unreported in official statistics. In recent years, however, statistics on this outside production have been brought into the system. By suddenly entering into official statistics (particularly between 1994 and 1995), this production can lead to misinterpretation, suggesting much more rapid production increases than is actually occurring. Extrapolating this one-off statistical anomaly could lead to serious overestimation of future production growth. |
|||||
|
Panel type |
Production (1,000m3) |
||||
|
1990 |
1994 |
1995 |
Change 1994-1995 |
||
|
Plywood |
758.7 |
2,606.2 |
7,592.6 |
4,986.4 |
(191%)* |
|
Particleboard |
428.0 |
1,682.0 |
4,351.0 |
2,669.0 |
(159%) |
|
Medium-density fibreboard |
86.9 |
289.2 |
536.9 |
247.7 |
(86%) |
|
Hardboard |
992.9 |
1,508.3 |
1,131.6 |
- 376.7 |
(-25%) |
|
Total |
2,266.5 |
6,085.7 |
13,612.1 |
7,526.4 |
(124%) |
|
Source: Lu Wenming: Document APFSOS/WP/38(b). * = Change 1995-1994 as a percentage of 1994 production. The recorded increase from 1994 to 1995 for plywood alone was nearly three-fold. For particleboard, the recorded increase was 250 percent. For all panels combined, the reported 1995 production was more than double that of 1994. It is clear that 1995 must be treated as a new baseline year for production statistics for China. Simple trend extrapolations cannot be used until such time as a new series of production statistics has emerged from the new base. In the meantime, more complex analyses will be required to draw conclusions about Chinese production developments. Source: Data from Lu Wenming (1997). Study on China's wood based panel market -outlook for the years 2000-2010: Document APFSOS/WP/38(b). FAO, Rome/Bangkok. |
|||||
Southeast Asia consumes only about a quarter of its own wood-based panel output. The bulk of the remainder is exported to North Asia and Japan (Table 3.8). Indonesian is the dominant Southeast Asian producer, although Malaysia has also developed a large plywood and veneer sector.
Region-wide, the plywood industry is no longer expanding. This reflects the diminishing supply of large hardwood peeler logs and the fact that medium-density fibreboard (MDF) and oriented-strandboard (OSB) are replacing plywood for many uses. In the future, OSB, which has captured a significant proportion of the market share previously held by plywood in North America, can be expected to become more important in Asia and the Pacific as well.
In India and the People's Republic of China, non-wood raw materials are significant inputs into panel manufacturing. Both countries make woven bamboo mat board, which substitutes for plywood in many applications. In India, more than 8 percent of all particleboard is now made from non-wood raw materials, primarily bagasse. Even more interesting, for new particleboard manufacturing capacity under construction, more than 65 percent will use bagasse; another 14 percent will use rice straw. Only 14 percent of new capacity will depend on wood as a raw material. Similarly, for fibreboard, for new capacity under construction, cotton stalks will be the raw material input for 24 percent, with straw supplying another 14 percent.
Table 3.8: Production and trade in wood-based panels relative to apparent consumption for major Asia-Pacific importers and exporters, 1995
|
|
Production |
Imports |
Exports |
Apparent net consumption (ANC) |
||||
|
1,000m3 |
%ANC |
1,000m3 |
%ANC |
1,000m3 |
%ANC |
1,000m3 |
%ANC |
|
|
The People's Republic of China |
13,936 |
86 |
2,606 |
16 |
237 |
1 |
16,305 |
100 |
|
- Hong Kong SAR, China |
50 |
12 |
1,283 |
308 |
917 |
220 |
416 |
100 |
|
Japan |
7,340 |
54 |
6,367 |
46 |
0 |
0 |
13,707 |
100 |
|
Republic of Korea |
2,023 |
53 |
1,898 |
50 |
117 |
3 |
3,804 |
100 |
|
Australia |
1,556 |
97 |
252 |
16 |
205 |
13 |
1,603 |
100 |
|
Philippines |
416 |
91 |
112 |
24 |
70 |
15 |
458 |
100 |
|
Singapore |
65 |
21 |
601 |
190 |
350 |
111 |
316 |
100 |
|
IMPORTERS TOTAL |
25,386 |
69 |
13,119 |
36 |
1,896 |
5 |
36,609 |
100 |
|
Indonesia |
11,438 |
625 |
12 |
1 |
9,620 |
526 |
1,830 |
100 |
|
Malaysia |
5,260 |
470 |
20 |
2 |
4,160 |
371 |
1,120 |
100 |
|
Thailand |
1,297 |
132 |
37 |
4 |
354 |
36 |
980 |
100 |
|
New Zealand |
1,364 |
190 |
11 |
2 |
656 |
91 |
719 |
100 |
|
EXPORTERS TOTAL |
19,359 |
416 |
80 |
2 |
14,790 |
318 |
4,649 |
100 |
Source: M.J. Lyons; Adapted from Document APFSOS/WP/40(a), Table A.3. The original table has been re-arranged so that all cases of greater imports than exports in 1995 appear as "importers" even if in other years their position could have been reversed.
Fibre-furnish
North Asia and the AIEs dominate both production and consumption of fibre-furnish in the region, with the People's Republic of China and Japan together accounting for 68 percent of the Asia-Pacific's total furnish production. Significant growth in both production and consumption of fibre-furnish is evident, however, in all regions. An extremely interesting feature of fibre-furnish production in the Asia-Pacific region, relative to the rest of the world, is the comparative importance of non-wood fibre (including recycled paper) in paper-making. Wood pulp accounts for only 34 percent of total fibre-furnish used in Asia and the Pacific (in all other regions of the world, wood pulp comprises more than 55 percent of fibre-furnish). Asia and the Pacific (primarily the People's Republic of China and India) dominates world production of non-wood fibre pulps from straw, bamboo, bagasse, etc. (Box 3.23). Recycled fibre is also important in Asia and the Pacific, contributing 39 percent of total fibre-furnish used in the region.
Paper and paperboard
The rapid economic expansion in the Asia-Pacific region has been accompanied by major expansions in paper and paperboard production and consumption. All of the sub-regions have installed significant new productive capacity in the past decade, resulting in an increase in the production of paper and paperboard of 83 percent since 1987. The most rapid expansion has occurred in North Asia and Southeast Asia, which increased production by 230 percent and 400 percent, respectively. As with fibre-furnish production, however, North Asia and the AIEs dominate total production and consumption of paper and paperboard products. This is largely a reflection of China's enormous population and the high levels of economic development in Japan and the Republic of Korea.
|
Box 3.23: NON-WOOD FIBRE CONTRIBUTION AND POTENTIAL IN THE PEOPLE'S REPUBLIC OF CHINA AND INDIA In 1995, the People's Republic of China and India together accounted for about 11 percent of the world's output of fibre-furnish (a combination of wood pulp, non-wood fibre and recovered wastepaper used in making paper and paperboard). Their share of consumption was a little higher at about 13 percent. Although their current significance is modest, as their economies liberalise and expand, they have the potential to be giant consumers of paper and paperboard. Both China and India have only limited forest and wood resources; thus, they have responded by aggressively developing paper industries that use non-wood fibres. In 1995, the two countries jointly accounted for about 90 percent of world production and consumption of such fibre, with China alone accounting for some 85 percent. While at the global level, non-wood pulp accounts for only 7 percent of fibre-furnish, in China and India it represents nearly half. The most common fibre used comes from straw, which is so abundant that if it became mainstreamed, raw material supply would rarely be a constraint. The People's Republic of China: In 1995, China consumed about 35.2 million tonnes of fibre-furnish for paper and paperboard. Rice and wheat straw are the main non-wood fibre resources used (about 45 to 50 percent of total pulp). Recovered wastepaper provides another 40 percent of needs, while the share of wood pulp is around 10-13 percent. It is estimated that in 1994 about 386 million tonnes of agricultural residues were produced, along with 22.3 million tonnes of agricultural processing residues. Assuming a fibre content of about 35 to 55 percent, even a low estimate would mean that nearly 150 million tonnes of residue fibre pulp could potentially be available. To put this volume in perspective, total pulp production in China in 1995 was only about 21 million tonnes. Current production methods using straw generally result in low-quality paper. At the same time, the small mills that dominate non-wood pulp manufacturing cause serious pollution. The Chinese government has closed more than 4,000 such mills with an annual capacity of less than 5,000 tonnes. Others are being combined to create enterprises large enough to warrant investment in equipment for wastewater treatment. With a view toward the future, China is supporting research on treatment of wastewater from straw-based paper production and improving the quality of paper made from straw. India: In the 1970s and 1980s, wood and bamboo constituted the chief raw material for paper and board manufacture. As these materials became scarce, the government imported second-hand machines to process agro-residues and imposed licensing and tariff regimes favourable to non-wood fibre resources. The raw material utilisation profile thus changed significantly. Previously non-wood fibre accounted for only 5 percent of output, but by 1995 it had risen to 36 percent. Simultaneously, the use of wastepaper rose from near zero to 26 percent. In another decade, the ratio of non-wood fibre is expected to reach nearly half while the share from wood and bamboo is expected to decline to about 20 percent. Wheat straw is the most abundant raw material. The estimated production in 1995/1996 was 70 million tonnes. Even allowing for about 50 percent to be used by households for other purposes, surplus straw is plentiful. However, supplies are scattered and transport is costly. Bagasse, because it yields high-quality pulp and is concentrated at sugar mills, is highly attractive for papermaking. One Indian bagasse paper mill is paying 8 sugar mills within a radius of 100 kilometres to return to coal-fired boilers in return making their bagasse available for papermaking. Such initiatives are likely to become more common in the future as paper mills work to secure reliable sources of quality raw material. Sources: (a) Ganapathy, P.M. (1997): Sources of non-wood fibre for paper, board and panels production: status, trends and prospects for India: Document APFSOS/WP/10. FAO, Rome/Bangkok, (b) Zhaohua, Zhu et al. (1997). Status, trends and prospects for non-wood and recycled fibre in China: Document APFSOS/WP/35, FAO, Rome/Bangkok. |
Recovered paper has become an important product in its own right and has obvious potential for reducing pressure on forests. Table 3.9 charts the evolution of the recovered paper industry in Asia-Pacific during the past 25 years. A notable feature is the enormous growth in utilisation of recovered paper in North Asia and the AIEs, largely as a result of a concerted effort in Japan to develop its paper-recycling industry. Paper recovery and utilisation in Japan now exceeds 50 percent, which may be close to maximum practical capacity. Recycling recovered paper is optimal where collection and transportation costs are kept to a minimum. Recovery for recycling is, consequently, most efficient in densely populated areas where paper can be re-used by mills near where it is collected. This suggests significant potential for many of the countries in the Asia-Pacific region to markedly expand paper-recycling activities. In poorer communities, however, where paper is already a valuable commodity, it is already recovered (though not captured in statistics) and reused for a number of different purposes. Consequently, much of it may be unavailable for recycling in paper mills.
Table 3.9: Recent trends in the production and consumption of recovered paper
|
|
Production (1,000 MT) |
Apparent consumption (1,000 MT) |
||||||
|
1970 |
1980 |
1990 |
1995 |
1970 |
1980 |
1990 |
1995 |
|
|
AIEs |
5,124 |
8,700 |
14,809 |
16,036 |
5,233 |
8,906 |
15,299 |
16,199 |
|
NIEs |
209 |
1,086 |
2,675 |
3,625 |
123 |
1,208 |
3,435 |
4,436 |
|
South Asia |
41 |
231 |
364 |
474 |
41 |
234 |
771 |
744 |
|
Southeast Asia |
101 |
394 |
603 |
970 |
140 |
614 |
1,459 |
2,456 |
|
North Asia |
697 |
1,557 |
6,253 |
10,853 |
800 |
2,115 |
7,999 |
13,117 |
|
Pacific Islands |
0 |
0 |
0 |
0 |
0 |
0 |
0 |
0 |
|
TOTAL |
6,172 |
11,968 |
24,704 |
31,958 |
6,337 |
13,077 |
28,963 |
36,952 |
Source: FAO Forest Products Yearbook.
The demands for industrial wood in Asia and the Pacific, combined with the demands for forest services, woodfuels, and non-wood forest products, are placing severe pressures on the region's forests. The South Asian countries (with the exception of Bhutan), Thailand, the Philippines, Viet Nam, the People's Republic of China, and many of the Pacific Island countries face serious difficulties in meeting their demands for industrial wood, and most have suffered significant deforestation in the past 20 years (Box 3.24). Even several of the major wood producers, such as Indonesia and Malaysia, are reducing harvests of industrial wood to more sustainable levels. As a consequence, considerable pressures are being made to utilise remaining resources more efficiently and to develop alternative sources of industrial wood and fibre.
As wood supplies have become more constrained in the region, increased intention has focused on a number of smaller countries with forest resources that are either relatively intact, or are subject to fewer regulatory constraints. Myanmar, Laos, Cambodia, Viet Nam, Papua New Guinea, Vanuatu and the Solomon Islands have all markedly increased harvesting in the past two decades. For example, Papua New Guinea is now the world's second largest exporter of tropical logs. Nonetheless, of these producers, only Myanmar and Papua New Guinea have extensive forest estates, and the potential to boost supplies over the long run. The other countries can make large contributions only at the expense of significant deforestation and degradation.
A further, and potentially more significant response to shortfalls in industrial wood supplies has been the establishment of significant plantation forests. Of immediate significance are the radiata pine forests of New Zealand and Australia. Many of these forests are reaching maturity, allowing these two countries to increase their harvests. In the future, plantation-grown wood from countries such as the People's Republic of China, Viet Nam, Indonesia and Thailand is likely to significantly supplement natural forest production.
Production of rubberwood, mainly from Malaysia and Thailand, expanded significantly throughout the 1980s, and offers good prospects in the future in Indonesia and Viet Nam as well. Oil palm residues also appear to have enormous potential as a fibre source, especially in Malaysia.
|
Box 3.24: DECLINE OF FOREST RESOURCES - THE CASE OF THE PHILIPPINES The experience of the Philippines as a major supplier of hardwood logs in the 1960s and 1970s provides a poignant lesson for other countries, such as Cambodia, Laos, Myanmar, Viet Nam, Papua New Guinea, Vanuatu and the Solomon Islands. The Philippines was effectively the first Asia-Pacific country in the post-World War II era to extensively liquidate its forest wealth. Anecdotal evidence suggests that, in its virgin state, Philippine forests were among the most commercially valuable in the world, with outstanding yields of high-quality, easily-accessible timber. The Philippines developed an extensive log-export trade between 1960 and 1970. During that period, total wood production increased from 3.8 million cubic metres to 12 million cubic metres and the area under concession increased from 4.5 to 10.5 million hectares (more than a third of the country's land area). Log exports peaked in the late-1960s at around 10 million cubic metres per annum. The increase in production was not, however, accompanied by substantive development of wood-processing facilities nor was adequate attention paid to sustainable management of the resource. Consequently, by the early 1980s, annual log exports had dwindled to less than 1 million cubic metres. The country was left with a legacy of problems associated with deforestation and degradation and no direct means of raising revenue to alleviate these problems. Broad statistics suggest that the wealth generated from the country's forests was not effectively invested to develop alternative industries. Between 1980 and 1990, the Philippines' GNP declined by an average of a 1.2 percent per year. Today, the Philippines is a significant net importer of wood products, with imports costing the country ten times the value of forestry exports. |
There are a number of strong central themes that are likely to dictate the near-term future of forestry in the region. The most significant of these are:
· A declining rate of increase in the utilisation of industrial roundwood and sawn timber. This is evidence of the significant improvements in wood utilisation within the region. These improvements include better use of harvest and processing residues, more efficient processing facilities, development of engineered wood products, and greater use of recycled and non-wood fibres.· Extensive use of recycled and non-wood fibre. The proportion of recycled and non-wood fibre used in Asia and the Pacific, particularly for paper and paperboard, is already high relative to the rest of the world. However, the potential for even greater utilisation of non-wood fibre (especially wastepaper) is evident. This potential is likely to receive increased attention in the near future.
· A need to ensure ongoing commitment to the principles of sustainable forest management and environmental objectives in the context of retaining access to key markets. Consumers in several key markets are increasingly demanding that wood products come from sustainably managed forests. Competitive advantage, and possibly market access, may become increasingly dependent on an ability to demonstrate strong linkages between production and environmental goals.
· The emergence of a number of non-traditional timber producers, particularly among the Mekong countries and Melanesia. Most of these countries have relatively small forest resources compared with traditional hardwood suppliers, however, and are therefore likely to provide only supplementary wood supplies. They are also consequently vulnerable to over-exploitation. For most of these countries, forest resources provide an opportunity to significantly enhance economic development.
· Increasing substitution of coniferous timber for hardwood production. While the supplies of natural hardwood timbers are increasingly constrained, a number of countries including New Zealand, Australia and Fiji, within the region (and Chile outside the region), have rapidly maturing plantation estates that will provide significant volumes of timber in the next decade. These supplies, particularly in engineered forms, will provide considerable scope to substitute for hardwood species.
· A greater emphasis on fibre processing as opposed to solid wood processing. As supplies of high-quality large-dimension logs decline, focus will continue to shift away from plywood and sawnwood toward products such as OSB, MDF, and perhaps veneer-chip composite boards that can be made from lower-quality fibre resources.
· Increased processing in developing producer countries as opposed to developed consumer countries. This pattern is largely driven by the labour-cost advantages of developing countries. It is a positive development in that it allows poorer countries to capture a greater proportion of the value of finished-wood products. It will also likely encourage greater utilisation of harvesting residues that otherwise would be left to waste. On the negative side, less-developed countries are also likely to have less efficient processing facilities and consequently greater waste may occur during processing.
· A continuing, and increasing, dependence of the region on trade to meet demands for forest products. Overall wood production in the region is unlikely to increase markedly from the present. Therefore, increasing consumption demand will ensure a continuing dependence on trade to alleviate shortages.
![]()
![]()
![]()
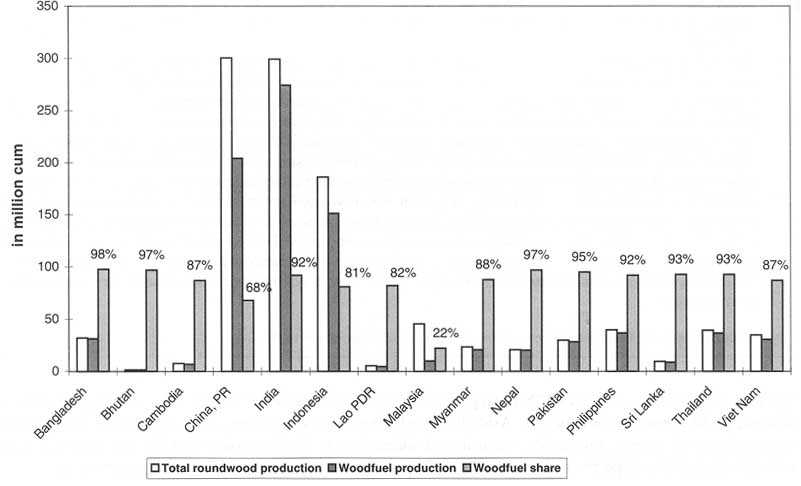
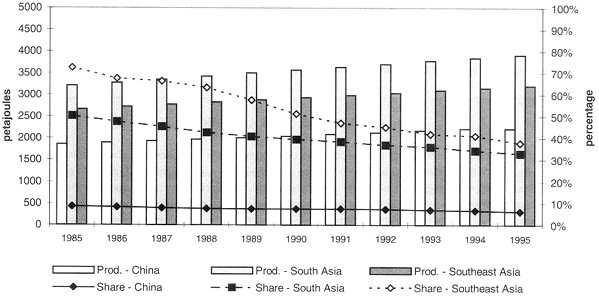
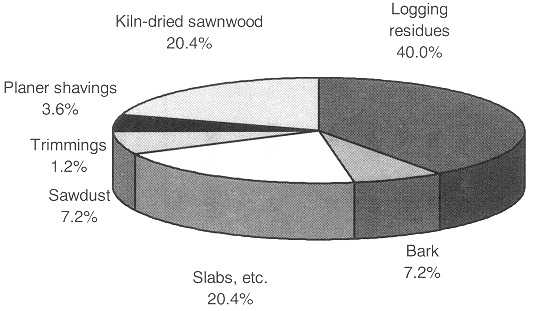
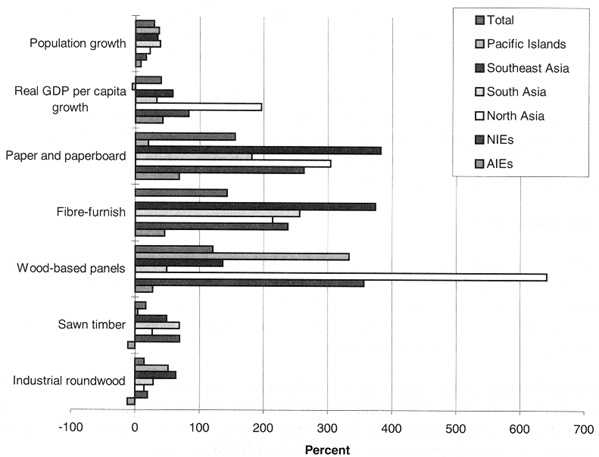
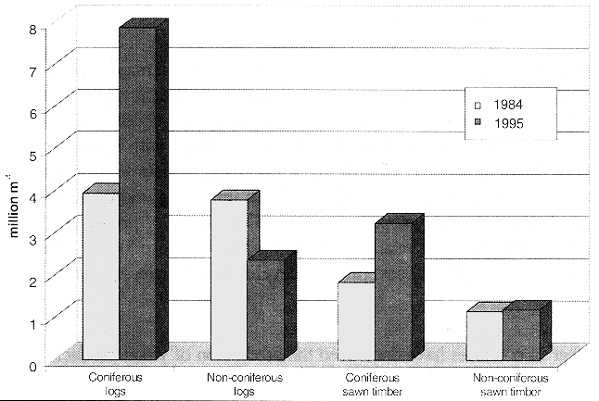