![]()
![]()
![]()
3.1 Population and demography
3.2 Farming systems and land use
3.3 Crops and agricultural production
3.4 Livestock and animal production
3.5 Forests and natural resources
3.6 Summary of soil and water resources problem areas
3.1.1 Population, community and household size
3.1.2 Ethnic and caste composition
3.1.3 Literacy
3.1.4 Socio-economic status and food sufficiency
3.1.5 Sources of income
3.1.6 Sanitary habits
The 26 PRA sites located within the Bhusunde Khola watershed and spread over 4 VDCs (Ampipal, Chhoprak, Harmi and Khoplang), did not actually cover the whole watershed (see para. 2.2.1). The total population of the Bhusunde Khola watershed has been estimated at 12,000 persons, but precise data are not available.
The total population of the villages and hamlets covered by the 26 PRAs was reported to be 8,851 persons, of which 4,554 (51 %) were male and 4,297 (49%) female (see Table 2). However, it should be noted that the actual number of persons and households in the 26 PRA communities may be more than the number reported. In Majghaon (Chhoprak #7), for instance, a significantly larger number of households was reported in a Participatory Evaluation and Replanning exercise that took place in October 1996.
The total number of households was 1,566 and the average family size 5.7 persons.
The size of the PRA communities (6) varied from 95 persons in Chiuribot (Chhoprak #2) to 620 in Ratdanda (Ampipal #5) with an average of 340.
6 A PRA community consists of one ore more hamlets, forming a natural community as recognized by the inhabitants themselves.
The number of households per PRA community varied from 18 in Chiuribot (Chhoprak #2) to 122 in Ratdanda (Ampipal #5), with and average of 60.
The average family size ranged from 4.8 persons per household in Harmi Banyang (Harmi #3) to 8.4 in Katubanse (Chhoprak #9) (see Table 2).
The percentage of women of all age groups in the communities varied from 44% in Amarai (Chhoprak #2) to 56 in Harmi Bhanjang (Harmi #3).
The Bhusunde Khola communities are highly diversified in terms of caste and ethnicity. High caste Brahmin, mid-caste Chhetri, Bhujel, Newar, Gurung, Yogi, Baram and Kunal, and low-caste Kami, Damai and Sarki, as well as non-Hindu (and non-Buddhist) Miya and Muslim families live more or less inter-mixed in the watershed (see Table 3.)
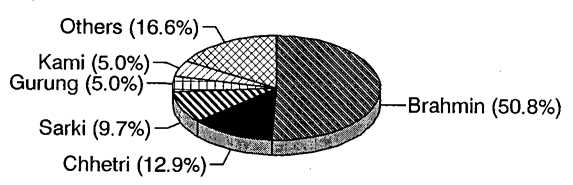
Figure 2A. Ethnic composition 26 PRA communities' households
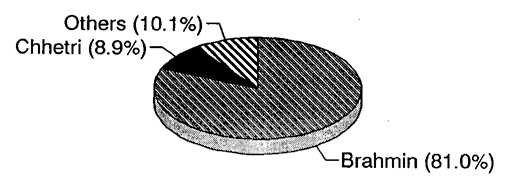
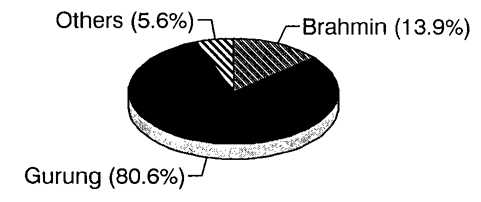
Figure 2B. Ethnic composition Ghimiregaon (Harmi #6) households
Figure 2C. Ethnic composition Kolkate (Khoplang #4) households
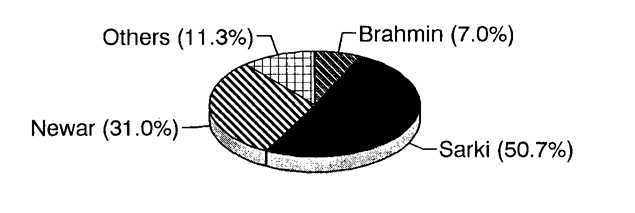
Figure 2D. Ethnic composition Khurpajung (Khoplang #4) households
Figure 2E. Ethnic composition Salbot (Chhoprak #4) households
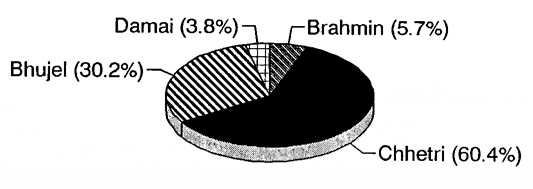
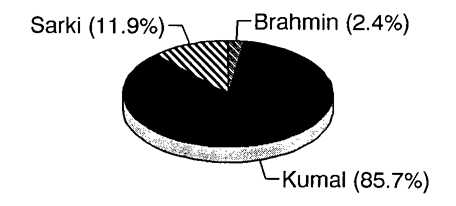
Figure 2F. Ethnic composition Katubanse (Chhoprak #9) households
However, it should be noted that where not all households in certain communities
had been reported (para 3.1.1.), the caste composition of the missing households
was significantly different from the reported households (7).
7 It has been found that certain disadvantaged ethnic groups, such as Sarki, Kami and Damai, need specific attention in PRA and planning exercises, to ensure their actual participation.
About 51 % of all households reported upon (i.e. 1,412 households) are Brahmins (Figure 2A). There is not a single community without Brahmin households. Some communities consist almost entirely of Brahmin (Figure 2B), with the highest concentration in Chhoprak #2, with Chiuribot, Amarai and Thumki, with respectively 100%, 100% and 81% of the households. Brahmin make up less than 20% of the households in: Katubanse (Chhoprak #9), 2%; Chitre (Chhoprak #1), 3%; Kolkate (Khoplang #4), 6%; Khurpajung (Khoplang #4), 7%; and Salbot (Chhoprak #4), with 14%.
Chhetri are the second most important group, representing 13% of the households. They were found to be living in 13 out of 25 PRA communities with valid data. Kolkate in Khoplang #4 (Figure 2C), Simpani Hatiya (Ampipal #7), and Belbas (Khoplang #4) have the highest concentration of Chhetri households: 60%, 41 % and 38% respectively.
Sarki (cobblers) are the third most numerous group, with a share of 10% of the reported households. Sarki can be found in 13 out of 25 PRA communities. Their largest concentration is in Khurpajung, where they represent 51% of the households (Figure 2D).
Gurung make up 5% of all households. They live more in clusters: 80% of all Gurung households can be found in Salbot (Chhoprak #4) and Chitre (Chhoprak #1), where they make up 81% and 44% of the households (Figure 2E).
Kami (blacksmith) also make up 5% of all households. Their highest concentrations are in Chitre (Chhoprak #1) and Katarbari (Chhoprak #3), with 33% and 14% of the households.
Of all households 4% are Bhujel. They live throughout the watershed with one concentration in Kolkate (Khoplang #4), where the make up 30% of the households.
Newar, with 3% of all households, have only been reported in 3 PRA sites. They consist of 31% and 15% of the households of Khurpajung (Khoplang #4) and Simpani Hatiya (Ampipal #7).
Kumal, also with 3% of all households, have only been reported in Katubanse (Chhoprak #9), where they make up 86% of all households (Figure 2F).
Other interesting concentrations of particular caste/ethnic groups are in: Katarbari (Chhoprak #3), which consists for 41 % of Baram households; Tutunga (Chhoprak #8) and Belbas (Khoplang #4), which have 21% and 16% Yogi households;
Nawalpur (Harmi #6), with 17% Miya households; and Majhgaon (Chhoprak #7), with 9% Thakuri households.
In all the PRA communities, the sum of the number of literate and illiterate people exactly matches with the total population. Thus, while generating data on literacy, the PRA participants must have included even children below five years of age. Data on literacy per age group, which would have been more useful, were not provided.
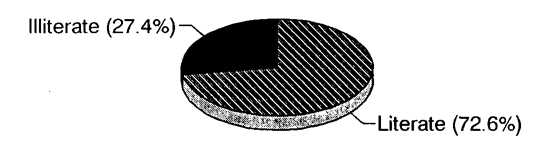
The reported total literacy rate is on average 59%, and varies from 34 % in Khurpajung (Khoplang #4) to 81 % in Amarai (Chhoprak #2} (see Table 4).
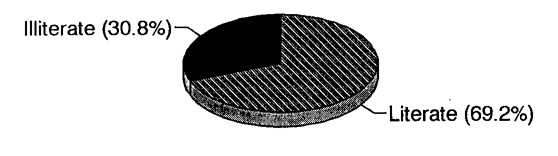
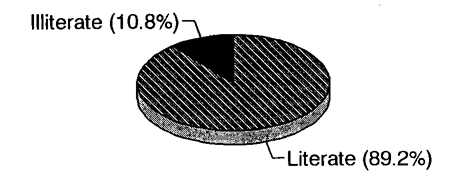
Male literacy rates average 69%. Communities with male literacy rates below 50% are: Chitre (Chhoprak #1), with 48%; and Khurpajung (Khoplang #4), with 49%. Communities with particularly high male literacy rates are: Faudargaon (Chhoprak #5), Chiuribot (Chhoprak #2), Harmi Bhanjang (Harmi #3} and Amarai (Chhoprak #2) with 82%, 84%, 84% and 89% respectively.
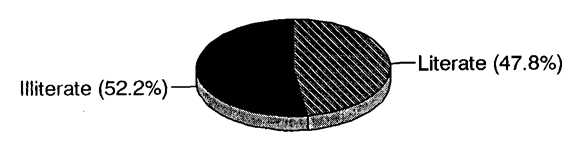
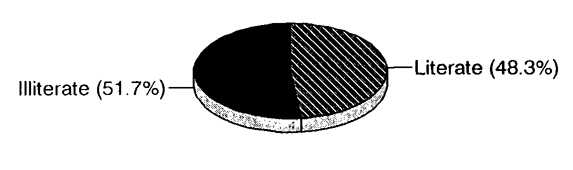
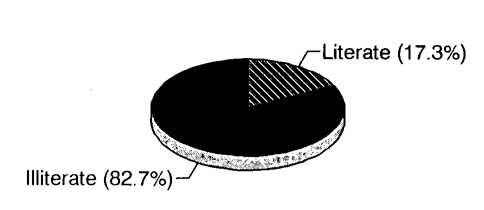
Female literacy rates average 48%. Communities with very low female literacy rates include: Khurpajung (Khoplang #4), Chitre (Chhoprak #1), Kolkate (Khoplang #4) and Katarbari (Chhoprak #3), with 17%, 23%, 27% and 28% each. Relatively high female literacy rates can be found in: Harmi Bhanjang (Harmi #3), 73%; and Amarai (Chhoprak #2}, with 71%.
There would seem to be a relation between caste/ethnic composition and literacy rate of communities. High percentages of Brahmin households coincide with high literacy rates, in particular male literacy rates. Thumki (Chhoprak #2), with 81% Brahmin households (para 3.1.2) has a female literacy rate of only 35%. This apparent relation between (some of the) caste/ethnic groups and (II) literacy is probably caused by both cultural values and socio-economic status (para 3.1.4).
In the watershed, household food sufficiency, defined as the number of months per year that a household can feed itself from self-produced food (grain) resources, is commonly used as a wealth and socio-economic status ranking tool. Food sufficiency is not the only indicator of wealth. Ownership of various assets valued by villagers, and various sources of income are also important criteria. However, in 25 out of the 26 PRA sites wealth ranking and food sufficiency were combined, using the following categories:
1. All-year-round (ten months and above) food sufficient households, considered "wealthy"; sizable land holding, marketable surplus of agriculture products, possessing land or house in other town or village, alternative sources of income, higher rate of income than normal expenditures.
2. Seven to Nine months food sufficient households, considered "medium class"; one or two persons in the family hold jobs (services), no indebtedness, subsistence income.
3. Four to six months food sufficient households, considered "lower medium class"; big family size, limited number of income sources, indebtedness and sale of livestock.
4. Three months or less (less than four months) food sufficient households, considered "poor"; limited or no arable land, no alternative income sources, limited number of livestock, labour as the major source of income.
Figure 3A. Literacy Male literacy 25 PRA communities
Figure 3B. Literacy Male literacy in Amarai (Chhoprak #2)
Figure 3C. Literacy Male literacy in Chitre (Chhoprak #1)
Figure 3D. Literacy Female literacy in 25 PRA communities
Figure 3E. Literacy Female literacy in Harmi Bh. (Harmi #3)
Figure 3F. Literacy Female literacy in Khurpajung (Khop.#4)
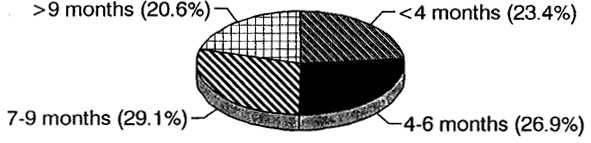
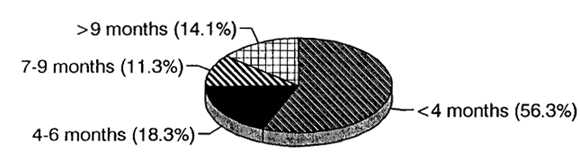
Figure 4A. Household food sufficiency Total of 25 PRA communities
Figure 4B. Household food sufficiency Firfire (Chhoprak #8) households
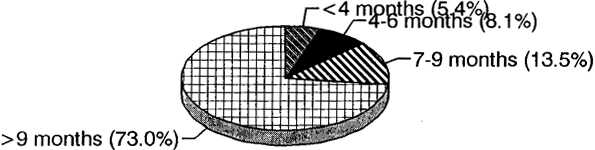
Figure 4C. Household food sufficiency Khurpajung (Khoplang #4) households
Of all 1459 reported upon households, only 301, or 21 % fell in the "wealthy" category of 10 or more months food sufficiency. About 29% of households were 7-9 months food sufficient or medium class, and another 27% were 4-6 months food sufficient or lower medium class, 23% of households had only 3 months or less food sufficiency and is considered very poor. Only half of the households have more than six months food sufficiency (see Table 5 and Figure 4A).
Firfire (Chhoprak #8) had the highest rate of fully food sufficient households, 73% (Figure 4B). This is quite exceptional, Katubanse (Chhoprak #9) has the second highest rate of fully food sufficient households, with only 38%.
Only 10 out of 25 PRA communities reported to have more than 50% households. with more than 6 months food sufficiency, notably: Firfire (Chhoprak #8), 86%; Simpani (Ampipal #6), 75%; and Tutunga (Chhoprak #8), with 71%. PRA communities with very high rates of households with 6 months or less food sufficiency include: Khurpajung (Khoplang #4), 75% (Figure 4C); Darmichaur (Ampipal #9), 68% and Kolkate (Khoplang #4), with 66%.
Several PRA communities report little or no households with less than 4 months food sufficiency: Simpani (Ampipal #6}, 0%; Jaisithok (Chhoprak #8), 0%; and Katubanse (Chhoprak #9), with 0%. Some other PRA communities have very high rates of households with less than 4 months food sufficiency: Khurpajung (Khoplang #4), 56%; Darmichaur (Ampipal #9), 43%; and Nawalpur (Harmi #6), with 38%.
Some PRA communities have almost all households in the middle categories of 4 -9 months food sufficiency, such as: Jaisithok and Tutunga (both in Chhoprak #8), with 89% and 85% of households respectively.
The relation between cast/ethnic composition and wealth/food sufficiency status of a community is not so obvious, though there definitely seem to be links. The villages with the highest percentages of very poor households, Khurpajung, Darmichaur and Nawalpur, all have a relatively high percentage of occupational casts (Sarki, Kami and Damai), who usually have little and low quality land. These villages also have relatively low percentages of Brahmin households. However, several villages with very high percentages of Brahmin households are also very poor, notably Thumki (Chhoprak #2), and Ghimirighaon (Harmi #6).
Similarly, there is some evidence for a relation between literacy rates and wealth/food sufficiency.
Although 81 % of all households had serious food deficiency from their farmland, agriculture was considered to be the main source of cash income. This means that there are very low levels of cash earnings in the communities. In five PRA communities a "pie" was used to identify different source of income (Table 6).
Table 6. The percentage of households (of 5 PRA communities) earning cash from various sources of income.
|
VDC and Ward # |
PRA community |
Agriculture |
Sale of livestock |
Production of alcohol |
Jobs and services |
Labour |
|
Chhop. #2 |
Chitre |
10 |
10 |
25 |
50 |
|
|
Chhop. #9 |
Katubanse |
95 |
- |
- |
3 |
2 |
|
Khopl. #4 |
Belbas |
80 |
- |
- |
15 |
5 |
|
Khopl. #4 |
Kolkate |
96 |
- |
- |
2 |
2 |
|
Khopl. #4 |
Khurpajung |
75 |
- |
- |
10 |
15 |
Regarding sanitary habits, it was found that very few people were using toilets, and most were using the open air fields. Pie charts were used in 6 communities to gather data, which are presented in Table 7.
Table 7. Sanitary habits of people in 6 PRA communities.
|
Community |
Percentage of people using |
|
|
Toilet |
Open field |
|
|
Simpani Hatiya (Ampipal #7) |
56 |
44 |
|
Tutunga (Chhoprak #8) |
10 |
90 |
|
Arubote/Mathure (Chhoprak #8) |
1 |
98 |
|
Katubanse (Chhoprak #9) |
10 |
90 |
|
Belbas (Khoplang #4) |
5 |
95 |
|
Khurpajung (Khoplang #4) |
50 |
50 |
3.2.1 Farming systems overview
3.2.2 Major land use categories
3.2.3 Soil types
The farming systems of the Bhusunde Khola watershed are complex because of the high diversity in agro-ecological aspects, such as land slope, aspect, exposure, altitude, soil type and water availability. Farms typically consist of several small fields, while there are high levels of interaction between different components, including cropland, livestock, forest and water resources (see also Figure 5).
The following main cropping systems can be distinguished:
(i) Irrigated rice (paddy) on level terraces (khet land), usually followed by wheat or maize. In some khet land it is possible to grow two consecutive rice crops;
(ii) Rainfed grain crops on hill slope terraces (bari land) with a high cropping intensity, notably upland rice followed by pulses, or maize followed by millet, mustard, pulses, buckwheat or vegetables.
(iii) Terrace risers and bunds are utilized for growing fuelwood, fodder and fruits, such as banana and citrus.
(iv) Home gardens, usually with fruit and vegetables.
Rice and maize are grown for home consumption, whereas pulses are grown both for home consumption and marketing.
Manure, used animal bedding material (often forest based), kitchen wastes and the like, are utilized to make compost. Compost is prepared and stored in open heaps in the homestead area (there is no traditional practice of making compost pits, the compost made is usually of low quality) (8).
8 Training in improved compost making was included in several of the Community Action Plans.
Cattle, buffaloes and goats are the most important. domesticated animals. Chickens are also raised by all casts, though to a lesser extent by Brahmins. Pigs are raised by some ethnic groups and occupational casts.
Cattle are kept mainly for draft power (ploughing) and the production of manure, cows are also kept for religious purposes. Goats, pigs and chicken are raised both for meat and cash income. They are usually cared for and kept by the women.
Buffaloes are kept for the production of milk and meat (though the Brahmin and Chhetri do not consume buffalo meat), as well as manure. Fluid milk is not much sold due to marketing constraints, and any surplus is converted into ghee (kind of butter) and sold as such. Buffalo bulls (or oxen) are not used for ploughing.
Figure 5. Bhusunde Khola watershed farming systems components and major interactions.
Buffaloes are mainly stallfed, while cattle and goats are taken out for grazing, mostly in winter on the fallow ban' lands. Cut grass is the main fodder used for stallfeeding during the summer, while in winter and spring rice straw and to some extent tree fodder are used. Overall, rice straw is the most important fodder source, and also serves as animal bedding material.
Forest land is used for grazing, and the collection of animal bedding material, fodder, fuelwood, -occasionally- timber, as well as medicinal and other non-wood products. Nutrients are drained from the forest and from non-irrigated fields, and through compost, added to irrigated fields.
Though men own the land, women do most of the farm work. Ploughing fields, lopping tree branches and putting roofs on houses are the main activities done by men. All the other farm work is done mainly by women, though men also contribute. On top of this the women have household chores and raise the children.
There is enough work on the farms to remain busy all year round. However, because only 21 % of the households produce enough food to satisfy their consumption needs, many migrate seasonally (and some permanently) for jobs outside the watershed, especially working age men. This migration, and the fact that children nowadays go to school, further increases the workload of the women. In fact, many households are temporarily or permanently headed by women.
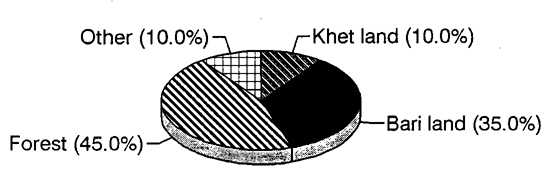
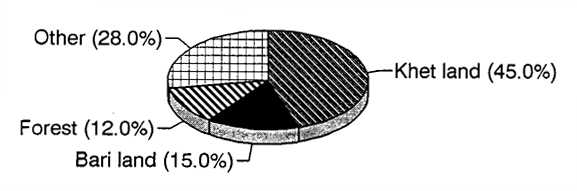
Khet, Bari, forest and "others" are the main land use types in the Bhusunde Khola watershed, while the different PRA communities have different proportions of these land use types (Table 8):
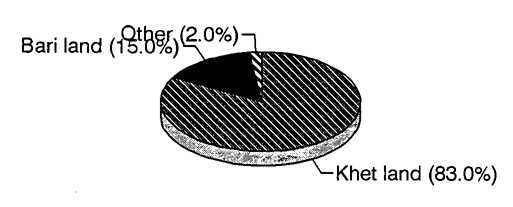
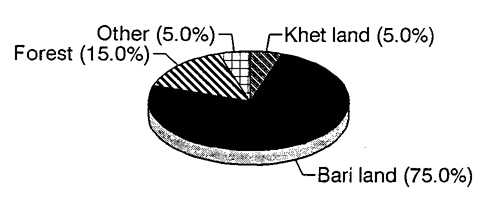
1. Khet land consists of irrigated level terraces, usually located in the lower part of the valley, where in summer paddy is grown. There are two types of Khet land, Gain' Khet, which has a year round irrigation facility, and Tari Khet, which is (rainfed) seasonally irrigated. Within the PRA communities, on average 31 % of the land is classified as Khet by the villagers. In several communities khet land covers more than 50% of the land, notably in Simpani (Ampipal #6) 83% (Figure 6A), Amarai (Chhoprak #3) 60%, Ratdanda (Ampipal #5), and Salbot (Chhoprak #4) with 58%. Similarly, other communities have very little Khet land, such as Bawaligaun (Chhoprak #7) and Katubanse (Chhoprak #9) with only 5%, while Khurpajung (Khoplang #4) has no Khet land at all.
2. Bari land consists of rainfed cropland, usually terraced, often lightly sloping terraces, usually on the slopes of the valley, with a higher proportion in the upper slopes. Several crops are usually grown throughout the year. Bari land covers on average 47% of the land of the PRA communities and is the largest land use type. In some villages Bari covers more than 70% of the land. Bawaligaon (Chhoprak #7), Jaisithok (Chhoprak #8) and Khurpajung (Khoplang #4) each have about 75% Bari land (Figure 6B), while Simpani (Ampipal #6) and Ghimiregaon (Harmi #6) have only 15% of Bari land.
3. Forest land is usually a common resource, consisting of a natural vegetation, which is heavily utilized for grazing, fuelwood collection, fodder and animal bedding collection, and where timber and poles are harvested. Some of the forests have been handed over as community forests to a Forest User Group and an agreed upon forest management plan. On average the land of the 26 PRA communities included 16% forest land, but there are large variations. Villages such as Tutunga (Chhoprak #8), Arubote/Mathure (Chhoprak #8) and Simpani (Ampipal #G) have no forest land within their community boundaries. On the other hand, some communities have a large proportion of forest land, notably Kolkate (Khoplang #4) 45% (Figure 6C), Suntale (Khoplang #1) 32%, and Chitre (Chhoprak #1) with 30%.
4. Other land includes land covered by settlements, abandoned fields, Kholchi (gully), Kharbari (thatch and grasses), Chaur (grazing land), etc. In some of the PRA communities only Khet, Bari and forest land use types have been used as categories. In 19 communities other categories were also used. Most often reference was made to the settlement area, in which cases the category was included in the Bari land. In these 19 PRA communities the other land category was on average 7%, ranging from 2% in Simpani (Ampipal #6) to 28% in Ghimiregaun (Harmi #6)(Figure 6D). Table 9 provides further detail on the breakdown of other lands per community.
Table 8. Proportional distribution of major land use categories in 26 PRA communities.
|
VDC and Ward # |
PRA community |
Proportion of land use types in % per community |
|||
|
Khet land |
Bari land |
Forest land |
Other land |
||
|
Ampipal 5 |
Ratdanda |
60 |
30 |
10 |
no data |
|
6 |
Simpani |
83 |
15 |
0 |
2 |
|
7 |
Simpani H. |
18 |
50 |
15 |
17 |
|
9 |
Darmichaur |
49 |
36 |
15 |
no data |
|
Chhoprak 1 |
Chitre |
20 |
35 |
30 |
15 |
|
2 |
Chiuribot |
25 |
40 |
22 |
13 |
|
2 |
Thumki |
20 |
75 |
0 |
5 |
|
2 |
Amarai |
60 |
25 |
15 |
no data |
|
3 |
Katarbari |
20 |
40 |
20 |
20 |
|
4 |
Salbot |
58 |
26 |
16 |
no data |
|
5 |
Faudargaon |
37 |
45 |
10 |
8 |
|
7 |
Majhgaon |
20 |
60 |
15 |
5 |
|
7 |
Bawaligaon |
5 |
75 |
15 |
5 |
|
8 |
Tutunga |
40 |
55 |
0 |
5 |
|
8 |
Jaisithok |
13 |
75 |
5 |
7 |
|
8 |
Firfire |
30 |
60 |
10 |
no data |
|
8 |
Arubote/Ma |
40 |
60 |
0 |
no data |
|
9 |
Katubanse |
5 |
60 |
27 |
8 |
|
Harmi 3 |
Harmi Bh. |
50 |
30 |
10 |
10 |
|
6 |
Nawalpur |
30 |
60 |
2 |
8 |
|
6 |
Ghimireg. |
45 |
15 |
12 |
28 |
|
Khoplang 1 |
Suntale |
36 |
32 |
32 |
no data |
|
1 |
Falmkhani |
15 |
50 |
17 |
18 |
|
4 |
Belbas |
25 |
50 |
20 |
5 |
|
4 |
Kolkate |
10 |
35 |
45 |
10 |
|
4 |
Khurpajung |
0 |
75 |
20 |
5 |
Figure 6A. Proportionate land use Simpani (Ampipal #6)
Figure 6B. Proportionate land use Bawaligaon (Chhoprak #7)
Figure 6C. Proportionate land use Kolkate (Khoplang #4)
Figure 6D. Proportionate land use Ghimiregaon (Harmi #6)
Table 9. Proportional distribution of different types of "other" land use in 19 PRA communities.
|
VDC and Ward # |
PRA community |
Proportion of 'other' land use types in % per community |
||||||
|
Kharbari |
Private forest |
Agro forest |
Kholchi |
Chaur |
Settle meant |
Total |
||
|
Ampipal 6 |
Simpani |
|
2 |
|
|
|
|
2 |
|
7 |
Simpani H. |
|
|
|
5 |
5 |
7 |
17 |
|
Chhoprak 1 |
Chitre |
10 |
|
|
|
|
5 |
15 |
|
2 |
Chiuribot |
10 |
|
|
|
|
3 |
13 |
|
2 |
Thumki |
5 |
|
|
|
|
|
5 |
|
3 |
Katarbari |
20 |
|
|
|
|
|
20 |
|
5 |
Faudargaon |
6 |
|
|
|
|
2 |
8 |
|
7 |
Majhgaon |
|
|
|
|
|
5 |
5 |
|
7 |
Bawaligaon |
|
|
|
|
|
5 |
5 |
|
8 |
Tutunga |
|
|
4 |
|
|
1 |
5 |
|
8 |
Jaisithok |
|
|
|
|
|
7 |
7 |
|
9 |
Katubanse |
|
|
|
7 |
1 |
|
8 |
|
Harmi 3 |
Harmi Bh. |
5 |
|
|
5 |
|
|
10 |
|
6 |
Nawalpur |
7 |
|
|
1 |
|
|
8 |
|
6 |
Ghimireg. |
5 |
|
|
18 |
5 |
|
28 |
|
Khoplang 1 |
Falmkhani |
|
|
|
|
5 |
13 |
18 |
|
4 |
Belbas |
|
|
|
3 |
1 |
1 |
5 |
|
4 |
Kolkate |
|
|
|
|
5 |
5 |
10 |
|
4 |
Khurpajung |
|
|
|
|
|
5 |
5 |
During transect walks soil types were identified in 22 PRA communities. Some soil types were identified by colors, some by texture and some by a mix of both of these:
a. Khairo (mato) = Gray (soil)
b. Kalo (mato) = Black (soil)
c. Rato (mato) = Red (soil)
d. Seto (mato) = White (soil)
e. Fusro (mato) = Light colored (soil)
f. Gegrailo (mato) = Gravelly (soil)
g. Balaute (mato) = Sandy (soil)
h. Pango (mato) = Loamy
i. Matailo (mato) = Clay (soil)
j. Chimtailo (mato) = Sticky (soil)
k. Kamero & Seto Chimtailo = White clay
l. Kalo Chimtailo = Black clay
No further details were provided in the PRAs.
3.3.1 Cropping patterns and seasonal activities
3.3.2 Area covered by crops
3.3.3 Food grain varieties
3.3.4 Agricultural productivity and trend
3.3.5 Diseases and pests in crops
3.3.6 Problems and opportunities
As mentioned earlier (3.2.1.), there were three types of cultivated land, Gairi Khet (fully irrigated level terraces); Tari Khet (partially rainfed/irrigated level terraces) and Bari (rainfed terraces). The major crop sequences reported in the PRAs are included in Table 10.
Table 10. Seasonality of the cropping pattern.
|
Land use category |
Months |
|
|
r.May.Jun.Jul.Aug.Sep.Oct.Nov.Dec.Jan.Feb.Mar.Ap Bai.Jes.Ash.Saw.Bad.Asw.Kar.Man.Pou.Mag.Fag.Cha. |
|
Gairi Khet |
judi rice=//= = summer rice= = =//= wheat = = =//= judi rice=//= = summer rice= = =//onion, potato =//= judi rice=//= =summer rice= = =/--- fallow----------//=---fallow---/= = summer rice= = =//= = wheat = = =/- |
|
Tari Khet |
/= maize = =//= summer rice= =//= = wheat = = = =/-fallow-/= =summer rice= = = =/------fallow--------------maize =//= = summer rice= = = =//= wheat = =//maize maize =//= = summer rice= = = =//=veget=//= maize |
|
Bari |
=maize = = =II= = millet = = = = /------fallow----------- =upland rice= = =//=bl.gr or buck./mustard or fallow = upland rice = = = /------------fallow-------------------------/maize&soya/---soya-------------//= = mustard= = =/----maize&soya/---soya-------------//--------fallow------------/= maize = = =/-----/= = mustard = = = = = = =/--fallow/maize & millet/---millet---------------//= =potato= = = =/------/=millet=/---/= niger= = = =/--veg. or fallow--------/maize= = =/-----/=blackgram= =//=potato= = = =//maize & millet/---millet---------------/----fallow--------------------/=peanuts= = = =/---------/=mustard or veg./------- |
Some crops were concentrated in particular PRA communities, such as niger in Salbot (Chhoprak #4), Majhgaon (Chhoprak #7), Katubanse (Chhoprak #9) and Kolkate (Khoplang #4); Paundunge millet (for alcohol production) around Katubanse (Chhoprak #9); and peanuts in Majhgaon (Chhoprak #1}, Tutunga (Chhoprak #8) and Kolkate (Khoplang #4).
Figure 7 provides details regarding month by month rainfall, food availability and workload. When analyzing the different cropping patterns and their seasonality it becomes clear that the farmers of the Bhusunde Khola watershed are very busy throughout the year.
The most busy period is in early summer, at the onset of the rains, from mid-April to July (Baisakh to Asar). During this same period farmers need more cash (for farming inputs), while there food stocks are low or finished. Farmers who manage to grow early rice crops in their Khet land have less food supply problems.
The months of mid-September to mid-November (Aswin - Kartik) and Mid-December to mid-February (Poush - Magh) are relatively less busy. '
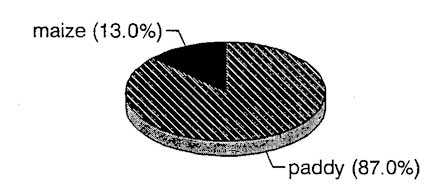
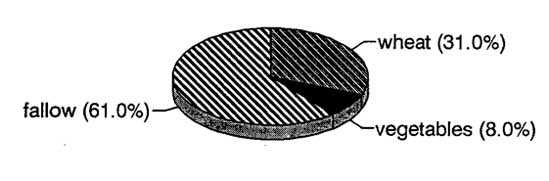
The cultivated area under various crops in summer and winter was not reported consistently in the PRAs. Though in 7 communities the 'pie tool' was used to draw such information, the results are not clear because they do not separate the summer and winter crops. Therefore, the information provided by the Pie charts was disaggregated by crop and recalculated using the reported percentages of the area covered by various crops in winter and summer. The pie charts presented in Figure 8 present the average percentages of the areas covered by various crops.
Khet land crops in summer consist for 87% of paddy and for 13% of maize, while in winter 61 % lays fallow, 31 % is has a wheat crop, and vegetables are grown on 8%.
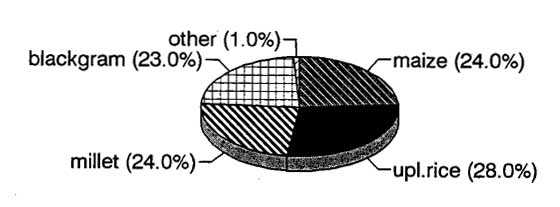
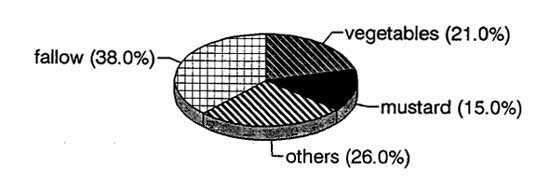
Bari land crops in summer consist for 28% of upland rice, 24% of maize, 24% of millet and 23% of blakgram, while in winter 38% lays fallow, 21% has vegetables, 15% mustard and 26% a series of other crops.
No information was reported on the area covered by various varieties of food grain crops, except for paddy in 5 PRA communities, Ratdanda (Ampipal #5), (Chhoprak #7), Harmi Bhanjang (Harmi #3), Falamkhani (Khoplang #1) and Belbas (Khoplang #4), using pie charts. Of these data, it is also not clear whether they include upland rice or not. The average percentage of improved variety seed used in paddy in these 5 communities ranged from 25% to 50% and was on average 39%. The main local varieties of paddy are Ampjhute, Ekle and Judi. The improved varieties are mainly Mansuli, Jhapali Mansuli, Radha-9, Radha-7, Sabritri and Khumal-4.
Figure 7A. Seasonality Scenario 1: Khet land dominated
Figure 7B. Seasonality Scenario 2: Bari land dominated
Figure 8A. Crop areas Khet land in summer
Figure 8B. Crop areas Khet land in winter
Figure 8C. Crop areas Bah land in summer
Figure 8D. Crop areas Ban land in winter
Table 11. Matrix preference ranking of paddy varieties in 4 PRA communities.
In maize the main local varieties are Sathiya, Bharati, local yellow and to a lesser extent, local white. Improved maize varieties are mainly Rampur composite, Khumal yellow and Arun. The main improved wheat varieties are RR-21, RR-47 and RR-97.
Matrix ranking tools were used to determine farmers preference for paddy and maize varieties. Of the paddy varieties, Jhapali Mansuli was most preferred -though not in every community-, because of its high yield, it is easy to cultivate, and matures early (see also Table 11).
Among the maize varieties Rampur composite was most preferred because of its high yield. In some communities Khumal was also preferred because of its draught tolerance and satisfactory yield (see also Table 12).
Table 12. Matrix preference ranking of maize varieties in 2 PRA communities.
|
Arubote/Mathure (Chhoprak #8) Best = 1; Worst = 3 | |||||
|
Criteria |
Maize varieties | ||||
|
|
Rampur composite |
Khumal Yellow . |
Sathiya |
Bharati |
Khumalt ar |
|
High yield |
1 |
2 |
3 |
|
|
|
Early maturity |
2 |
2 |
1 |
|
|
|
Taste |
2 |
2 |
2 |
|
|
|
No lodging |
1 |
2 |
3 |
|
|
|
Diet (Aadhilo) |
1 |
2 |
1 |
|
|
|
Less disease |
2 |
2 |
1 |
|
|
|
Preferred: Rampur composite because of high yield | |||||
|
Jaisithok (Chhoprak #8) Best = 1; Worst = 3 | |||||
|
Taste when cooked |
|
|
1 |
3 |
2 |
|
Taste when roasted |
|
|
1 |
3 |
2 |
|
Diet (Aadhilo) |
|
|
1 |
3 |
2 |
|
High yield |
|
|
3 |
1 |
2 |
|
Pest tolerance |
|
|
1 |
3 |
2 |
|
Draught tolerance |
|
|
3 |
2 |
1 |
|
Proteinous (Takat Dime) |
|
|
1 |
3 |
2 |
|
Insect resistance (Gun Nalagne) |
|
|
2 |
3 |
3 |
|
Cold (too wet) tolerance |
|
|
1 |
2 |
1 |
|
Preferred: Khumaltar due to satisfactory yield and both draught and cold/wet tolerance | |||||
The current productivity of various crops was reported in 4 PRA communities, Majhgaon (Chhoprak #7), Arubote/Mathure and Firfire (Chhoprak #8) and Katubanse (Chhoprak #9). Current paddy production ranged from 2-5 Muri/Ropani (9) (2000-5000 kg/ha), maize from 1-3 Muri/Ropani (1360-3720 kg/ha), wheat 1.75-3 Muri/Ropani (2380-4080 kg/ha), blackgram from 0.25-0.75 Mori/Ropani (330-990 kg/ha), millet from 0.25-3 Muri/Ropani (310-3720 kg/ha), potato was reported at 10 Muri/Ropani and niger at 0.26 Muri/Ropani.
9 The muri has a different value for different crops, e.g. 50 kg rice, 68 kg maize, 68 kg wheat, 62 kg millet and 66 kg for grams.
In more than half of the PRA communities, the trend line tool was used to gather information on agricultural productivity (Table 13). The overall productivity of the agricultural crops was reported to be declining in 3 PRA communities, Katarbari (Chhoprak #3), Faudargaon (Chhoprak #5) and Arubote/Mathure (Chhoprak #8). It was reported to be increasing for the past 10-15 years only in Simpani (Ampipal #6), while in Darmichaur (Ampipal #9) and Salbot (Chhoprak #4) yield had been rising about 5-7 years back, but had since declined again and now remain constant. This was also the case in Suntale (Khoplang #1), but yields had stabilized at a higher than previous level.
Maize productivity was reported to be decreasing in 7 PRA communities, Chitre (Chhoprak #1), Katubanse (Chhoprak #9), Nawalpur (Harmi #6), Falamkhani (Khoplang #1), and Belbas, Kolkate and Khurpajung (Khoplang #4). It was reported to be increasing in 2 PRA communities, Ratdanda (Ampipal #5) and Harmi Banjang (Harmi #3).
Wheat productivity was reported to be increasing in 3 PRA communities, Ratdanda (Ampipal #5), Katubanse (Chhoprak #9) and Belbas (Khoplang #4).
Millet productivity was reported to be decreasing in Chitre (Chhoprak #1), Belbas and Khurpajung (Khoplang #4), constant in Kolkate (Khoplang #4), and increasing in Falamkhani (Khoplang #1).
Blackgram productivity was reported to be decreasing in 4 PRA communities, Falamkhani (Khoplang #1), and Belbas, Kolkate and Khurpajung (Khoplang #4).
The area of vegetable production was reported to be increasing in Belbas and Kolkate (Khoplang #4).
The rates of increase or decrease of agricultural crop productivity was only reported in a few cases. Two cases were reported of increasing productivity of rice and wheat: rice harvests increased from 2 Muri/Ropani (2000 kg/ha) to 3.5 Muri/Ropani (3500 kg/ha); while wheat harvests increased from 0.5 Muri/Ropani (680 kg/ha) to 1.25 Muri/Ropani (1700 kg/ha). The reasons for increasing productivity trends mentioned in several PRA communities were: use of chemical fertilizer, use of improved varieties, new wheat varieties enabling off-season irrigated wheat production.
No comparable data were provided for decreasing productivity trends. Reasons for decreasing productivity trends mentioned in a number of PRA communities include: use of old seeds, traditional cultivation methods, lack of compost partly due to a decreasing number of livestock, lack of knowledge on the proper application of chemical fertilizers, and a shortage of agricultural labor due to the increased literacy rate.
Table 13. Trends in agricultural crop productivity.
Farmers in 5 PRA communities reported on diseases and pests in their crops, the most common of which were:
1. Paddy diseases Dhaduwa (blight), Maruwa (top die-back) and Beruwa, pest Patero
2. Maize disease Kalopoke, pests Khumrekira (leaf worm). Gun (weevil), Gabaro (stemborer) and Dhamiro.
3. Wheat disease Kalopoke, pests Ankha ma kira, Gun (weevil) and Gabaro (stemborer).
During the transect walks a number of problems in agricultural crop production were identified and opportunities or possible solutions discussed. These have been summarized in Table 14.
Table 14. Problems and opportunities in agricultural crop production.
|
PRA communities |
Problem/weakness |
Opportunity/solution |
|
Katubanse (Chhoprak #9), Suntale and Falamkhani (Khoplang #1), Belbas, Kolkate and Khurpajung (Khoplang #4) |
*Traditional cultivation methods in Bari land |
*Conservation and utilization of water resources for:(i) vegetable production,(ii) improved cultivation, and(iii) expand winter cropping |
|
Darmichaur (Ampipal #9), Amarai (Chhoprak #3), Salbot (Chhoprak #4), Arubote/Mathure (Chhoprak #8) and Harmi Bhanjang (Harmi #3) |
*Low proportion of improved paddy varieties (only 15-20% of total area) |
*Organize farmers group for:(i) arranging improved seeds; and(ii) improved cultivation training. |
|
Thumki (Chhoprak #2) and Harmi Bhanjang (Harmi #3) |
*Low amount of fruit trees *Inadequate irrigation |
*Increase fruit tree plantation |
|
Faudargaon (Chhoprak #5) and Jaisithok (Chhoprak #8) |
* Decreasing soil fertility |
*Training for increasing fruit utilization |
|
Ratdanda (Ampipal #5) |
* Little utilization of water resources * Low amount of cash crop and vegetable crop |
*Increase vegetable production by conservation and utilization of water resources |
|
Firfire (Chhoprak #8) |
* 50% of cropland has irrigation but improved cultivation has not been widely adopted |
*Possibilities of Alainchi (cardamom) and production of other fruits |
3.4.1 Livestock population and herd composition
3.4.2 Trend in animal production
3.4.3 Fodder and feed
3.4.4 Problems and opportunities
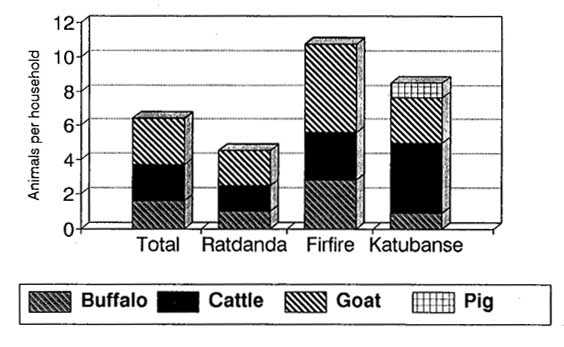
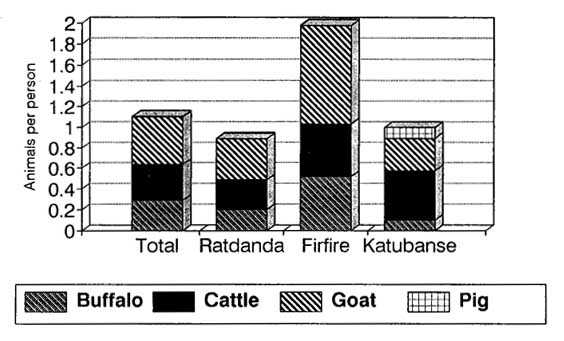
Detailed livestock data were collected in 25 PRA sites, including buffalo, cattle, goats and pigs. The very few sheep in the Bhusunde Khola watershed, they were included in the goat counts. Data on livestock numbers per PRA community are presented in Table 1 5. Table 1 6 and Figure 9 include secondary data on numbers of animals per household and per person, based on the data in Table 2 and 15.
Overall, the number of animals per PRA community ranges from 131 in Chiuribot (Chhoprak #1) to 61 5 in Harmi Bhanjang (Harmi #3}. However, the data of numbers of animals per household and per person are more meaningful and within a much shorter range. The herd size per household averages is on average 6.3, and ranges from 4.5 in Belbas (Khoplang #4) to 10.9 in Firifire (Chhoprak #8). The number of animals per person ranges from 0.79 in Nawalpur (Harmi #6) to 1.99 in Firfire (Chhoprak #8).
Buffalo is the most valued animal. It is kept for milk and manure production, and can also be consumed or sold for slaughter. Buffalos are stallfed, and require high amounts of quality fodder, animal bedding material, water and care. There are 2565 buffalos in 25 of the PRA communities. By far the largest number of buffalos, 287, can be found in Ghimiregaon (Harmi #6), which has also the highest ratio of buffalos per family and per person, while there were only 37 buffalos each in Chiuribot (Chhoprak #2) and Katubanse (Chhoprak #9). The number of buffalos per family is on average 1.6, and fluctuates from 0.9 in Katubanse (Chhoprak #9) to 3.6 in Ghimiregaon (Harmi #6). The number of buffalos per person ranges from 0.10 in Katubanse (Chhoprak #9) to 0.56 in Ghimiregaon (Harmi #6).
Cattle are important as draft animals for ploughing (oxen), and for religious purposes. They are seasonally and/or partially stallfed. The are a total of 3119 cattle in 25 of the PRA communities, ranging from 29 in Chiuribot (Chhoprak #1) to 193 in Ghimiregaon. The average number of cattle per household is 2.1, ranging from 1.5 in Ratdanda (Ampipal #5), Harmi Bhanjang (Harmi #3) and Nawalpur (Harmi #6) to 4.1 in Katubanse (Chhoprak #9). The number of cattle per person ranges from 0.24 in Nawalpur (Harmi #6) to 0.52 in Firfire (Chhoprak #8), and averages at 0.35.
Goats are usually free grazing, seasonally controlled. They are kept for meat consumption and sale. There are a total of 4,161 goats in the 25 PRA communities, ranging from 65 in Chiuribot (Chhoprak #1) to 261 in Harmi Bhanjang (Harmi #1). The number of goats per household is on average 2.7, and ranges from 1.3 in Belbas (Khoplang #4) to 5.2 in Firfire (Chhoprak #8). The number of goats per person ranges from 0.26 in Belbas (Khoplang #4) to 0.95 in Firfire (Chhoprak #8), and averages at 0.47.
Pigs are only kept by ceratin caste/ethnic groups, and are relatively rare in the watershed, they can only be found in 4 communities, Darmichaur (Ampipal #9), Jaisithok (Chhoprak #8), Katubanse (Chhoprak #9) and Khurpajung (Khoplang #4). The total number of pigs is 87, 45% of which are in Katubanse (Chhoprak #9). The number of pigs per household is on average 0.1, but in Katubanse (Chhoprak #9) this reaches 0.9. The number of pigs per person is on average 0.01, but in Katubanse (Chhoprak #9) this reaches 0.11.
With regard to herd composition, 42% of the domestic animals are goats, 31 % cattle, 26% buffalos and 1% pigs. Ghimiregaon (Harmi #6) has the largest proportion of buffalos, 40%, and Katubanse (Chhoprak #9) the lowest, 10%. Katubanse (Chhoprak #9) has the largest proportion of cattle, 47%, and Chiuribot (Chhoprak #1), Majhgaon and Bawaligaon (Chhoprak #7) the lowest, 22%. Majhgaon (Chhoprak #7) has the largest proportion of goats, 56%, and Belbas (Khoplang #4) the lowest, 29%. Katubanse has by far the largest proportion of pigs, 11 %, while in 21 of 25 communities there are no pigs at all.
Table 15. Livestock population in 25 PRA communities of the Bhusunde Khola watershed.
Figure 9A. Livestock Animals per household
Figure 9B. Livestock Animals per person
Data on trends in animal production were recorded in 20 PRA communities, though it is not specified whether this concerns animals per community or per household (Table 17). Of these, eight communities only reported on overall animal numbers, while 12 provided details on buffalo, cattle and goats.
In general there was a decline in livestock population for the last 10 years. Cattle were always reported to decline. Buffalos were reported to have increased in two communities, Simpani Hatiya (Ampipal #7) and Belbas (Khoplang #4) and decreased in 10 communities. Goats were reported to have decreased in six communities, first decreased and subsequently increased in three communities, increased in one community, and remained stable also in one community.
Table 17. Trend in livestock numbers in 20 PRA communities of the Bhusunde Khola watershed.
The actual scale of the overall decrease in the livestock population was reported in two communities. In Katubanse (Chhoprak #9) the number of buffalos per household had decreased from an average of 8-9 to 1-2, and the number of cattle had decreased from 7-8 to 2-3 (though the data in Table 16 suggest an average number per household of 4.1 cattle and 0.9 buffalo). In Nawalpur (Harmi #6) the number of animals per household had declined for buffalo from 6 to 2, for cattle from 1 5 to 4, and for goats from 10 to 4 (though Table 16 suggest 1.5 buffalo, 1.5 cattle and 2.0 goats).
In 9 PRA communities the causes of the overall decline in livestock numbers were recorded. These can be summarized as:
(i) Increased settlement areas.
(ii) Decrease in tree fodder and grasses that can be cut and carried.
(iii) Decrease in grazing land, associated with an increase in off-season (winter) cultivation in Bari land, which used to lay fallow during this period.
(iv) Decrease in labor availability, linked to increased school attendance and literacy rates.
(v) Increasing difficulties in keeping large ruminants, with costs rising and decreasing profit.
In the villages where the goat population had increased this was explained by an increasing demand for meat and the sale for cash of goats.
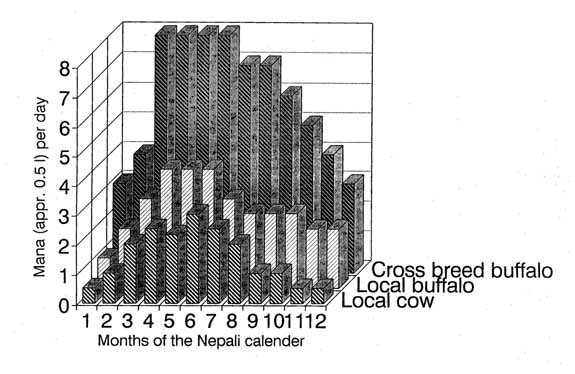
In the villages where the buffalo population had increased this was explained by the increasing importance of milk (see also Figure 10).
In the communities of Majhgaon and Bawaligaon (Chhoprak #7) some prices of livestock and animal products were recorded, see Table 18.
Table 18. Some prices of livestock and animal products (in December 1995).
|
Animal or product |
Unit |
Price in Rs. |
|
Cow (milking) |
animal |
2,500 (+\-500) |
|
Oxen (young) |
pair of animals |
7,000 (+\-1,000) |
|
Local buffalo (milking) |
animal |
5,500 (+\-1,500) |
|
Cross breed buffalo (milking) |
animal |
12,000 |
|
Female goat (calving age) |
animal |
1,500 |
|
Castrated buck (for meat) |
kg live weight |
100 |
|
Buffalo bull (for meat) |
kg live weight |
40 |
|
Pigs (for meat) |
kg live weight |
40 |
|
Milk |
libre |
20 |
|
Ghee |
kg |
200 |
Animals are mainly stallfed, but in winter and spring cattle and goats are usually taken out for grazing of fallow cropland and grazing areas. Paddy straw is the most important fodder and is being fed throughout the year, but primarily from November to mid-June (Kartik to Jestha). Paddy straw is dried and stored for use in the winter and dry season. Fresh cut grasses from terrace risers and bunds, as well as community lands, are fed from June through October (Jestha to Kartik), supplemented with weeding and thinning plant material from the grain crops. Tree fodder is mainly used from mid-November to mid-February (Kartik to Fagun), and to a lesser extent in the month of May (Baisakh to Jestha). During December (Mansir to Poush) dried stovers are also fed.
Concentrates, Kundo, are fed to the oxen before and during the ploughing period from March to July (Baisak to Ashad), and to buffalos during calving in April (Sawan to Badra), and to both buffalos and cattle during the coldest part of the year, from December to February (Mangsir to Faghun).
Figure 10. Seasonal milk production Cross breed and local buffalo, and cow
Table 19. Matrix ranking of fodder tree preferences in 7 communities.
In most of the communities farmers preferred Tanki (Bauhinia variegata) as fodder tree for the following reasons: (a) fast growing; (b) increased milk production; (c) highly palatable; (d) branches also good as fuelwood; and nutritious (Table 19).
During transect walks a number of problems and weaknesses were identified and opportunities and possible solutions discussed. These have been summarized in Table 20.
Table 20. Problems and opportunities in livestock production.
|
PRA communities |
Problem/weakness |
Opportunity/solution |
|
Chiuribot and Thumki (Chhoprak #2), Jaisithok and Arubote/Mathure (Chhoprak #8), Suntale (Khoplang #1), Belbas, Kolkate and Khurpajung (Khoplang #4) |
*Lack of improved breed |
*Livestock management training *Arrangement to obtain improved Buffalo bulls and bucks |
|
Simpani Hatya (Ampipal #7) |
*No stallfeeding, mostly grazing, due to lack of fodder trees |
*Plantation of tree species suitable for fodder and fuel on private land |
|
Katubanse (Chhoprak #9) |
*No grazing areas |
* Improved livestock management training |
|
Chitre (Chhoprak #1), Bawaligaon (Chhoprak #7), Nawalpur and Ghimiregaon (Harmi #6} |
*Lack of fodder (tree and grass) |
*Organize buffalo groups for: (1) fodder trees and grass plantation; (2) milk marketing; (3) animal health worker training |
|
Harmi Bhanjang (Harmi #3) |
*Lack of improved buffalo bulls *Lack of improved fodder |
* Obtain improved buffalo |
|
Falamkhani (Khoplang #1) |
*Low milk production |
*Increase number of fodder trees on terrace risers and bunds |
3.5.1 Forest types
3.5.2 Production and use
3.5.3 Trends in forests and natural resources
3.5.4 Problems and opportunities
There are three main forest types in the Bhusunde Khola watershed:
1. Chilaune-Katus (Schima-Castanopsis) forest is the most frequent occurring, it is also associated with tree species such as Baddhairo (Lagerstroemia) and Tindu (Dyspyrus).
2. Sal (Shorea robusta) forest is common on the lower altitudes and north facing slopes around Belbas, Kolkate and Khurpajung (Khoplang #4).
3. Degraded bush-type forest with small trees and shrubs, such as Ghangeri, Angeri, Baddyangro and Khar grass.
The Pie chart tool was exercised in only three communities, Belbas, Kolkate and Khurpajung (Chhoprak #4), to identify the proportion of the different forest types of the total forest of those communities (see Table 21).
Table 21. Proportion of 3 different forest types of total forest of three PRA communities.
|
PRA community |
Proportional representation of three forest types |
||
|
Chilaune-Katus forest |
Sal forest |
Degraded-bush |
|
|
Belbas (Khoplang M) |
25% |
50% |
25% |
|
Kolkate (Khop. #4) |
15% |
75% |
10% |
|
Khurpajung (Khop. #4) |
45% |
40% |
15% |
Forest patches are protected and managed traditionally. Thinning in Sal forest has recently started.
Natural forests and trees on terrace risers and bunds are the two major sources of fuelwood. Disaggregated information on fuelwood sources have not been collected consistently in the PRAs. The PRA facilitators estimate that about half the fuelwood requirements are met by on-farm resources, and about half by the forest, while kerosene and biogas also are important sources of energy.
In three PRA communities information on energy source were collected. In Ghimiregaon (Harmi #6) up to 95% of the fuelwood requirements were met from on-farm resources, and just 5% from the forest. In Harmi Bhanjang (Harmi #3) 30% of the energy needs were met from biogas, 90% of the remaining 70% (i.e. 63%) of fuel needs was met from the local forest, and the balance (7%) from other on-farm sources. Similarly, in Simpani Hatiya (Ampipal #7), biogas provided 14% of fuel requirements, and fuelwood and kerosene the balance.
In Harmi Bhanjang, Venn diagrams were used to determine the relative importance of different forest products. The result was that farmers gave almost equal weight to fuelwood and fodder/animal bedding material (with a priority for fuelwood), and less importance to timber.
In eight communities the trend line exercise was used for soil erosion. All of these reported increasing soil erosion during recent decades. According to farmers the meaning of the term "soil erosion" was expansion of gullies and increased frequency of land slides and slips.
In twelve communities the trend line exercise was used for the status and quality of the forest for the past 10-20 years. Out of these 12, 4 reported a decreasing trend, Simpani (Ampipal #6), Faudargaon (Chhoprak #5), Bawaligaon (Chhoprak #7) and Harmi Bhanjang (Harmi #3). In 7 other communities, Simpani Hatiya (Ampipal #7), Darmichaur (Ampipal #9), Chitre (Chhoprak #1), Katarbari (Chhoprak #3), Arubote/Mathure (Chhoprak #8), Suntale and Falamkhani (Khoplang #1) decreasing trends were reported upto about 2040 BS (1982), but since then an increasing trend was noted, due to increased awareness of the forest users. In Ratdanda (Ampipal #5) the forest was reported to have remained stable for the past 20-30 years.
During transect walks a number of problems and weaknesses in forests were identified and opportunities and possible solutions discussed. These have been summarized in Table 22.
A summary of the different problem areas pertaining to soil and water resources is included in Table 23.
Table 22. Summary of problems and opportunities in forests of the Bhusunde Khola watershed.
|
PRA community |
Problem/weakness |
Opportunity/solution |
|
Simpani (Ampipal #6), Thumki (Chhoprak #2), Tutunga and Arubote/Mathure (Chhoprak #8) |
*Lack of forest |
*Explore possibilities of private forest |
|
Ratdanda (Ampipal #5), Simpani Hatiya (Ampipal #7), Faudargaon (Chhoprak #5), Jaisithok (Chhoprak #8) and Khurpajung (Khoplang #4) |
*Little forest area |
*Enrichment plantation through discussion with user group |
|
Firfire (Chhoprak #8) and Harmi Bhanjang (Harmi #3) |
*No community forest and no agroforest |
*Organize group and discuss forest development |
|
Falamkhani (Khoplang #1) |
*Lack of knowledge of improved stoves |
*Extension activities on improved stoves |
Table 23. Summary of communities with specific soil and water resource problems in the Bhusunde Khola watershed.
|
PRA communities |
Soil and water resource problems |
|
Ratdanda (Amp. #5), Darmichaur (Amp. #9), Chitre (Chhop. #1), Amarai (Chhop. #2), Salbot (Chhop. #4), Faudargaon (Chhop. #5), Tutunga and Firfire (Chhop. #8), Katubanse (Chhop. #9), Harmi Bhanjang (Harmi #3), Ghimiregaon (Harmi #6), Falamkhani (Khop. #4) |
Gully and landslide |
|
Simpani (Amp. #6), Nawalpur and Ghimiregaon (Harmi #6), Suntale and Falamkhani (Khop. #1) |
Drinking water |
|
Simpani (Amp. #6), Tutunga, Firfire and Arubote/Mathure (Chhop. #8), Ghimiregaon (Harmi #6), Falamkhani (Khop. #1) |
Irrigation |
|
Simpani Hatiya (Amp. #7) |
Drinking water maintenance |
|
Simpani Hatiya (Amp. #7), Salbot (Chhop. #4), Chitre (Chhop. #1>, Firfire (Chhop. #8), Katubanse (Chhop. #9), Nawalpur (Khop. #6), Kolkate (Khopl. #4) |
Trail |
|
Ratdanda (Amp. #5), Simpani Hatiya (Amp. #7), Amarai (Chop. #2}, Majhgaon (Chhop. #7), Belbas, Kolkate and Khurpajung (Khop. #4) |
Water source protection |
|
Katubanse (Chhop. #9) |
Slides in terraces |
|
Amarai (Chhop. #2}, Belbas (Khop. #4) |
Poor quality of irrigation channel |
![]()
![]()
![]()