by
B.E. Brown, V.C. Anthony, E.D. Anderson,
R.C. Hennemuth and K. Sherman
Northeast Fisheries Center
Woods Hole, Massachusetts 02543
USA
Resumen
Los recursos pesqueros en las áreas mar afuera frente a las costas Noreste de los Estados Unidos, han experimentado perturbaciones significativas debida a la pesca durante los últimos 25 años. Antes de 1960 esta área era casi exlusivamente explotada por los Estados Unidos con solo algunos barcos canadienses dedicados a la explotación de peces. Esta actividad extractiva se concentró básicamente en especies de alto valor en el mercado Norteamericano, estas eran principalmente especies de fondo y conchas marinas. La única pesquería pelágica significativa era la pesquería de arenque juvenil a lo largo de la costa de Maine y la bahía de Fundy. Algunas especies semipelágicas como la merluza dorada soportaron una pesquería solo modesta. La pesquería en el área del Banco de Georges era casi exclusivamente basada en peces de fondo, platija y la extracción de conchas. Prácticamente no hubo ninguna pesquería en el borde de la plataforma continental en el área al medio del Atlántico.
Pesquerías de flotas pesqueras de altura de Europa y Japón expandieron silenciosamente sus pesquerías a fines de 1960 y entraron en esta área. Un componente principal de estas pesquerías fue dirigido a los stocks pelágicos de arenque del Atlántico y caballa del Atlántico capturados en el Banco de Georges y en la porción exterior de la plataforma continental del área del Atlántico Central. Estas pesquerías también se concetraron en la merluza dorado semipelágica y posteriormente capturó grandes cantidades de calamar (especies de Illex y Loligo), cazones y tiburones. Esta pesquería alcanzó su maximo a principio de los años 1970s y las médidas de regulación comenzarón a tener como tal resultado una disminución del esfuerzo de pesca. En 1977 con la extensión de la Jurisdicción, del estado costero por parte de Estados Unidos las pesquerías por parte de flotas extranjeras de altura fueron casi virtualmente eliminadas.
Los resultados de los reconocimientos con redes de arrastre del Northeast Fisheries Center (Clark and Brown 1977) indican que la biomasa de peces y calamares en toda el área disminuyeron en un 65% en el período de 1964 a 1975 con una estabilización en el período. El Northeast Fisheries Center tuvo la oportunidad para seguir la respuesta de los stocks a las medidas drásticas de disminución del esfuerzo de pesca que resultó de las regulaciones restrictivas.
La reducción de la presión de pesca ha sido selectiva en el sentido de que todavía continua una presión de pesca muy fuerte sobre los peces de fondo y los stocks de platija aun cuando estas se han reducido significativamente por debajo de lo que era en sus períodos máximos. Sin embargo, para el caso de merluza dorada, arenque y caballa, la presión de pesca es ahora casi inexistente. A pesar de esta reducción en la presión de pesca hay una virtual ausencia de arenque en el Banco de Georges en el momento. La última clase anual fuerte fue la de 1970 y de cuando esta clase anual fue removida de la población (presumiblemente por una fuerte pesquería) ha habido muy poca evidencia de la presencia de arenque en el Banco de Georges.
La caballa ha ido aumentado lentamente y ahora se encuentra a niveles similares a aquellos que tenía a inicios de los años 1960s. Su abundancia es mucho menor que la que tenía durante los inicios de los años 1970s cuando dos clases anuales muy buenas ingresaron a la pesquería. Estas clases anuales entraron a la pesquería en el período en que las fuertes clases anuales de arenque que habían soportado el desarrollo de la pesquería de altura de arenque estaban siendo removidas del escenario.
La merluza dorada se ha recuperado solo ligeramente y ya no es la especie dominante en el área. Los stocks de tiburones todavía se mantienen a niveles relativamente altos a pesar de la intensa pesquería a que fueron sometidos hacia el final de la época en que actuó la pesquería de altura de otros estados, y en estos momentos representan el mayor volumen de predatores de peces en esta área.
Los calamares, tanto Loligo, como Illex, se expandieron en la última parte del período correspondiente a las actividades de la pesquería de altura alcanzando sus períodos máximos después que las poblaciones de caballa y arenque. Estas poblaciones se encuentran ahora ligeramente más bajas de lo que estuvieron antes, pero todavía son abundantes. A mediados de los años 1970s hubo una expansión de la población de Ammodytes la cual parece haber desaparecido nuevamente.
Hacia 1980 los recursos de peces de fondo comenzaron a recuperar esencialmente la misma mezela de especies que existió antes de que comenzara la intensa pesquería por las flotas de altura. Sin embargo, muy recientemente, las poblacione de pescadilla han sido reducidas drásticamente por una pesquería muy intensa por parte de los Estados Unidos y Canadá y aun cuando todavía constituyen un principal componente las capturas (no como el arenque que es casi inexistente) ocupa una proporción menor de la biomasa del ecosistema que la que ocupó en el período anterior.
INTRODUCTION
Finfish and squid resources in the offshore areas off the Northeast Coast of the United States (Fig. 1, International Commission for the Northwest Atlantic Fisheries (ICNAF)/Northeast Atlantic Fishery Organization (NAFO) Subareas 5 and 6) have experienced significant perturbations due to fishing during the past 25 years. Prior to 1960, this area was fished (except for scallops) almost exclusively by the United States. These finfish vessels concentrated primarily on groundfish and Atlantic herringl (Clupea barengus), species of high market value to Canada and the United States (US). Although herring constituted a major fishery, it was predominantly directed towards juveniles which were harvested in inshore areas and packaged as sardines. Distant water fleets from Europe and Japan expanded their fisheries in the 1960's in this area and increased catch of both traditional and newly fished species occurred (Fig. 2). The sum total of these fisheries affected the entire offshore finfish plus squid resources, including the groundfish, e.g. Atlantic cod (Gadhus morhua), haddock (Melanogrammus aeglefinus), flounder, etc., pelagics, e.g. Atlantic mackerel and herring, semi-pelagics, e.g. silver hake (Merluccius bilinearis), and Illex and Loligosquid. However, by far the greatest effort was directed at herring and mackerel.
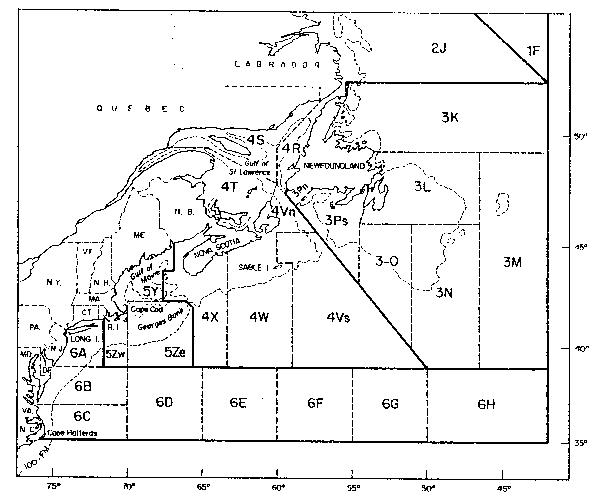
Fig. 1. Northwest Atlantic Ocean partitioned into ICNAF/NAFO Subares and Divions.
Beginning in the early 1970's, ICNAF began catch regulations to restrict fishing mortality in these waters. In 1972 the ICNAF treaty was changed to allow for the national allocation of catch quotas (prior to that only a single overall quota could be established). Immediately in January 1972 a total allowable catch with national allocations was established for herring. Mackerel catch regulations were first implemented in 1973, much earlier in relationship to the start (1968) of that heavy distant water fleet fishery than for herring. By 1974, a full array of restrictions that did reduce total fishing effort were in place. In 1977 the enactment of 200-mile fishery zones by Canada and the United States resulted in further reductions, especially drastic in the distant water fleet's fishing effort in the waters south of Nova Scotia. However, after extended jurisdiction, there were increases in fishing effort in various US and Canadian fisheries primarily for groundfish.
1 Common names of fish are those given in Robins 1980; the term Atlantic before cod, mackerel, and herring is dropped after the first usage.
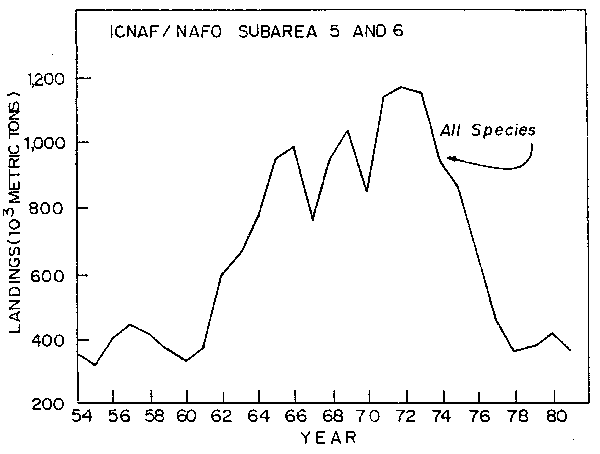
Fig. 2. Total nominal catch of all species in ICNAF/NAFO Subareas 5 and 6, 1954-81.
In examining trends in fishery resources over time it is important to consider three interrelated factors that drive fishery systems: the physical environment, fishing, and biological interactions. The predominant factor in many fisheries systems is the driving force of the relative strengths of recruiting year-classes (Hennemuth et al., 1980). It is generally considered that it is in the survival of early life history stages (i.e. eggs and larvae) that the physical factors are most critical. Obviously the number of initial spawning products is determined by spawning stock size. The relative abundances of predators and food are also important. The effects of the physical environment, except for long-term climatic trends and the alteration of habitat, tend to average out over time as resources have evolved to exist in the environment in which they are found. This is also true of the interactions with the predator-prey biological components in the ecosystem. Thus, to a considerable extent the variations in recruitment can be dealt with as a statistical distribution problem (Hennemuth et al., 1980).
The entrance of humans as an extremely heavy predator introduces a factor outside of those with which species have evolved to coexist. To some extent fishing can be considered another form of predation to which these resources have adapted, and this is certainly logical when fishing effort is moderate and the market system causes the fishing effort to respond to the densities of the prey. However, this area of the Northwest Atlantic was subjected to extremely heavy fishing pressure that not only did not fluctuate with abundance of prey, but to some extent increased as fish stocks decreased.
The effects of fishing can be two-fold. First, there is the direct reduction of an individual resource, reducing its presence in the ecosystem for a considerable period of time. The length of time the resource is depressed in abundance depends to a certain degree on the presence and shape of any stock recruitment relationship and the chance interactions with environmental conditions that would produce strong year classes despite small spawning stocks. This kind of effect would, however, be expected to be entirely reversible over a fairly short time period. Secondly, beyond the direct effect on individual stocks there is the potential disruption of normal competitive predator-prey interrelationships which could alter the structure of the ecosystem and result in a change in species composition and dominace. Fishing can cause these interrelationships to be in a state of rapid disequilibrium as opposed to a less rapid or really different one. Changes in these interrelationships might be expected to be of a longer term, possibly semi-permanent nature.
This paper will review the historical patterns in nominal catch (i.e., those catches reported to the appropriate governmental statistics agencies and in this case recorded in NAFO files in Dartmouth, N.S., Canada), and abundance of the fisheries resources, and will discuss some hypotheses as to the responses of these stocks in the face of the extreme perturbations resulting from heavy fishing pressure.
TRENDS IN FISHERIES AND POPULATIONS
Total Finfish Plus Squid Resource Abundance
Estimates of resource abundance are available from both commercial and recreational fisheries data and from research vessel surveys (Grosslein, 1969; Clark, 1981). Taken together they provide a comprehensive picture of resource trends. Estimates from fisheries data are limited to those species supporting the largest and most important fisheries such as mackerel, herring, haddock, silver hake, cod, and yellowtail flounder (Limanda ferruginea). Standardized research vessel bottom trawl surveys provide comprehensive coverage over the Georges Bank, Gulf of Maine, and Mid-Atlantic areas. They have been conducted since 1963 in the autumn and 1968 in the spring by research vessels of the Northeast Fisheries Center (NEFC). Prior to 1967 surveys went only as far south as Hudson Canyon; since then they have been extended South to Cape Hatteras. These annual autumn and spring research vessel surveys have been supplemented occasionally by summer and winter surveys. Regular inshore surveys have also been conducted by the State of Massachusetts for part of this coastal area. In addition, research vessels from the Soviet Union, Poland, the Federal Republic of Germany, the German Democratic Republic and France have cooperatively surveyed the area at various times (Azarovitz, 1981).
Survey results indicate that the offshore finfish and squid biomass in NAFO Subareas 5 and 6 decreased by 65% in the period 1964-1975 following the period of greatest catches (Clark and Brown, 1977; Fig. 3; Table 1). The downward trend then reversed itself as resources began to recover after catches were reduced (Clark and Brown, 1979) and by 1980-81 biomass had increased about 50% of the way towards that existing in the early 1960's (Resource Assessment Division, 1982).
Herring
Herring have been harvested from inshore waters of the New England coast for at least 400 years. The major fishery for herring in the Northwest Atlantic during the early part of the nineteenth century was for large herring in the eastern Maine-Bay of Fundy area. The canning of sardines began in 1875 and was a leading fishery for herring through the first half of the twentieth century. The catch of herring in the Northwest Atlantic from Newfoundland to North Carolina remained fairly constant from 1920 to 1940 between 60,000 and 100,000 tons (Anthony, 1972). The total catch more than doubled in the late 1940's and then gradually declined to approximately 180,000 tons through the 1950's. During the 1960's the catch increased dramatically to over 900,000 tons as new fisheries developed. The very important Georges Bank fishery began in 1961 and the Nova Scotia adult purse seine fishery began in 1964-65. The Gulf of St. Lawrence fishery intensified after 1965, and the western Gulf of Maine-Jeffreys Ledge fishery for adult herring began in 1967. In the Georges Bank-Gulf of Maine area, there have been two juvenile fisheries and in recent times three adult fisheries. The two juvenile fisheries occur along the Maine coast and along the New Brunswick coast. The adult fisheries (also taking some age 3 juvenile herring) have existed on Georges Bank, Jeffreys Ledge in the western part of the Gulf of Maine, and off southwestern Nova Scotia (Anthony and Waring, 1980a). All three adult herring fisheries began as autumn fisheries, harvesting spawning herring of age 4 and older, while the juvenile fisheries have concentrated on harvesting young herring ages 1-3. In the early 1900's the juvenile herring fishery on the Maine coast harvested about 60,000 tons per year and then declined to 25,000 tons on average from 1917 to 1940. The catch increased from the late 1940's through the 1950's to about the 60,000 ton level and then again declined to less than half of that from 1970 to 1975. After 1975 the Maine juvenile fishery began to improve again with catches varying from 30,000 to 48,000 tons. The New Brunswick juvenile fishery fluctuated in a similar pattern to that along the Maine coast although at a higher level of catch. The catch of herring from the New Brunswick juvenile fishery averaged 56,000 tons from 1964 to 1969, 28,000 tons from 1970 to 1976, and 34,000 tons since then.
| Species | 1967 | 1968 | 1969 | 1970 | 1971 | 1972 | 1973 | 1974 | 1975 | 1976 | 1977 | 1978 | 1979 | 1980 |
|---|---|---|---|---|---|---|---|---|---|---|---|---|---|---|
| Cod | 4.5 | 5.0 | 4.4 | 5.1 | 4.6 | 6.4 | 6.4 | 2.9 | 4.4 | 4.2 | 5.7 | 9.0 | 7.0 | 5.4 |
| Haddock | 8.1 | 5.8 | 3.8 | 4.0 | 2.4 | 2.2 | 3.3 | 1.3 | 4.4 | 8.7 | 9.0 | 18.9 | 11.5 | 7.7 |
| Redfish | 8.2 | 13.6 | 7.9 | 11.1 | 7.9 | 8.3 | 5.7 | 7.7 | 13.4 | 5.1 | 5.8 | 7.1 | 5.4 | 4.2 |
| Silver hake | 2.3 | 2.5 | 1.8 | 2.0 | 2.4 | 3.6 | 2.6 | 1.9 | 4.2 | 5.6 | 3.6 | 4.0 | 3.4 | 3.8 |
| Red hake | 1.0 | 1.6 | 1.8 | 1.3 | 1.7 | 2.6 | 1.6 | 0.7 | 3.0 | 2.1 | 2.9 | 2.4 | 2.1 | 3.4 |
| Pollock | 1.2 | 1.9 | 4.2 | 1.2 | 2.2 | 2.7 | 2.1 | 1.8 | 1.2 | 10.5 | 5.2 | 3.4 | 2.6 | 1.6 |
| Yellowtail | 4.8 | 5.6 | 5.2 | 4.2 | 2.9 | 7.9 | 1.6 | 1.0 | 0.5 | 0.7 | 1.1 | 1.0 | 0.8 | 1.7 |
| Other flounder | 4.6 | 5.4 | 5.1 | 5.1 | 3.5 | 4.3 | 4.2 | 3.5 | 4.1 | 4.9 | 7.6 | 7.6 | 6.7 | 8.2 |
| Herring | 0.3 | 0.1 | 0.1 | 0.01 | 0.3 | 0.1 | 0.01 | 0.01 | 0.1 | 0.01 | 0.01 | 0.1 | 0.01 | 0.01 |
| Mackerel | 0.3 | 0.2 | 1.1 | 0.01 | 0.01 | 0.1 | 0.01 | 0.01 | 0.01 | 0.01 | 0.01 | 0.1 | 0.1 | 0.1 |
| Other finfish2 | 80.9 | 47.1 | 89.2 | 49.3 | 33.6 | 43.3 | 54.5 | 27.4 | 49.9 | 50.2 | 62.7 | 53.0 | 71.0 | 63.5 |
| Short-finned squid | 0.2 | 0.3 | 0.1 | 0.3 | 0.4 | 0.3 | 0.3 | 0.4 | 1.5 | 7.8 | 3.9 | 4.8 | 7.5 | 3.4 |
| Long-finned squid | 2.8 | 5.1 | 6.8 | 2.2 | 2.1 | 4.6 | 7.6 | 5.8 | 7.6 | 8.1 | 5.7 | 3.0 | 2.7 | 5.6 |
| Total finfish and squid | 119.2 | 94.2 | 131.5 | 85.8 | 64.0 | 86.4 | 89.9 | 54.4 | 94.3 | 108.0 | 113.3 | 104.4 | 120.7 | 108.6 |
2 Does not include data for tunas, sharks, swordfish, American eel, or white perch.
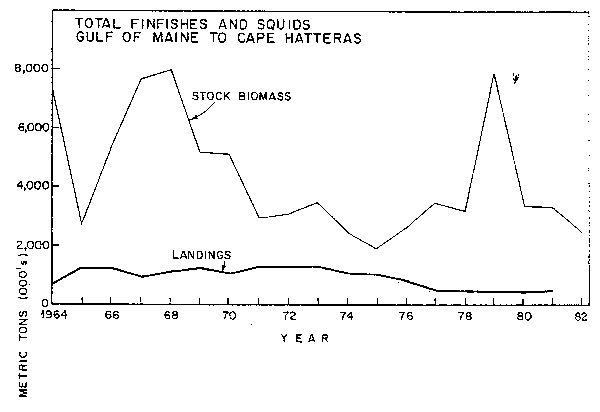
Fig. 3. Stock biomass and nominal catch of total finfishes and squids, Gulf of Marine to Cape Hatteras. Note: Low point in 1965 due to under-representation of pelagics in bottom trawl survey and high point in 1979 due to overreoresentation of pelagics.
The Gulf of Maine fishery for adult herring began in 1967 with annual catches increasing to nearly 40,000 tons up to 1972 as the accumulated stock was finished up. In 1967-68 when the fishery began, the stock size (age 4 and older) averaged 150,000 tons. After 1972 until the present time, catches have fluctuated between 15,000 and 24,000 tons annually and the stock size has fluctuated between 31,000 and 88,000 tons. The adult fishery off southwestern Nova Scotia was a minor fishey until the mid-1960's when new processing plants were built and catches rapidly increased to a peak of 178,000 tons in 1970. This stock is several times larger than the stock or stocks being fished upon in the western Gulf of Maine area. In 1967-68 the stock size (age 4 and older) averaged 547,000 metric tons. This stock has since been overfished and the catches have been declining steadily since its large increases in the late 1960's to levels of 70,000 tons in the early 1980's. The stock size decreased to a low of 95,000 tons 1979 and slightly increased in 1980-82. (Figure 4).
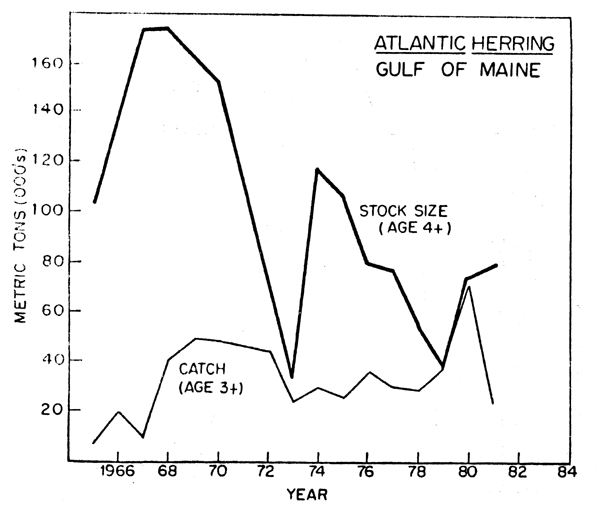
Fig. 4. Stock size and nominal catch of Atlantic herring in the western Gulf of Marine
The largest herring stock and fishery in the Northwest Atlantic has been the Georges Bank stock which was not fished until 1961 (Anthony and Waring, 1980b). After discovery of this stock by the Soviet Union exploitation increased rapidly until 13-14 nations were fishing on this stock in the late 1960's and catches increased to 374,000 tons in 1968. The stock size (age 4 and older) reached a peak in 1967 of 1.4 million tons, rapidly declined during the early 1970's to 144,000 tons in 1973, and recovered slightly in 1974 to 342,000 tons due to a very strong 1970 year class. This recovery only delayed overfishing by a few years and the fishery ended in 1977 (Fig. 5). The production of larvae from the Georges Bank spawning areas since 1977 has been nearly nonexistent.
In summary, by 1982 the Georges Bank fishery had ended, the Nova Scotia fishery was declining, the Jeffreys Ledge or western Gulf of Maine fishery was continuing at its recent level of harvest and the two juvenile fisheries were also continuing at moderate levels of harvest.
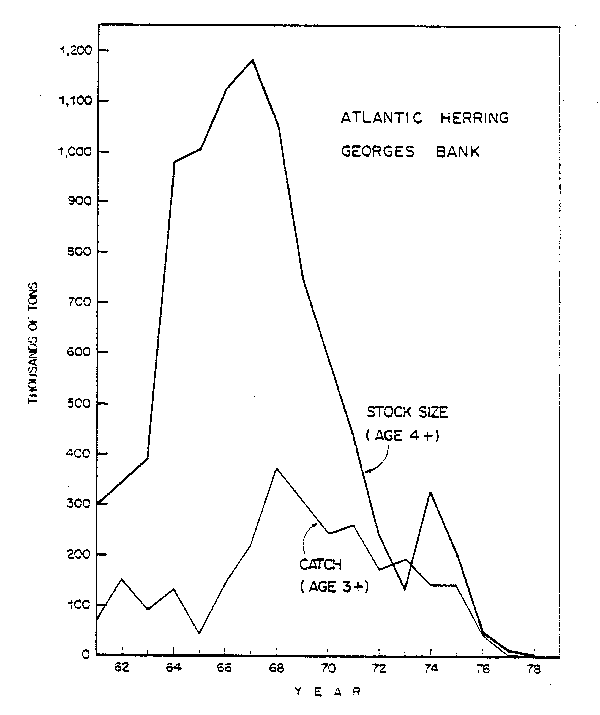
Fig. 5. Stock size and nominal catch of Atlantic herringg on Georges Bank.
TRENDS IN FISHERIES AND POPULATIONS
Mackerel
Mackerel in the Northwest Atlantic are distributed between Labrador and North Carolina and undergo extensive spring and autumn migrations. Although spawning occurs in two major areas, the New York Bight and the Gulf of St. Lawrence, the entire population has been treated as a single stock. Commercial catches have fluctuated widely since they were first recorded in 1804. Until the early 1960's, the fishery was conducted entirely by the US and Canada. Catches varied markedly due to apparent population fluctuations as well as to changes in market conditions, fishing methods, and areas fished, and reached a high of about 106,000 tons in 1884. US and Canadian commercial catches achieved a level of relative stability during 1925-49 when they averaged 35,200 tons per year (Anderson and Paciorkowski, 1980). Catches then declined, reaching a low of 6,100 tons in 1959.
Beginning in 1961, distant-water fleets commenced fishing for mackerel. An intensive international fishery, conducted mainly off the US coast during November-May on over-wintering concentrations, began in 1968 as catches jumped to 80,800 tons from 34,100 tons in 1967. Total stock biomass (ages 1 and older) increased from around 300,000 tons during 1962-65 to a peak of 1.8 million tons in 1970-71 due to a succession of four good year classes produced during 1966-69, including an outstanding 1967 year class. Commercial catches increased to a peak of nearly 430,000 tons in 1973. Following the period of intense fishing which lasted until 1977 (77,600 tons), when jurisdiction over fisheries was extended to 200 miles by the US and Canada, stock biomass declined to an estimated 323,000 tons in 1978 (Anderson, 1982) (Fig. 6). Catch regulations imposed by ICNAF were designed to prevent the stock biomass from decreasing below that in the early 1960's prior to the beginning of heavy fishing and this was achieved. Recruitment in recent years has been markedly below that observed from 1966 to 1974, with relatively poor year classes in 1975-77. Aided by relatively low commercial catches during 1978-82 (average of about 27,000 tons per year) and a slight improvement in recruitment, the stock increased almost 75% in weight from 1978 to about 560,000 tons at the beginning of 1983. Given the unusual nature of having four good year classes in the late 1960's (previous peaks were recorded in 1835-40 and 1880-84; Sette and Needler, 1934), it would be prudent not to base fishery expectations on the late 1960's and early 1970 experience.
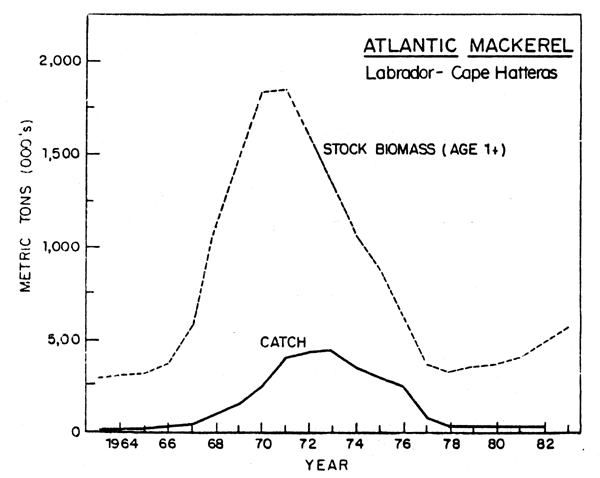
Fig. 6. Stock size and nominal catch of Atlantic mackerek from Labrador to Cape Hatteras.
Although the bulk of the international catch over time has been commercial, a recreational fishery for mackerel has existed for many years along the east coast from Maine to North Carolina. Recreational catches are not known precisely, although estimates have been made periodically since 1960 from national and regional angler surveys. Estimated recreational catches peaked at about 16,000 tons in 1970 and in the last several years have been 3,000-4,000 tons. By comparison the US commercial catch since 1953 has averaged only about 2,200 tons annually, mainly due to a very limited domestic market, whereas the Canadian catch since 1965 has averaged about 16,500 tons annually.
Silver Hake
Silver hake are widely distributed in the Northwest Atlantic between Newfoundland and South Carolina and inhabiting waters off the US coast have been considered to represent three separate stocks: the Gulf of Maine, Georges Bank, and Southern New England-Middle Atlantic (Anderson et al., 1980a). Catches from the Gulf of Maine taken by inshore US vessels averaged nearly 30,000 tons annually during 1955-64, but underwent a steady downward decline thereafter, with annual catches averaging 6,300 tons during 1971-82. The 1982 catch of about 2,100 tons was the lowest reported. Stock biomass (ages 1 and older) underwent a gradual decline from 220,000 tons in 1955 to only 20,000 tons in 1971 (Almeida and Anderson, 1981). Biomass has not recovered substantially from this low level, averaging only about 40,000 tons per year since 1970, but has exhibited a slight upward trend since 1977 (fig.7).
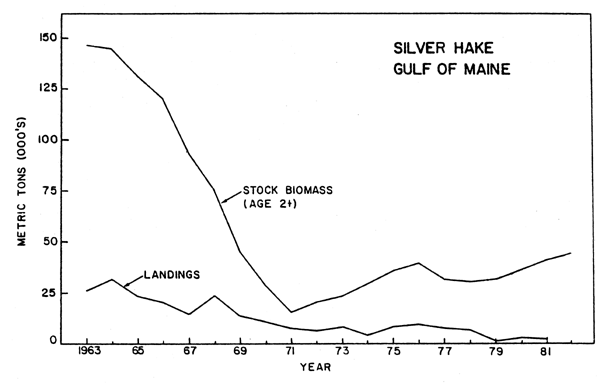
Fig. 7. Stock size and nominal catch of silver hake in the Gulf of Maine.
Catches from Georges Bank were fairly steady at an average of 19,000 tons per year during 1955-61 (totally US), but increased rapidly to a peak of nearly 240,000 tons in 1965 as the result of an intensive USSR fishery. Following a drop to only 18,400 tons in 1969, catches stabilized at an average of 68,000 tons during 1971-75, but again dropped due to decreasing stock size as well as restrictive regulations. Catches in 1979-81 were less than 2,000 tons annually. Stock biomass on Georges Bank increased from about 110,000 tons during 1955-57 to nearly 800,000 tons in 1963 and then dropped to about 170,000 tons in 1969-70 (Almeida and Anderson, 1981a). Following a brief increase to about 275,000 tons in 1973, stock biomass declined steadily to average about 25,000 tons during 1978-82 (Fig. 8).
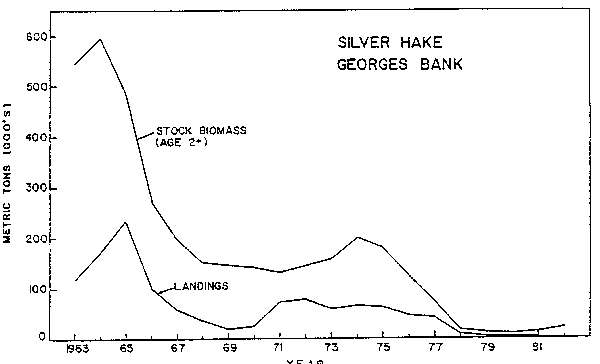
Fig. 8. Stock size and nominal catch of silver hake on Georges Bank.
Total catches (commercial and recreational) in Southern New England-Middle Atlantic averaged about 17,000 tons yearly during 1955-59 (all US), declined to about 10,000 tons in 1960, and increased steadily to around 137,000 tons in 1966. As on Georges Bank, the marked increase was due to an intensive USSR fishery which began in 1963. Estimated US recreational catches from marine angler surveys have averaged about 1,800 tons per year since 1960. Total international catches dropped to about 51,000 tons in 1967 and fluctuated between 19,000 and 67,000 tons until 1973, but then underwent a steady downward trend to 15,000-16,000 tons in 1980-81. Stock biomass (ages 1 and older) remained relatively steady at about 76,000 tons during 1955-59, improved to about 455,000 tons in 1965, and then dropped sharply to only 83,000 tons in 1970 (Almeida and Anderson, 1981a). After increasing briefly to 213,000 tons in 1973, stock biomass declined steadily to about 80,000 tons in 1982 (Fig. 9).
There were no strong year classes either during the period of relatively high stock biomass in the middle 1960's or during the period of low spawning stock existing since then. The Southern New England - Mid-Atlantic stock is producing modest size year classes at a spawning stock which is approximately 20 percent of the peak period. Georges Bank.stock, however, has produced very small year classes from spawning stocks now less than l/10th those of the early period. The Gulf of Maine stock which was reduced to similar low levels has also not rebuilt. Again the evidence is circumstantial with some indication there has been a decreased probability of good year classes when the spawning stock has reached extremely low levels as on Georges Bank and the Gulf of Maine. The Tatter stock, however, appears to have behaved somewhat differently than the offshore stocks as its reduction was not caused by high fishery removals to the same degree. The Gulf of Maine had a moderate level of fishing from the US inshore fleet for a long period of time. Landings were maintained at a fairly constant level through 1965 and then underwent a gradual decrease to a very minimal fishery at the present time.
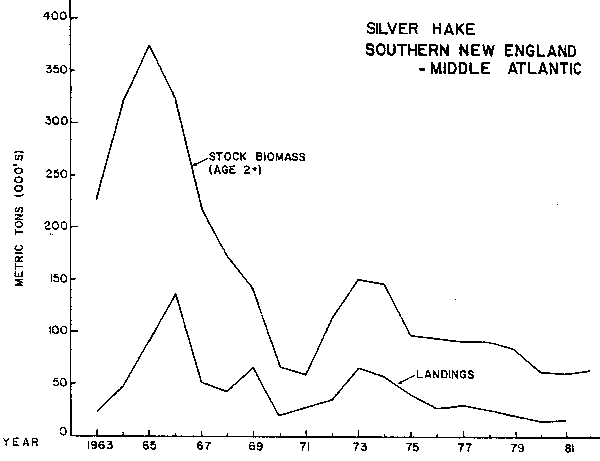
Fig. 9. Stock size and nominal catch of silver hake in the Southern New England - Middle Atlantic area.
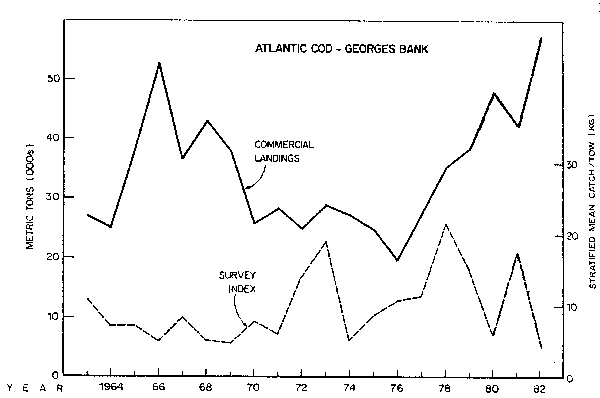
Fig. 10. Biomass index and nominal catch of Atlantic cod Georges Bank.
All three stocks were at high levels of spawning biomass in the early 1960's with the Gulf of Maine being at its highest in the 1950's (Almeida and Anderson, 1981a; Fig.8), Georges Bank in 1964 (Fig. 9), and Southern New England - Mid-Atlantic in 1965 (Fig.10). Recruitment patterns have been relatively similar in all three areas, with strong year classes in the early-mid 1960's, poor year classes in the late 1960's, an improvement in the early 1970's (not as strong as in the early 1960's), and rather poor year classes since. Fishing patterns differed in the Gulf of Maine from those in the offshore areas.
Other Major Fish Predators
Cod, dogfish (primarily spiny dogfish, Squalus acanthias), and bluefish (Pomatomus saltatrix) comprise the major biomasses of fish predators other than silver hake. Cod over this period was a relatively stable stock consisting of several year classes. Cod abundance did decrease somewhat in the late 1960's after heavy fishing but later recovered to peak abundance at the present time (Fig. 10). The larger cod are especially significant in the proportion of fish that they consume. After the initial period of heavy fishing by distant water fleets the average size cod decreased and there were fewer larger cod present. Cod also became more restricted in the extent of their winter southerly migrations. With the recovery of the cod stock the larger fish have become more abundant and the range is again extending further south in the winter. Strong year classes produced in the middle to late 1970's fueled this rebuilding (Serchuk et al., 1982a; Resource Assessment Division, 1982). The cod catch is presently above 60,000 tons and stock biomass is probably on the order of 150,000 tons.
Dogfish and bluefish increased in the early 1970's during a period when other stocks were at low ebb (Figs. 11, 12). High population levels continued throughout the late 1970's and early 1980's. There is no estimate of biomass of bluefish, however, estimated catches of bluefish reached highs of 50,000 tons in recent years (Resource Assessment Division, 1982). Minimum dogfish biomass has been estimated from areal expansion of annual trawl survey catches. Recent estimates are about 500,000 tons in 1980 (Resource Assessment Division, 1982). This is more than double the biomass of the early period.
Cod occur mainly in the Georges Bank and Gulf of Maine areas except for winter migrations to the south. Dogfish are a migratory species which move into the Mid-Atlantic in the winter and into the Gulf of Maine-Georges Bank areas in the summer, with some dogfish moving as far north as Newfoundland. Bluefish are a migratory species which move south of Cape Hatteras in the winter and north along the coast as far as the southwestern part of the Gulf of Maine, where an intensive summer recreational fishery takes place in inshore areas. However, bluefish also move out into Georges Bank in the summer.
Squid
There are two abundant squid species off the coast of the northeastern United States, and they are both commercially important. These are the long-finned or winter squid, Loligo pealei, and the short-finned or summer squid, Illex illecebrosus. Both species are active predators, feeding on fish and other squid at various times in their short life cycle of 1-2 years. Squid are also the prey of over 40 fish species and several marine mammals.
The long-finned squid ranges primarily between Cape Hatteras and southern Georges Bank and rarely occurs in the Gulf of Maine. This species moves inshore during the late spring and summer to spawning grounds, and in the late autumn and winter is concentrated off-shore from 200 to 400 meters.
The short-finned squid ranges from Florida north to Newfoundland. The species concentrates in the offshore areas in the southern portion of its range in the winter, and moves inshore (including the Gulf of Maine) and northward in the summer to feed. Spawning takes place in the offshore areas, although exact locations have not been found. Maturing individuals are seen in December (Lange and Sissenwine, in press).
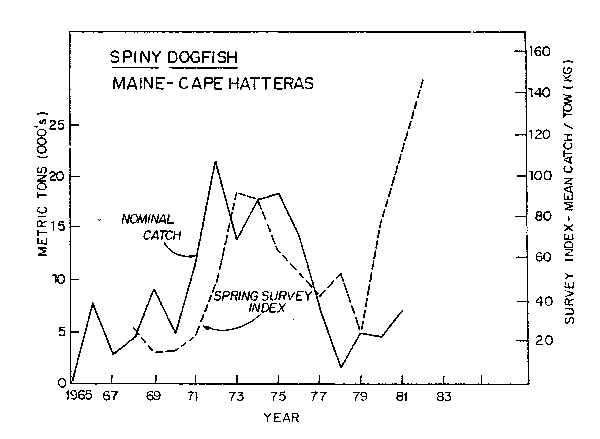
Fig. 11. Biomass index and nominal catch of spiny dogfish in ICNAF/NAFO Subareas 5 and 6.
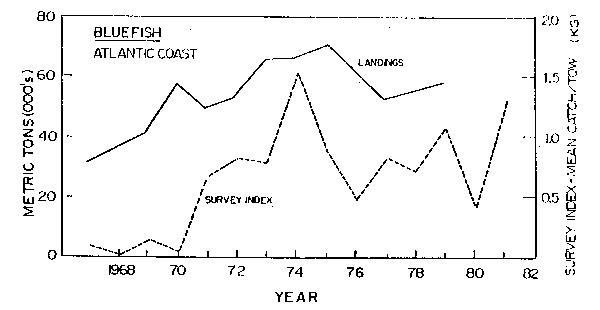
Fig. 12. Biomass index and nominal catch of bluefish along the Atlantic coast of the United States.
In the early 1960's there were apparently relatively few Loligo, although information on them is not very complete for the years before 1969. Beginning in 1969 and continuing into the early 1970's, there was a large increase in the abundance of Loligo. The commercial fishery developed beginning strongly in 1969, and reached peak catches of almost 38,000 tons in 1973. Since the extension of coastal state jurisdiction catches declined to a low point in 1978 of about 11,000 tons with reduced effort. However, catches have since risen to over 20,000 tons as the United States has expanded its fishery. Research survey indices, although fluctuating, have remained relatively high since 1968. Minimum biomass estimated from trawl surveys was estimated to be approximately 150,000 tons in autumn, 1982. (Lange, 1982; Fig. 13).
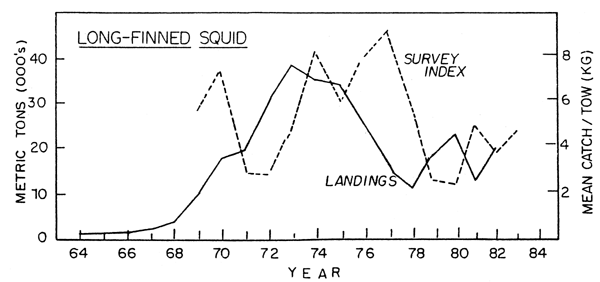
Fig. 13. Biomass index and nominal catch of long-finned squid in ICNAF/NAFO Subareas 5 and 6.
Illex squid are not monitored as well by the research surveys as Loligo because they are more pelagic and are partially located outside of the areas surveyed during the survey periods. Nevertheless, both survey indices and increased commercial catches indicated a very great increase in abundance soon after the Loligo population began its increases in the early 1970's (Fig.14).
Illex squid catches off Canada reached a high of 150,000 tons in 1979, but have dropped sharply since then. Abundance off the United States appears to remain high although the 1982 survey indices were the lowest since 1974. Given the variability of Illex catches it is not possible to draw a conclusion at this time as to whether or not a downward trend has started (Lange, 1982). The increase in the biomass of these two species of squids was a major factor in maintaining a greater stability in total biomass than for individual species, as squid filled some of the total biomass void vacated by Georges Bank herring, and to some extent, mackerel.
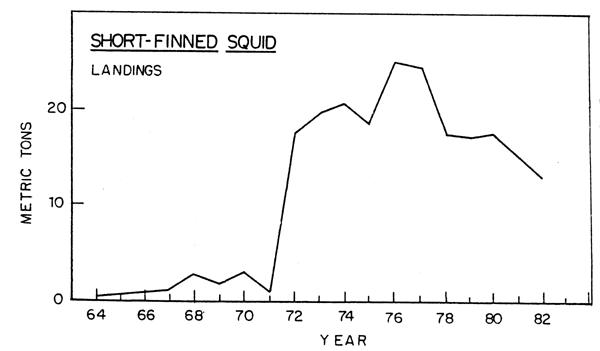
Fig. 14. Nominal catch of shor-finned squid in ICNAF/NAFO Subareas 5 and 6.
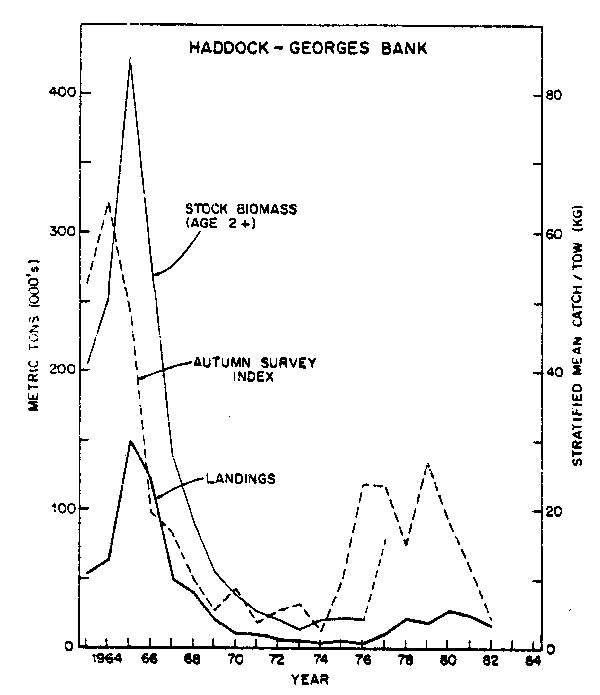
Fig. 15. Stock size and nominal catch of haddock on Georges Bank.
Other Resources
Haddock was initially a major component of the Georges Bank-Gulf of Maine fishery with a long-term sustainable annual harvest between 50,000 and 60,000 tons. It has a short spawning season in the late spring and its young form concentrated schools which are vulnerable to predator fish. The haddock population on Georges Bank exploded with an extremely large 1963 year class. Heavy fishing quickly reduced haddock to very low levels, which was followed by a long period of very poor production of year classes. Haddock increased slightly under extremely restrictive fishing regulations. In 1975 a fortuitous circumstance took place and a large year class was produced from a very low spawning stock. In the following two years, still with a small spawning stock, small year classes were produced. In 1978 the spawning stock had increased significantly with the maturing of the 1975 year class and another large year class was produced. Heavy fishing by US fishermen in the late 1970's and early 1980's drastically reduced the 1975 and 1978 year classes so that by 1982 haddock was decreasing again. Since the 1978-82 year classes appear poor, haddock appears to be headed toward very low levels of population size (Clark et al., 1982a, b; Fig. 15).
A large number of miscellaneous groundfish species (e.g., red hake (Urophycis chuss), ocean pout (Macrozoarces americanus), wolffish (Anarhichas lupus), white hake (Urophycis tenuis), pollock (Pollachius virens) have been significant components of the trawl fisheries. These stocks in general followed a pattern of high abundance in the early 1960's, decreasing abundance during the period of intense distant water fleet fishing and rebuilding in the late 1970's (Clark and Brown, 1977). Some species such as pollock (Clark et al., 1981a) have recovered much faster than others such as red hake (Almeida and Anderson, 1981b). Flounders are another important component of this ecosystem and consist of several species (e.g. winter flounder (Pseudopleuronectes americanus), yellowtail flounder (Limanda ferruginea), American plaice (Hippoglossoides platessoides), and witch flounder (Glyptocephalus cynoglossus)). These species in general followed the same pattern as the other groundfish, with yellowtail flounder, however, reaching its peak in the late 1960's and dropping drastically after experiencing heavy fishing and thus having a slower recovery than the other flounder stocks which were harvested to a lesser degree (McBride et al., 1980; Clark et al., 1981b).
Other pelagic species contribute significantly to the total biomass. Butterfish (Peprilus tricanthus) and scup (Stenotomus chrysops) are primarily Middle Atlantic-Southern New England species that have an inshore northerly summer migration and over-winter offshore in the Middle Atlantic. These species decreased during the period of heavy offshore fishing and have since increased somewhat (Waring and Anderson, 1981; Mayo, 1982).
In the spring, alewife (Alosa pseudoharengus) and blueback herring (Alosa aestivalis) return to the sea following spawning in rivers along the middle and southeast coast of the US; some travel north to Georges Bank and beyond. In addition, river herring from tributaries to the Gulf of Maine and southern New England also contribute to the offshore resources. These species decreased during the 1960's and 1970's with offshore harvest adding to the decline in production in the southern rivers. Populations in total are still below earlier levels but there has been some indication of rebuilding from increased catches offshore in trawl surveys (Resource Assessment Division, 1982).
Ammodytes sp.
During the period of reduced biomass of those species harvested commercially as described previously in this paper (1974-79), scientists at the Northeast Fisheries Center's Sandy Hook Laboratory found evidence of a significant change in the ichthyoplankton structure when they discovered a large-scale increase in larval sand lance abundance during winter Marine Resources Monitoring, Assessment and Prediction surveys (MARMAP). (See Sherman (1980) for a detailed description of the program.) Abundance estimates of Ammodytes sp. larvae increased 20-fold from 1974, when they accounted for less than 50% of the winter larval assemblage, to 1979, when they accounted for nearly 90% of the winter ichthyoplankton (Sherman et al., 1981). The increase in larval abundance and evidence of population increase from other studies (e.g. bottom trawl surveys, diver observations, and a significant increase in Ammodytes sp. in predator stomachs) indicate that adult populations increased sharply after 1976.
Ammodytes larvae were captured at over 61% of stations occupied during 18 MARMAP surveys conducted by the NEFC between the Gulf of Maine and Cape Hatteras during 1974-80. Back-calculated numbers at hatching ranged up to 77,000 per 10m2 with the highest densities occurring on Georges Bank and from Nantucket Shoals to Long Island (Sherman et al., 1981). Mean catch per tow was lowest in 1974 at 153.4 larvae per 10m2, and highest in 1977 at 6,544.4 larvae per 10m2. Spawning stock estimates based on egg survival between 1.0% and 0.05% increased 50-fold between 1974 and 1978 and then decreased in 1980 to approximately one-third of the 1978 level (Table 2; Morse, 1982). Incubation time for Ammodytes sp. eggs is unusually long, greater than 30 days (Laurence2), which suggests a potential for high egg mortality. If daily mortality is 5% for 30 days, then survival is only 22% to hatching; for 45 days survival is 10%. Assuming egg survival at the 0.10 level (e.g., similar to Atlantic herring egg mortality estimates) the estimated spawning stock biomass in 1980 was 917 thousand metric tons (Table 2).
| Std Error | Egg Survival | ||||||||||
|---|---|---|---|---|---|---|---|---|---|---|---|
| Year | Survey |  /Tow /Tow | of  | Z | 1.00 | 0.90 | 0.75 | 0.50 | 0.25 | 0.10 | 0.05 |
| 1974 | 1 | 153.4 | 43.136 | 0.221 | 5,489 | 6,099 | 7,318 | 10,978 | 21,956 | 54,890 | 109,780 |
| 1975 | 1 | 528.1 | 155.130 | 0.207 | 25,547 | 28,386 | 34,063 | 51,094 | 102,188 | 255,470 | 510,940 |
| 1976 | 1 | 4,541.6 | 1,254.084 | 0.308 | 207,717 | 230,797 | 276,956 | 415,434 | 830,868 | 2,077,170 | 4,154,340 |
| 1977 | 1 | 6,544.4 | 2,452.655 | 0.283 | 246,333 | 273,703 | 328,444 | 492,666 | 985,332 | 2,463,330 | 4,926,660 |
| 2 | 188.0 | 94.622 | |||||||||
| 1978 | 1 | 6,321.4 | 2,022.060 | 0.363 | 264,141 | 293,490 | 352,188 | 528,282 | 1,056,564 | 2,641,410 | 5,282,820 |
| 2 | 584.0 | 324.004 | |||||||||
| 1979 | 1 | 3,239.4 | 1,257.670 | 0.288 | 196,432 | 218,258 | 261,909 | 392,864 | 785,728 | 1,964,320 | 3,928,640 |
| 2 | 1,197.8 | 260.543 | |||||||||
| 1980 | 1 | 1,171.6 | 361.523 | 0.229 | 91,764 | 101,960 | 122,352 | 183,528 | 367,056 | 917,640 | 1,835,280 |
HYPOTHESIZED INTERACTIONS
Mackerel-Herring Interactions
One of the most intriguing aspects of the changes in fish population abundance and fisheries in the Northwest Atlantic during the past 25 years has been the shift of the major pelagic species from herring to mackerel. A simplistic circumstantial conclusion would be that mackerel replaced herring in the ecosystem. Since the passage of the good 1966-69 year classes through the stock, mackerel has returned to mid-1960's abundance levels. The herring stock on Georges Bank, however, has not recovered at all and is virtually nonexistent, although the herring stock has recovered in the Gulf of Maine and is still at modest abundance levels in the stocks off southwestern Nova Scotia.
2 Geoffrey C. Laurence, NEFC, Narragansett Laboratory, Narragansett, RI, personal communication.
Skud (1982) examined the historical herring-mackerel interaction from recorded catch statistics and earlier reports of catches dating back to the early 1800's and attempted to relate this to environmental factors. He noted that during much of the 1800's mackerel were more abundant than herring. Following a collapse of the mackerel fishery in the late 1880's herring became more abundant, declined in the 1930's, and greatly increased in abundance during the 1940's and 1950's. He noted that herring abundance was positively correlated with temperature when herring were more abundant than mackerel, but negatively when mackerel was more abundant or when the population was shifting. Likewise mackerel was negatively correlated with temperature when herring was abundant and positively when mackerel dominated. This evidence, however, still remains circumstantial because there is no specific biological rationale to indicate the cause of this interrelationship. Furthermore, mackerel did increase in the 1930's due to entry of good year classes when herring abundance apparently declined. Mackerel abundance might have exceeded herring during that brief period of time even though catches were lower. Mackerel collapsed in the 1940's and herring, as noted in the Gulf of Maine juvenile fisheries, increased greatly in abundance at that time. It should be noted that the herring catches over this period of time did not include the Georges Bank and Nova Scotia adult populations for which little information was available and thus primarily reflect populations in the inshore Gulf of Maine areas. In the late 1960's when the Georges Bank stock was at its maximum the mackerel stock was increasing and the very good 1967 year class was produced. It should also be noted that in the late 1880's a period of extremely successful mackerel year classes caused a large increase in the mackerel fishery just prior to its collapse in the late 1880's. Despite the mystery that still surrounds the relative abundances and possible interactions of these two species, historical observations for over 100 years should lead fishery managers and scientists not to expect to see a co-occurrence of very high mackerel and herring biomasses.
It is difficult in recent times to separate the effects of natural factors on fish stocks from the effect of humans. However, one wonders what might have been the situation with regard to relative biomasses of herring and mackerel if the 1970 year class of herring on Georges Bank had been allowed to contribute to the population for a significant period of years. Year classes of even modest size coming from that spawning stock might well have resulted in herring and mackerel stocks relatively co-equal in size at the present time.
Ammodytes -- Herring -- Mackerel Interactions
The dramatic 50-fold increase in the Ammodytes spawning stock biomass, following the precipitous decline in herring and mackerel stocks, indicates a significant change in the species composition of the pelagic finfish community. Clark and Brown (1977) estimated a 6-7 million ton decline in pelagic (primarily mackerel and herring) stocks from 1967 to 1975 in Subareas 5 and 6. Grosslein et al. (1980), estimated that average biomass on Georges Bank declined 42% and production of finfish and squid (Kcal/Km2) declined by 26% from 1964 to 1975. Assuming the basic productivity of the shelf has not changed during the past 70 years based on studies by Sherman et al. (in press), then a surplus of food energy was available during the mid-1970's. Ammodytes biomass increased 30-fold from 1974 to 1976 indicating a shift in energy flow within the pelagic component of the ecosystem. Ammodytes abundance increased after the herring and mackerel stocks had reached extremely low levels which suggests replacement (Daan, 1980) as a causal mechanism rather than competition or predation (Fig. 16).
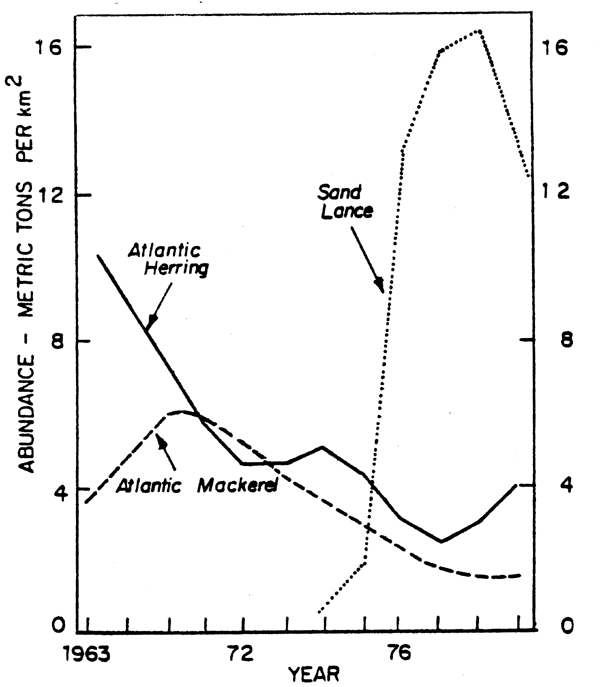
Fig. 16. Decline in herring and mackerel biomass in ICNAF/NAFO Subareas 5 and 6 and the successive increase in sand lance.
Pelagic/Demersal Interactions
The most striking observation in examining the history of catches from the mid-1950's through 1980 in this region is that the catches of both pelagic and demersal species were modest with demersal species being somewhat higher. This was followed first by a large buildup and subsequent decline in catch of the demersal species, followed by a similar rise and fall in catches of the pelagic species (Fig. 17).
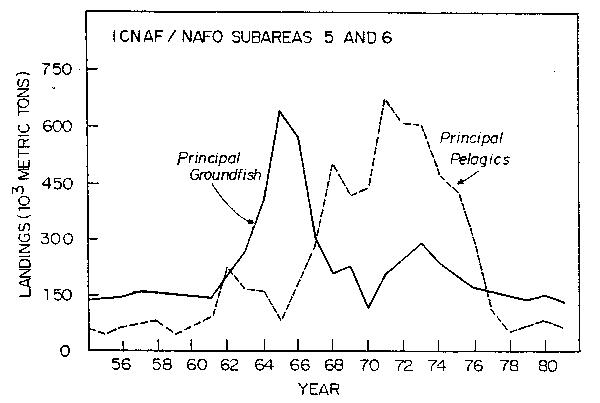
Fig. 17. Nominal catch of principal groundfish and principal pelagics in ICNAF/NAFO Subareas 5 and 6.
pelagics in ICNAF/NAFO Subareas 5 and 6.
The figures here apply to the "principle" pelagic and groundfish as defined by ICNAF/NAFO, which means that the pelagics are primarily herring and mackerel; and the groundfish are primarily cod, haddock, silver hake, red hake, pollock, and redfish (Sebastes marinus). It should be noted, however, that miscellaneous other demersal species catches did build up in the latter part of the 1960's only to show a similar decline in the 1970's as discussed in the section on trends of total biomass. This substitution in the catches obviously kept the total up and it might appear as if pelagics replaced demersals in the ecosystem under the effects of heavy fishing pressure.
When this is examined a bit more closely one sees that these trends are driven by a relatively small number of extremely good year classes of haddock, silver hake, herring, and mackerel. If these four species were removed the picture would change drastically and and the peaks not exist.
While the pattern of rising and falling catches is certainly intriguing and suggests pelagic/demersal replacement, it is difficult to suggest biological hypotheses to support this when it can be seen that it was the result of herring year classes in 1960 and 1961, haddock in 1963, mackerel in 1966-69, and silver hake also in the early 1960's. These year classes were basically established either before or in the period between 6 months and one year of life based on the fact that indices at these times in the surveys (and in the case of herring in the fisheries) correlate strongly with estimated total year class strength.
In the Northeast Atlantic, specifically the North Sea, a different pattern emerged in which the pelagic species (mainly herring) declined first, to be replaced by increased productivity of demersals particularly Norway pout (Trisopterus esmarki). Jones and Richards (1976) indicated that the energy in the system released following the removal of the pelagic species could have provided the basis for the increase in demersals. The hypothesis that the North Sea might be a food limited area requiring the release of energy previously used by herring to allow a buildup in demersal species, is based on the energy budgets of Steele (1974) and Crisp (1975).
Grosslein et al. (1980) and Cohen et al. (1982) have estimated energy budgets for the Georges Bank area and concluded that this area is not food limited and, in fact, during the period they examined (the early 1960's to the mid-1970's) both demersal and pelagic species declined.
A review of fishing mortality rates estimated at various meetings of committees within the International Commission for the Exploration of the Sea (ICES) and at scientific committee meetings of International Northwest Atlantic Fisheries Commission (ICNAF) indicates that fishing mortality rates have been higher for principle groundfish species in the North Sea area than in the Northwest Atlantic. This decline of both groups cannot, therefore, be explained purely by a higher rate of removals in the Northwest Atlantic.
The picture which emerges is certainly not clear. Nevertheless, there does not appear to be any direct evidence or even strong circumstantial evidence for replacement between pelagic and demersal species in the southern area of the Northwest Atlantic.
Stability of Total Biomass
Feeding habits of fish in this region indicate a potential for biological interactions (Fig. 18) based on both competition and predation. Brown et al. (1976) treated biological interactions implicitly by applying a surplus production model (Schaefer, 1954) to the aggregate catch of all finfish and squid (except menhaden, which are captured close to shore, and large pelagic species). Fishing effort by different gear types and nations was calibrated and combined to provide a standardized index of days fished. A learning function was applied to adjust fishing effort in newly developing fisheries. A sixfold increase in standardized fishing effort combined with a 55% decline in abundance in the period of 1961 to 1972 was demonstrated. This resulted in an estimate of maximum sustainable yield (MSY) in this region of about 900,000 tons, much less than the sum of the individual MSY's for species and species groups estimated at that time to be 1,352,000 tons. Brown et al (1976) inferred that this difference in part reflected biological interactions and in part reflected difficulties in the methodology both in the estimate of the Schaefer yield curve and in the species estimates of MSY.
Sissenwine et al. (1982) modified the surplus production approach to include explicit consideration of biological interactions. They utilized 29 different species and tested all possible combinations for interaction. Of the 724 combinations examined, only 26 partial correlation coefficients were significant at the 5% level. Since less than 5% were significant, it must be concluded that the significant partial correlation coefficients were due to type 1 errors, that is chance alone. Sissenwine et al. (1982) also considered a time lag for those species which are fish predators. One hundred and ninety-nine combinations were fit with the results essentially being the same, about 5% significant at the 5% level. This empirical examination failed to demonstrate biological interactions. This result, however, does not necessarily imply that the biological interactions are unimportant, but only that an empirical approach is inadequate even when the data are as detailed as they are in this area, a combination of available data unlikely matched elsewhere for the same length of time. The most likely reason for the failure of this approach is the variability in recruitment and thus these empirical fits are not satisfactory for the same reasons that models of the stock and recruitment relationship fail to closely fit the observed data.
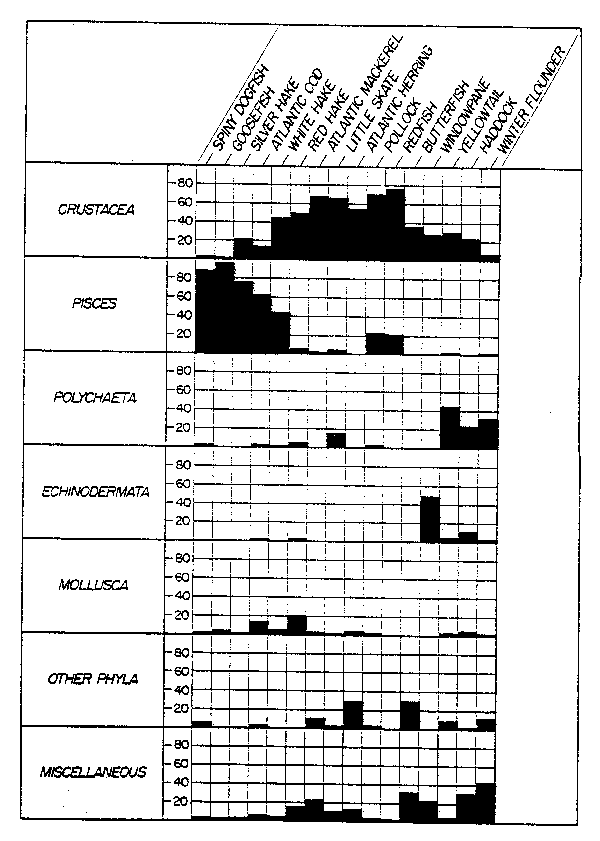
Fig. 18. Diagrammatic representation of the prey of sixteen species of fish collected on Georges Bank during 1969-72. Data are expressed as percentage weight (Grosslein et al., 1980).