


Fig. 4. Monthly recruitment to the northern stock of Peruvian anchoveta, 1961 to 1978. Overall, this time-series matches closely the sequence of events given by previous authors, particularly Cushing (1981).
Fig. 5. Monthly estimates of adult biomass (defined as fish>11 cm, see text). Overall, this series matches most of the estimates in previous works, notably IMARPE, 1970, 1972, 1973 and 1974 and Cushing, 1981. Differences may be explained by large differences in approaches used. The enormous increase in 1973–1974 may be an artifact due to the use of unrealistic values of M (see text).
Fig. 6. Time series of loge (RiSi-l). This index would be a direct expression of egg and larval survival if adult fish spawned every month an amount of eggs proportional to their biomass. As used here, it expresses both “non-spawning” and survival of pre-recruits. Nevertheless, a close association between this index and El Niño events will be noted.


Fig. 7. Monthly catch of anchoveta, northern stock, 1961 to 1979. Zero catches represent periods of closure, not of Zero availability of fish.
Fig. 8. Time series of total anchoveta biomass (adults and juveniles, but excluding fish < 4 cm), northern stock. Major sequence of events as expressed here match earlier accounts, except for enormous increases in 1973–1974 which may be an artifact due to the use of unrealistic values of M (see text).
Fig. 9. Estimated values of fishing mortality (F) obtained by dividing catches in Fig. 7 by biomasses in Fig. 8. Obviously, errors in the biomass estimates will be reflected in the values of F which, therefore, should be considered as tentative.
DISCUSSION
The following parameter values are now available on the growth of Engraulis ringens:
| L (cm) | K (per year) | Source |
|---|---|---|
| 15 | 1.7 | Saetersdal and Valdivia (1964) |
| 16.8 | 1.4 | Chirinos de Vildoso and Chumán (MS) |
| 18.5 | 1.1 | Tsukayama and Zuzunaga (MS) |
| 19.0 | 1.11 | Simpson and Buzeta (1967) |
| 20.65 | 1.26 | this study (Table 1) |
Of the parameter values obtained previously, those of Tsukayama and Zuzunaga (MS) and those of Simpson and Buzeta (1967) appear most reasonable, especially in view of the fact that old E. ringens may reach a length of 17–18 cm. We believe the discrepancy between our estimates and the two earlier sets is due to our having considered seasonal growth oscillations; thus what here appears as the acceleration (due to a summer spurt) of an otherwise steady growth presumably has been interpreted as a rapid growth toward a smaller maximum size.
In any case, our results are similar to those of other authors in that they imply that anchoveta, once recruited, may stay about two years in the fishery, notwithstanding the return of a fish tagged up to 5 years previously (Cushing 1981).
The most interesting part of the growth study presented here is, we believe, the demonstration and quantification of growth oscillations which so closely fit the general pattern derived from the study of a number of other fish species (Fig. 3).
This is encouraging because it implies that the anchoveta is not such a special fish after all, and that parameter values(e. g. , for use in simulation modelling) detained from stocks similar to the Peruvian anchoveta may be used.
The application of VPA II does not seem to be useful in the case of a short-lived fish such as the anchoveta, where the stock size may fluctuate violently within periods of a few months. Inherent to the VPA II method is, it is recalled, the need to group data over a period of time when conditions are somewhat constant, which was hardly ever the case off Peru. Based on the present experience, it seems now that it would be most appropriate to limit the application of this method to stocks of long-lived animals in which recruitment fluctuations cause only ripples in the size of the accumulated stock.
VPA III, on the other hand, seems eminently suited to study the dynamics of anchoveta as reasonable estimates of recruitment, biomass, fishing mortality and other quantities could be derived with an extremely limited amount of data beyond the catch data themselves. However, the number presented here could all be rendered more accurate by considering the following:
(1) the assumption of constant mortality (M=1.2) used here certainly does not apply, and subsequent applications of VPA III to the anchoveta stock should take this into account, e. g., by expressing natural mortality as a function of the biomass of their major predators (guano birds, certain fishes). This should help bring the standing stock estimates for 1973–1974 (Figs. 5 and 8) down to more realistic values, among other things;
(2) the terminal fishing mortalities used to initiate the VPA 's should not be constant either, but rather should reflect the increase in F noted, e.g, in this study;
(3) the conversion of fish numbers to biomass should take into account the changes in condition factor reported for the anchoveta;
(4) the catch data from the “northern stock” should be pooled with at least those from the “central stock” to account for the large exchanges known to occur between these stocks;
(5) the time series should be if possible extended back in time to obtain more data reflective of a situation when between-month variability in stock size was reduced, and forward in time to include more data from that period when the anchoveta was supplanted by other pelagics.
Given these adjustments and improvements, we believe that the method presented here could lead to significant insights into the mechanisms which determine anchoveta recruitment. The large number of stock and recruitment values obtained will allow the testing of a large number of variables (biotic and abiotic) for their effect on loge (R/S), as suggested by IMARPE (1973) and performed (with only 2 variables) by Csirke (1980). However, as noted by Bakun et al. (1982) “there is always an extremely limited number of data points available (one per year). Thus, the number of explanatory variables must be reduced to a minimum”.
The VPA III approach presented here overcomes this constraint, as 12 values of stock size and recruitment are generated per year. Thus, we have here 203 data points enough to test a large number of variables for their effect on loge (R/S) (including dummy variable (s) for the “spawning season” itself).
We believe that it is the last mentioned aspect of the methodology proposed here which has the greatest potential, because having a large number of relatively independent data points offers the real possibility of identifying and quantifying factors with crucial impact on recruitment. Such factors, once identified, will certainly allow better yield predictions to be made.
ACKNOWLEDGEMENTS
We wish to thank all IMARPE staff, present and past for their contribution to the data used here especially Mrs. Maria Alvarez, Mr. J. Pelló Noel David at ICLARM for faithfully adapting ELEFAN III to our everchanging needs. Also, we wish to thank Dr. W. Arntz (Project Peruano-Alemón Pesquera, Callao) for inviting one of us (DP) to Peru, and J.A. Gulland (FAO, Rome) for reading and suggesting improvements to a draft of this paper. Last, but certainly not least, we wish to thank Miss Lourdes “Deng” Palomares (ICLARM) for actually running all these data through the ELEFAN programs.
REFERENCES
Bakun, A., J. Beyer, D. Pauly, J.G. Pope and G.D. Sharp. 1982. Ocean sciences in relation to living resources. Can.J.Fish.Aquat.Sci. 39(7):1059–1070.
Boerema, L.K., G. Saetersdal, I. Tsukayama, J. Valdivia, and B. Alegre. 1967. Informe sobre los efectos de la pesca en el recurso peruano de anchoveta. Bol.Inst.Mar.Perú. 1(4):133–186.
Chirinos de Vildoso, A. and E. Chumán. Un estudio del crecimiento de la anchoveta (Engraulis ringens, J.) Basado en la lectura de otolitos. (MS).
Csirke, J. 1980. Recruitment in the Peruvian anchovy and its dependence on the adult population. Rapp.P.-v.Réun.Cons.Int.Explor.Mer. 177:307–313.
Cushing, D.H. 1981. The effect of El Niño on the Peruvian anchoveta stock. In Coastal upwelling (F.A. Richards, ed.). Coastal and Estuarine Sciences 1. American Geophysical Union, Washington, D.C.
Gaschütz, G., D. Pauly and N. David. 1980. A versatile BASIC program for fitting weight and seasonally oscillating length growth data. I.C.E.S. C.M. 1980/D:6 Statistics Committee. 14 p.
Glantz, M.H. and J.D. Thompson (eds). 1980. Resources management and environmental uncertainty: lessons from coastal upwelling fisheries. Wiley Interscience, New York.
Gulland, J.A. 1968. Informe sobre la dinamica de la población de anchoveta peruana. Bol.Inst.Mar Perú. 1(6):305–346.
IMARPE. 1970. Report of the panel of experts on population dynamics of Peruvian anchoveta. Bol.Inst.Mar Perú. 2(6):324–372.
IMARPE.. 1972. Report of the second session of the panel of experts on the population dynamics of Peruvian anchovy. Bol.Int.Mar Perú. 2(7):373–458.
IMARPE.. 1973. Report of the third session of the panel of experts on the population dynamics of Peruvian anchovy. Bol.Inst.Mar Perú. 2(9):525–599.
IMARPE.. 1974. Report of the fourth session of the panel of experts on stock assessment of Peruvian anchoveta. Bol.Inst.Mar Perú. 2(10):605–719.
IMARPE.. 1976. La situación de la población de anchoveta y su pesquería hasta mediados de abril de 1976. Informe al Despacho Ministerial.
IMARPE.. 1977a. El recurso anchoveta, el medio ambiente, la regulación de su pesquería desde 1960 a 1977 y sus perspectivas. Informe al Despacho Ministerial.
IMARPE.. 1977b. Situación de los stocks de anchoveta y otros recursos pelágicos durante el segundo semestre de 1977. Informe al Despacho Ministerial.
IMARPE.. 1980. Informe de evaluación de los recursos pesqueros anchoveta, sardina, jurel y caballa a julio 1980. Inf.Inst.Mar Perú. No. 78.
IMARPE.. 1981. Informe de seguimiento de las pesquerias de recursos pelágicos de enero a julio 1981. Addenda: Pescas agosto-setiembre 1981. Informe al Despacho Ministerial.
IMARPE.. 1982. Informe de seguimiento de las pesquerías de recursos pelágicos durante el periodo enero-setiembre 1982. Informe al Despacho Ministerial.
Jones, R. 1979. An analysis of Nephrops stocks using length composition data. Rapp.P.v.Réun.Cons. Int.Explor.Mer. 175:259–269.
Jones, R.. 1981. The use of length composition data in fish stock assessment (with notes on VPA and cohort analysis). FAO Fish.Circ. (734):55 p.
Murphy, G.I. 1972. Fisheries in upwelling regions, with special reference to Peruvian waters. Geoforum. 11:63–71.
Pauly, D. 1982. Studying single-species dynamics in a multispecies context. In Theory and management of tropical fisheries (D. Pauly and G.I. Murphy, eds). ICLARM Conference Proceedings 9. International Center for Living Aqautic Resources Management, Manila.
Pauly, D.(In press). Fish population dynamics in tropical waters: a manual for use with programmable calculators. ICLARM Studies and Reviews.
Pauly, D. and N. David. 1981. ELEFAN I, a BASIC program for the objective extraction of growth parameters from length-frequency data. Meeresforschung. 28(4):205–211.
Pauly, D. and G. Gaschütz. 1979. A simple method for fitting oscillating length growth data, with a program for pocket calculator. I.C.E.S. C.M. 1979/G:24 Demersal Fisheries Committee. 26 p.
Pauly, D. and J. Ingles. 1981. Aspects of the growth and natural mortality of exploited coral reef fishes. In The reef and man. Proceedings of the fourth international coral reef symposium (E.D. Gomez, C.E. Birkeland, R.W. Buddemeier, R.E. Johannes, J.A. Marsh, Jr. and R.T. Tsuda, eds). Vol.1. Marine Sciences Center, University of the Philippines, Diliman, Quezon City.
Pauly, D., N. David and J. Ingles. 1980. ELEFAN 1: user's instruction and program listings. International Center for Living Aquatic Resources Management, Manila. (Mimeo) pag.var.
Pope, J.G. 1972. An investigation of the accuracy of virtual population analysis using cohort analysis. Int.Comm.Northwest Atl.Fish.Res.Bull. 9:65–74.
Pope, J.G., D. Pauly and N. David. ELEFAN III, a BASIC program for the detailed analysis of catch- at-length data using Virtual Population Analysis. International Center for Living Aquatic Resources Management, Manila. (MS).
Ricker, W.E. 1975. Computation and interpretation of biological statistics of fish populations. Bull.Fish.Res.Board Can. 191:382 p.
Saetersdal, G. and J.E. Valdivia. 1964. Un estudio del crecimiento, tamaño y reclutamiento de la anchoveta (Engraulis ringens, J.). Bol.Inst.Invest.Rec.Mar. 1(4):85–136.
Schaefer, M.B. 1967. Dynamics of the fishery for the anchoveta Engraulis ringens off Peru. Bol.Inst.Mar Perú. 1(5).
Simpson, J.G. and R. Buzeta. 1967. El crecimiento y la edad de la anchoveta (Engraulis ringens, Jenyns) en Chile, basado en estudios de frequencia de longitud. Inst.Fom.Pesq.Bol.Cient. 3:53 p.
Tsukayama, I. and M.A. Alvarez. 1981. Fluctuaciones en el stock de anchovetas desovantes durante los ciclos reproductivos de primavera 1964–1978. pp. 233–240. In Workshop on the effects of environmental variation on the survival of larval pelagic fishes (G.D. Sharp, ed.). IOC Workshop Report No.28. IOC/UNESCO, Paris.
Tsukayama, I. and J. Zuzunaga. Crecimiento de anchoveta en base a distribución por tamaños. (MS).
Zuta, S. and W. Urquizo. 1972. Temperatura promedio de la superficie del mar frente a la costa Peruana periodo 1928–1969. Bol.Inst.Mar Perú. 2(8):459–520
(Summary only)
by
Pierre Fréon
ORSTOM 24
rue Bayard 75008
Paris, France
SUMMARY
In pelagic fish populations, individuals of similar size assemble in schools, which can be defined as a physical grouping of gregarious fish “mutually attracted to each other” (Shaw, 1980). The fishery biologist is more interested, in the dynamics of population studies, by the concept of cohort defined as a set of animals from the same species and issue from a same spawning period, but this concept seems to be ignored by the fish.
Except for size, a cohort or a school is mainly characterised by the mean length of individuals and by the spread around this mean. The relations between these two parameters have been studied in cohorts and schools of tropical small pelagic fish, in order to improve the knowledge of fish aggregation mechanisms and their consequences on fisheries biology.
From a theoretical point of view, if each individual is assumed to grow according to the Von Bertalanffy's equation with fixed parameters but these parameters differ among individuals, it is then to be expected that variability in length at a given age is mainly due to three factors; first: differences in birth dates (toi), second: differences between growth rates (ki), and third: differences between maximal length (L∞ i) for adults (Fig. 1).
Data from sardine-like fish (mainly Sardinella aurita) in the Central-East Atlantic and from menhaden (Brevoortia tyrannus) in the Central-West Atlantic have been studied. This analysis, applied to cohorts, shows an early decrease in the standard deviation of length when plotted against mean length, which suggests a stronger influence of variation in toi and ki comparatively to L∞ i (Fig. 2). As applied to schools, the standard deviation of length increases constantly with mean length, providing a constant coefficient of variation. For schools of mixed species, the results are the same, suggesting that regroupment is more related to length similarities than to species groups (Fig. 3).
Comparison between figures obtained from cohorts and schools belonging to the same species shows an inadequacy of length spread between these two structures (Fig. 2). In consequence the scheme of small pelagic aggregations can be summarized in the following three stages:
- during the first stage, not observed under natural conditions, it is possible for fish issued from a same cohort and born within few days interval to remain grouped in the same school or in schools with similar length frequency distributions;
- however, the data strongly suggest that a cohort rapidly disperses into schools of narrower length spread, due to the high degree of variability in the cohort, especially for tropical species which present a spawning period spread over a long time and have high growth rates;
- during the third stage, the cohort length variability decreases to such a degree that it is possible to encounter fish from different cohorts in the same school.
In general a school cannot be considered as representative of the cohort length frequency distribution (Fig. 4).
In pelagic fisheries, the school corresponds generally to the catch unit target and the concept of cohort does not have anymore meaning for fishermen than for fish. It is then the fisheries biologist who must estimate the numerical importance of cohorts through complex sampling methods. The usual stratified sampling methods are recommended, but it is often difficult to define homogeneous strata due to species migrations not related to fishing grounds.
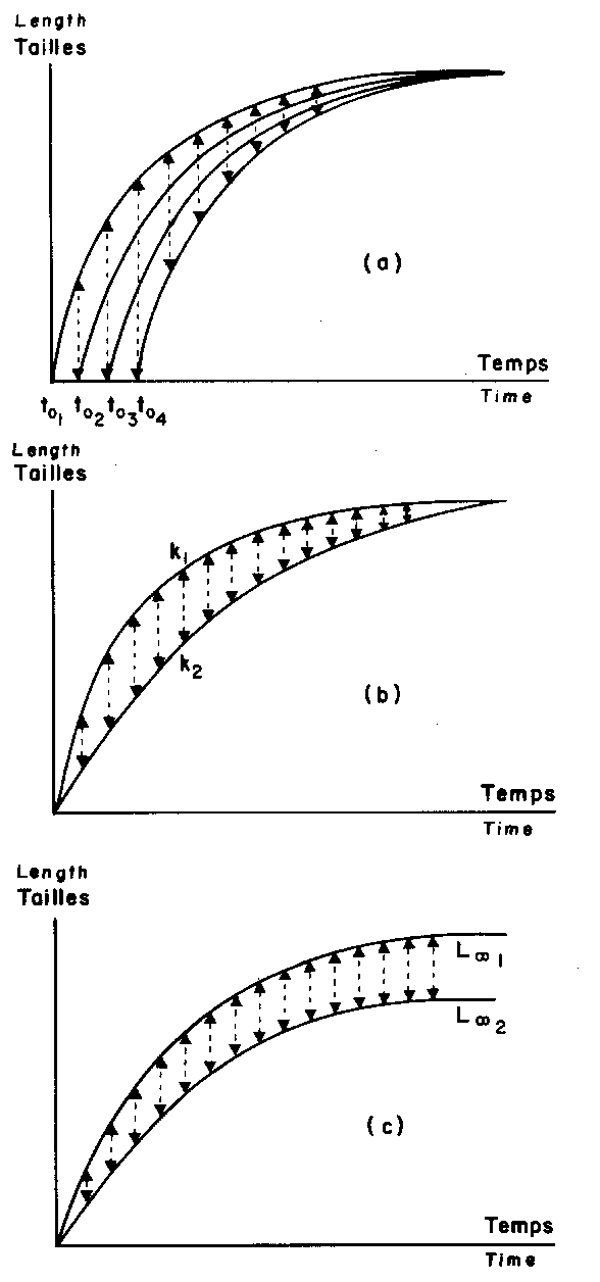
Fig. 1. Theoretical sources of variablility inside a cohort which individuals would present different parameters of Von Bertalanffy's equation.
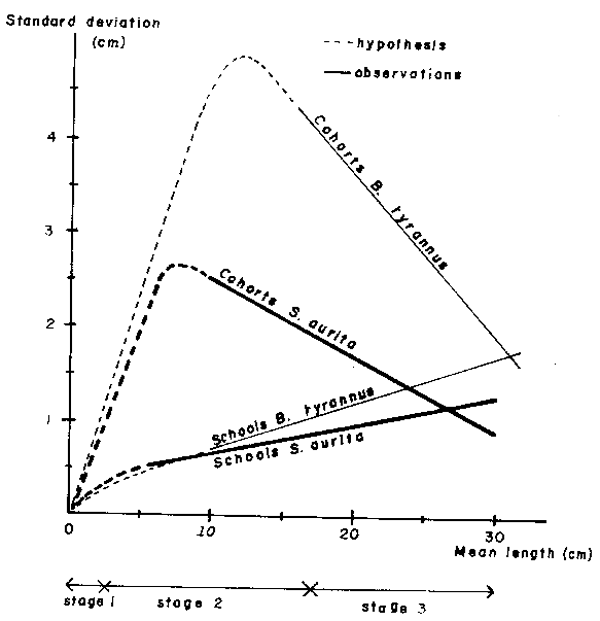
Fig. 2. Combined scheme showing apparent relations between mean length of individuals and standard deviation of length inside cohorts and schools of Sardinella aurita and Brevoortia tyrannus.
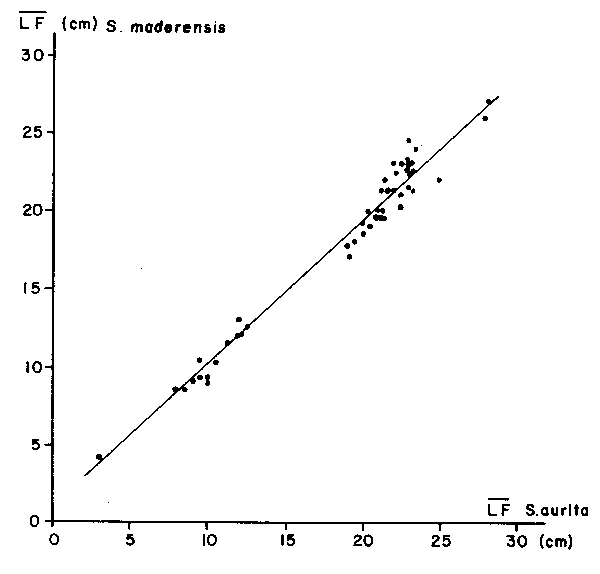
Fig. 3. Relationship between individual mean length (LF) of Sardinella aurita maderensis when encountered in the same school.
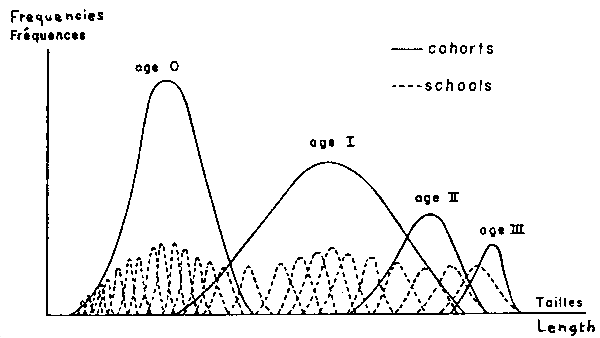
Fig. 4. Scheme of length frequency distributions inside cohorts and schools (to improve scheme understanding, frequency scale is greater for schools than for cohorts).
Fish concentrations where several schools with similar length and age distributions flock together, theoretically constitute ideal strata. However they are often difficult to identify, except in some cases as the sardine fishery in Senegal. Furthermore, homogeneity of concentration is probably not a universal rule valid for all small pelagic species. This homogeneity is needed at the highest level if the double sampling method on length and age is used, because it supposes a similar age distribution inside length classes for different schools within the same concentration.
Contrary to bottom trawls, most of small pelagic fishing gears are not length selective inside the exploited fraction of the population, and under these circumstances the fisheries biologist is indeed happy. Unfortunately, the aggregation mode in coastal pelagic species is such that a school catch, realized with a purse seine for example, can be considered as a catch realized by a very selective trawl-net (mesh-size selectivity and avoidance) on a randomly distributed population, using as many trawl types as there are school types. For this reason, as for demersal species, one must be careful in the choice of sampling methods used to determine age-length keys or growth parameters through hard body part studies. Furthermore, when Petersen's method or derivations are used for indirect growth rate estimations, the hazard is to assign an age class to a modal length class corresponding to nothing more than a school or a concentration which has been over- sampled. Using this method will be much more dangerous if applied to no-regrouped samples, which is commonly done for studying young fish growth. Modal progression with respect to time obtained by such methods can be non-related with growth.
Because of high individual growth rate in tropical coastal pelagic fish, the usual computation of Von Bertalanffy's growth equation parameters for the whole population introduces an under estimate of K, especially if data on growth increment are considered, and not age composition.
In some cases, the biomass percentage of a specific species when encountered mixed with other species in schools is more than 60%. It is then impossible to think in any form of mono-specific model of exploitation.
All these sources of bias on biological parameters and population structure can invalidate conclusions reached with any kind of production model used for stock management and assessment.
by
H. Santander1
J. Alheit2
A.D. MacCall3
A. Alamo1
1 Instituto del Mar del Peru, Apartado 22, Callao-Peru
2Programa Cooperative Peruano-Alemán de Investigación
Pesquera (PROCOPA), IMARPE, Apartado 22, Callao-Peru
3 Southwest Fisheries Center, P.O. Box 271, La Jolla-
CA. 92038, U.S.A.
* Publication No. 8 of PROCOPA
Resumen
En Agosto-Septiembre 1981, se colectaron 925 muestras de ichthyoplancton, y estómagos de l 500 anchovetas (Engaulis ringens) y 578 sardinas (Sardinops sagax sagax); estas muestras fueron colectadas de una extensión de 600 millas a lo largo de la costa peruana entre los 6°S y 14°S. Los análisis de las mues- tras de plancton revelaron que los huevos de anchoveta estaban concentrados en una franga relativamente angosta, de alrededor de 9 millas de ancho, pararela a la costa y a una distancia de 8 a 17 millas de ésta. Los huevos no parecen ser transportados muy lejos de las áreas de desove. La tasa diaria de mortali- dad de los huevos de anchoveta es extremadamente alta: 60% (z = 0.91). Las anchovetas consumen más huevos en las áreas donde la densidad de huevos es alta y se alimentan menos de estos cuando la densidad de huevos es baja. El 61.1% de los estómagos de anchoveta y el 62.4% de los estómagos de sardina contenían huevos de anchoveta. El número promedio de huevos de anchoveta en los estómagos de anchoveta fue de 5.5, y en los estómagos de sardina fue de 16.4. Los huevos de edades diferentes parecen ser digeridos a ritmos diferentes. La predación de sardinas sobre huevos de ancnhoveta puede ser particularmente peligrosa ahora que el stock peruano de anchoveta ha alcanzado el nivel más bajo que jamás se haya registrado. Una comparación entre la anchoveta peruana y la anchoveta del norte frente a California (E. mordax) muestra que la contribución del canibalis- mo de huevos a la mortalidad total de los huevos es mayor en la anchoveta del norte.
INTRODUCTION
Predation on eggs either by cannibalism or by other species might regulate the size of fish stocks. Recently, egg cannibalism in the northern anchovy, Engraulis mordax, was the subject of a detailed investigation (Hunter and Kimbrell, 1980; MacCall, 1980). It was concluded that cannibalism on eggs and larvae is sufficiently intense to be a regulatory mechanism.
Egg cannibalism in the Peruvian anchovy, E. ringens, has been recorded several times (Rojas de Mendiola and Ochoa, 1973; Rojas de Mendiola, 1980). However, sample sizes were too small to draw firm conclusions. Furthermore, important parameters, e.g., egg mortality, batch fecundity, spawning rate, etc., were not known and, consequently, the impact of egg cannibalism could not be estimated.
In 1981, the Instituto del Mar del Perú, carried out a cruise to estimate the spawning biomass of the central and northern anchovy stock. The samples and data obtained from this cruise gave the opportunity to estimate the extent of egg cannibalism in the Peruvian anchovy and to determine the effect of predation on anchovy eggs by sardines, Sardinops sagax sagax. Further details on biological parameters used in this study on egg cannibalism are given in Santander et al. (in prep.) and Alheit et al. (in prep.). This investigation was a cooperative effort of IMARPE and the Peruvian-German Fisheries Research Project which was financed by the German Agency of Technical Cooperation (GTZ).
METHODS
In August/September 1981, 925 ichthyoplankton samples were collected by the R/V ‘Humboldt’ along the Peruvian coast from Pisco in the south to Punta Falsa in the north. Vertical hauls from 70 m. were carried out with the Calvet net. The area under investiga- tion was divided up into three regions: Region 1, from Punta Falsa to Salaverry, Region 2, from Salaverry to Puerto Supe and Region 3, from Puerto Supe to Pisco. More details on the egg samples from the sea are given in Santander et al. (in prep.).
With a delay of one to two weeks, 50 collections of anchovies and 16 collections of sardines, each one consisting of about 30 fish, were taken in the same area by a purse- seiner. The body cavity of the fish was opened and they were preserved in 10% formalin.
Anchovy eggs were assigned to three different age phases according to their embryonic development. Phase 1 corresponds to stages 1–2 of Santander and O.S. de Castillo (1973), phase 2 corresponds to stage 3–11 and phase 3 corresponds to stage 12–18.
RESULTS
Comparison of the abundances of eggs in the sea and of eggs encountered in stomachs. Anchovy eggs occurred along the whole Peruvian coastline from the north, about midway between Punta Falsa and Pimentel, down to the south, to Tambo de Mora (Figure 1). High densities (more than 100 eggs per sample = 0.05 m2) were recorded opposite Chicama, Salaverry, Chimbote, Huarmey, Puerto Supe, Huacho, Ancón, Callao and Tambo de Mora. The highest densities were around 1,000 eggs per sample, i.e., 20,000 eggs per m2. The mean numbers of anchovy eggs per anchovy stomach are included in Figure 1.
There is good agreement between the positions of collections with high numbers of eggs per stomach and the high densities of anchovy eggs in the sea, particularly opposite Chicama, Salaverry, Huacho, Ancón and Callao. Only one collection out of 50 did not have any anchovy with anchovy eggs in the stomach, and this collection was taken outside of the distribution area of the anchovy eggs in the sea. The distribution of the sardine eggs along the coast was not continuous, as it was in the case of the anchovy, but rather patchy (Figure 2). Again, the correspondence of occurrence of sardine eggs in the sea with the occurrence of sardine eggs in anchovy stomachs was fairly good, apart from the northern area. However, it has to be taken into account that the stomach samples were collected about one to two weeks later than the egg samples. This explains why there is not much correspondence in some areas and it demonstrates that some spawning areas are rather stable over a period of one to two weeks.
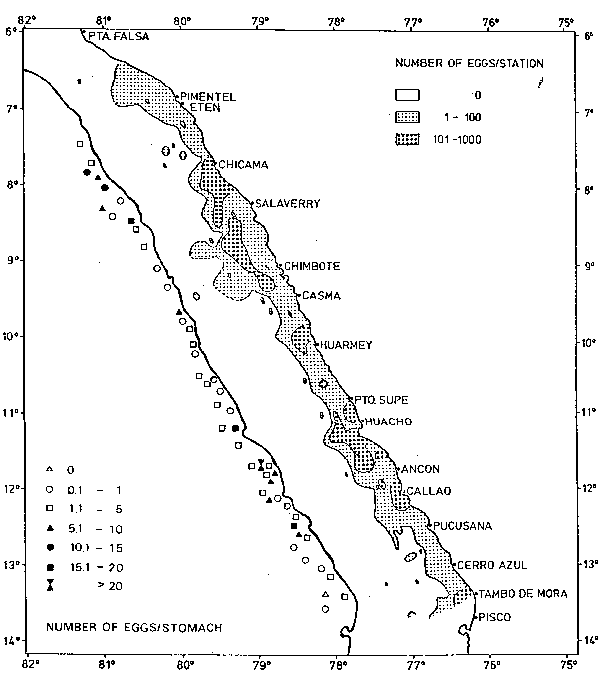
Fig. 1. Distribution and densities of anchovy eggs in the sea and in anchovy stomachs.
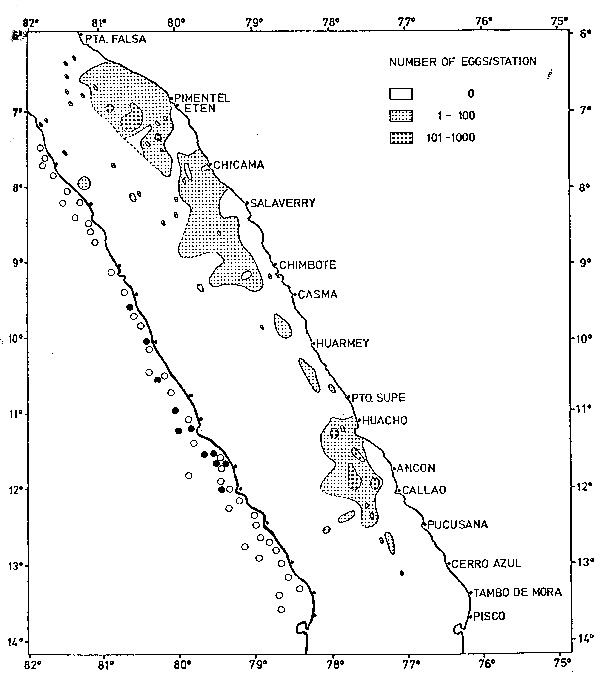
Fig. 2. Distribution of sardine eggs in the sea and in anchovy stomachs. • = sardine eggs found in stomachs, Ο = no sardine eggs found in stomachs.
Maximum densities of anchovy egg distribution. The density peaks of anchovy eggs were encountered at different distances off the coast in the three regions (Figure 3). In Region 1, in the north, the highest densities were between 8 and 14 miles off the coast. In Region 3, in the south, the highest densities were between 11 and 17 miles off the coast. However, in the middle, in Region 2, high densities were encountered over a large area, from 8 to 29 miles off the coast. When the data of the three regions are combined, it becomes evident that the highest densities were encountered from 11 to 14 miles off the coast, and that still fairly high densities were at 8 and 17 miles. The sites of the collections with high numbers of eggs per stomach partly overlap with the sites of high densities of anchovy eggs in the sea (Figure 4). With one exception, all collections with a mean value of more than 4 eggs per stomach were collected between 5.2 and 15.6 miles off the coast. This demonstrates that the anchovies take up more eggs in areas of high egg densities and eat less eggs in areas of lower densities.
Distribution of eggs in different phases of embryonic development. From Figure 3, it was assumed that the eggs are spawned by the anchovies mainly between 8 and 17 miles off the coast and that the eggs are then transported offshore and inshore. The decrease of egg densities offshore and inshore was supposed to be caused by a dilution effect due to transportation by water movements and due to a high egg mortality. The period from the spawning of the egg to the hatching of the larva is temperature dependent and lasts in the Peruvian anchovy about 2 to 2.5 days (Santander et al., in prep.). It was expected to find young newly spawned eggs mainly in the areas of high egg densities, whereas older eggs should be encountered further inshore and, particularly, further offshore.
To study these processes, the eggs collected from the sea and from the stomachs were assigned to three phases according to the state of their embryonic development (Table 1). The distribution of the three age phases was studied separately for the three regions. In doing that, one has to be aware of the fact that the duration of the three age phases is very different. Thus, e.g. the number of eggs in phase 1 should be relatively low, because this phase lasts only about 2.4 hours at 16.5°C. In Region 1 (Figure 5) the peak of phase 1 eggs was at 17 miles off the coast. Phase 2 peaked further inshore, at 11 and 14 miles. Phase 3 had its peak at 17 miles as phase 1.
Table 1: Duration of egg phases at 16.5°C, modified after P.E. Smith (MS, 1982).
| Phase | Duration (h) |
|---|---|
| 1 | 2.4 |
| 2 | 28.5 |
| 3 | 25.3 |
This demonstrates that the majority of the eggs is not transported away very far from the site of their spawning. However, with increasing age of the eggs the density peaks are less pronounced and older eggs seem to be spread more evenly over the area under investigation. Similar distributional movements of eggs in different phases took place in Region 2 (Figure 6) and Region 3 (Figure 7). In all three regions, the density peaks of phase 1 and phase 3 correspond with each other exactly, whereas the peak of phase 2 is always further inshore or offshore.
For the area between 5 and 23 miles offshore, the percentages of the eggs in the three phases were calculated (Table 2). 7.2% to 19.4% of the eggs were in phase 1, 68.6% to 86.8% in phase 2 and 6.0% to 12.0% in phase 3. On average, 13.4% of the eggs were in phase 1, 78.5% in phase 2 and 8% in phase 3. The same procedure was carried out with the eggs obtained from the stomachs. However, in this case, 39% of the eggs were in phase 1. 37% in phase 2 and 23.7% in phase 3. That means, about three times as many eggs as supposed were in phase 1 and 3, whereas only about the half of that what was expected was in phase 2.
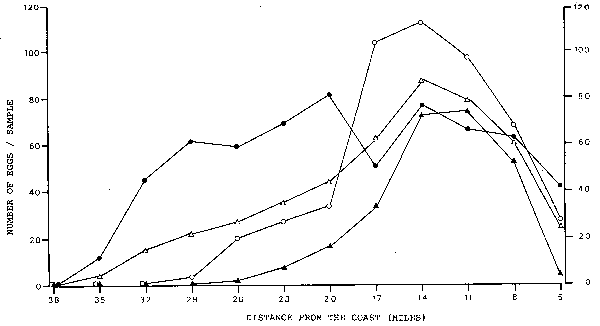
Fig. 3. Anchovy egg densities and their distance from the coast. Δ = Total area, ▲ = Region 2, Ο = Region 3.
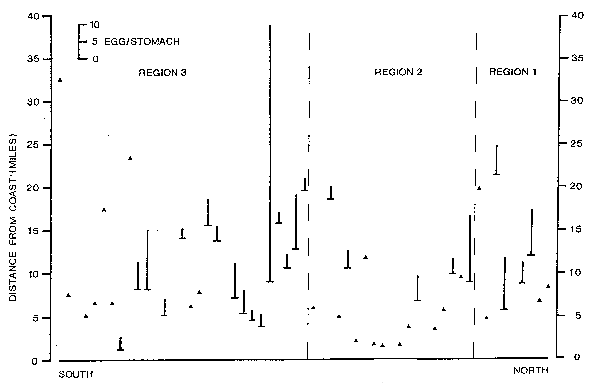
Fig. 4. Distance of anchovy collections from coast and mean number of eggs in anchovy stomachs per collection. ┴ = indicates in which distance from the coast the collection was taken, ▲ = less than four eggs per stomach.
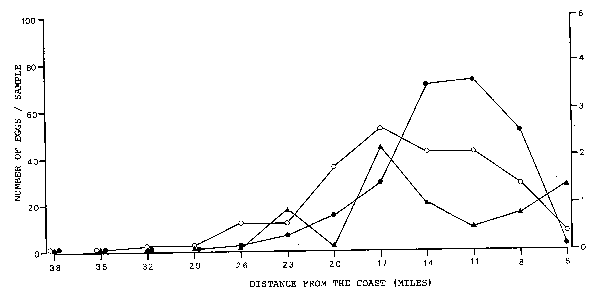
Fig. 5. Distribution of anchovy eggs, which are in different phases of embryonic development, in Region 1. ▲ = Phase 1, • = Phase 2, Ο = Phase 3.
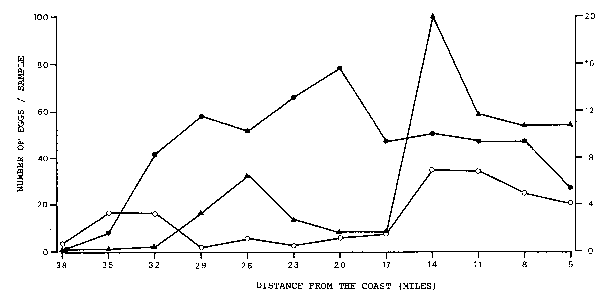
Fig. 6. Distribution of anchovy eggs, which are indifferent phases of embryonic development, in Region 2.
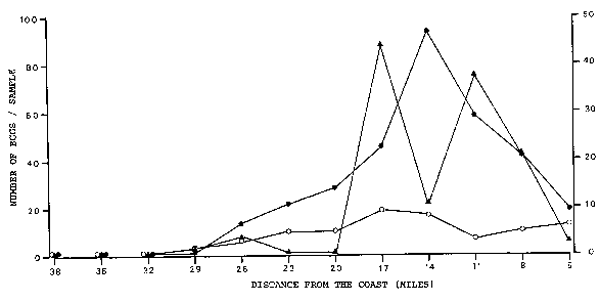
Fig. 7. Distribution of achovy eggs, which are in different phases of embryonic development, in Region 3.
| Region | Phase 1 | Phase 2 | Phase 3 | |||
|---|---|---|---|---|---|---|
| Sea | Stomach | Sea | Stomach | Sea | Stomach | |
| Region 1 | 7.2 | 69.2 | 86.8 | 17.8 | 6.0 | 13.0 |
| Region 2 | 13.7 | 13.6 | 80.2 | 53.3 | 6.1 | 33.1 |
| Region 3 | 19.4 | 39.2 | 68.6 | 37.2 | 12.0 | 23.7 |
| TOTAL | 13.4 | 39.3 | 78.5 | 37.0 | 8.0 | 23.7 |
Phase 1, which lasts only about 2.4 hours at a temperature of 16.5°C, is not only overrepresented in the stomach contents, but it is encountered as well in stomachs which were collected a long time after phase 1 had disappeared from the sea. The daily spawning period starts usually at 18.00 hours at night and lasts until 02.00 hours in the morning (Santander et al., in prep.). After 05.00 hours in the morning, phase 1 eggs should not be anymore in the sea. However, phase 1 eggs were obtained from stomach samples which were taken at any time over the daily 24 hours cycle (Table 3). The percentages of phase 1 eggs in stomachs were particularly high in the morning hours and they dropped towards the late afternoon, but phase 1 eggs did not disappear totally from the stomachs at any time of day.
| Time of day (hours) | Number of Collections | % of eggs | ||
|---|---|---|---|---|
| Phase 1 | Phase 2 | Phase 3 | ||
| 07.00–10.59 | 11 | 58.5 | 24.5 | 17.0 |
| 11.00–14.59 | 7 | 53.1 | 32.1 | 14.7 |
| 15.00–18.59 | 9 | 14.8 | 53.9 | 31.3 |
| 19.00–22.59 | 10 | 30.7 | 38.9 | 30.4 |
Comparison of mean numbers of anchovy eggs in anchovy and sardine stomachs. A total of 1,500 anchovy stomachs from 50 collections each one containing 30 fish were analysed for numbers of anchovy eggs. Mean numbers of eggs per stomach in these 50 collections ranged from 0 to 79.4 eggs. The total mean was 5.5 anchovy eggs per anchovy stomach (Table 4). A total of 578 sardine stomachs from 16 collections each one containing on average 36 fish were analysed, too. Mean number of anchovy eggs per stomach in these 16 collections ranged from 0 to 120.0 per sardine stomach. The total mean was 16.4 anchovy eggs per sardine stomach (Table 4). According to these data, an individual sardine had about three times as many anchovy eggs in its stomach than an anchovy.
| Anchovies | Sardines | |
|---|---|---|
| Number of collections | 50 | 16 |
| Total number of stomachs | 1,500 | 578 |
| Stomachs with anchovy eggs, % | 61.1 | 62.4 |
| Mean number of eggs per stomach | 5.5 | 16.4 |
Calculation of percentage natural egg mortality from egg cannibalism. Hunter and Kimbrell (1980) calculated how much natural mortality is due to egg cannibalism. Their method was slightly modified by MacCall (1980) who used the catch equation to determine the coefficient of mortality due to cannibalism:
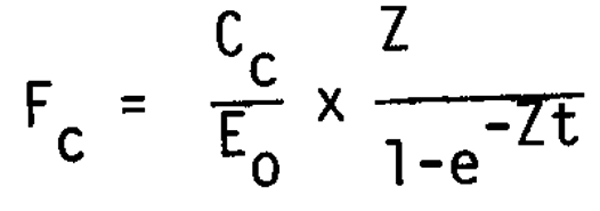
Where:
Cc = daily egg consumption per gram of adults
Eo = daily egg production per gram of adults
Fc = coefficient of mortality due to cannibalism
Z = coefficient of total mortality
t = length of time eggs are subject to mortality (i.e., time from spawning to hatching).
Using Hunter and Kimbrell's (1980) method and including MacCall's (1980) modification, the percentage of mortality due to egg cannibalism was calculated for the Peruvian anchovy and compared to that of the northern anchovy (Table 5). Whereas in Peru, egg cannibalism was responsible for 10% of the total egg mortality, this value was 28% for the northern anchovy.
| Variable | Peruvian | Northern |
|---|---|---|
| Anchovy | Anchovy | |
| A Mean eggs/stomach | 5.5 | 5.1 |
| B Rate of gastric evacuation | .701 | .701 |
| C Duration of feeding (h) | 24 | 24 |
| D Ration, eggs/fish | 92.53 | 85.80 |
| E Mean fish weight (g) | 25.8 | 16.8 |
| F Ration, eggs/grams wet weight = Cc | 3.6 | 5.1 |
| G Eggs spawned/grams ovary-free female weight | 581 | 389 |
| H Ratio of ovary-free weight to total female weight | .954 | .954 |
| I Eggs spawned/grams total female weight | 554 | 371 |
| J Ratio of females spawning/night | .16 | .16 |
| K Ration of females/school | .5 | .5 |
| L Eggs/gram school weight = Eo | 44.4 | 29.7 |
| M Coefficient of natural egg mortality = Z | .91 | .39 |
| N Length of time eggs are subject to mortality = t | 2.0 | 2.5 |
DISCUSSION
At the present state of knowledge, it is difficult to explain why eggs of phase 1 and 3 are overrepresented in anchovy stomachs. Misidentification is clearly not the reason, as eggs of the three phases cannot be confused with each other. All eggs which could not be identified were labelled as ‘disintegrated’ and not included in the calculations. However, it might be that eggs of phase 2 are particularly vulnerable to ‘disintegration’ in anchovy stomachs. Furthermore, as not much is known about the vertical distribution of anchovy eggs in different stages of embryonic development, it could be argued that phase 2 eggs are in depths in which the anchovies feed less. However, that does not seem very probable.
Another puzzle is the occurrence of phase 1 eggs in fish stomachs collected in the late afternoon. The analysis of the egg samples from the field demonstrated clearly that spawning is terminated at 02.00 hours and that no spawning takes place in daytime. The only explanation is that phase 1 eggs encountered in fish stomachs collected in the late afternoon must have been fed upon a long time before the fish were collected. That means, they must have spent several hours in the fish stomachs without being affected much by digestive processes. Hunter and Kimbrell (1980) report that identifiable parts of eggs may remain in the stomachs up to 8 hours, but the contents of the eggs (embryo and yolk) are digested after 2 hours. As the content of phase 1 eggs from stomachs collected in the afternoon was not damaged, one may conclude that phase 1 eggs are particularly resistant towards digestive processes. This supports the above mentioned hypothesis of differential vulnerability to ‘disintegration’ of eggs in different age phases.
The data in Table 5, give the impression that egg cannibalism in anchovies plays a less important role in the Peruvian anchovy. This would be surprising as the egg densities in the Peruvian ecosystem are higher than in the Californian system (Santander et al., 1982). However, it has to be considered that different methods were applied to collect the fish. Whereas, in California, the fish were caught with a trawl, in Peru, the anchovies were sampled with a purse-seiner. A purse-seine haul lasts usually 2 to 3 hours. If the fish stop feeding when the haul begins, a high number of eggs might already be digested by the time the fish are fixed in formalin. According to the gut evacuation rate determined in the laboratory by Hunter and Kimbrell (1980), the mean residence time of eggs in the stomach is only 1.4 hours. The 10% contribution of cannibalism to the total egg mortality estimated for the Peruvian anchovy (Table 5) has therefore, to be considered only as a minimum estimate.
For a long time, it has been speculated that exploited clupeoid species might be suppressed by competitors feeding on eggs and larvae (e.g. Murphy, 1977). The data on sardines predating on anchovy eggs which are presented here support this hypothesis. The mean number of anchovy eggs in sardine stomachs is more than three times higher than in anchovy stomachs (Table 4). However, it is not possible yet to estimate the consumption of anchovy eggs by sardines, as the stock size of the sardines in the spawning area of the anchovy is not known. Predation on anchovy eggs by sardines might be particularly dangerous to the central and northern Peruvian anchovy stock now, as the sardine stock seems to have been increasing over the last years (J. Valdivia, pers. comm.) whereas the anchovy stock has reached its lowest level ever recorded (Santander et al., in prep.).
REFERENCES
Alheit, J., V.H. Alarcon and B.J. Macewicz. (in prep.). Spawning rate and sex ratio in the Peruvian anchovy, Engraulis ringens.
Hunter, J.R. and C.A. Kimbrell. 1980. Egg cannibalism in the northern anchovy, Engraulis mordax. Fish Bull.(U.S.) 78:811–816.
MacCall, A.D. 1980. The consequences of cannibalism in the stock-recruitment relationship of planktivorous pelagic fishes such as Engraulis. pp. 201–220. In Workshop on the effects of environmental variation on the survival of larval pelagic fishes. (G.D.Sharp, ed.) Intergovernmental Oceanographic Commission, Workshop Report 28. IOC/UNESCO, Paris.
Murphy, G.I. 1977. Clupeoids. pp. 283–308. In Fish Population Dynamics (J.A. Gulland, ed.) John Wiley and Sons New York. 372 p.
Rojas De Mendiola, B. 1980. Summary of the studies about food and feeding habits of the anchovy (Engraulis ringens J.) pp. 221–231. In Workshop on the effects of environmental variation on the survival of larval pelagic fishes. (G.D. Sharp, ed.) Intergovernmental Oceanographic Commission, Workshop Report 28. IOC/UNESCO, Paris.
Rojas de Mendiola, B. and N. Ochoa. 1973. Observation on the food and feeding habits of the anchovy Engraulis ringens (Jenyns) made during cruise 6908–09. pp. 457–461. In Oceanography of the south Pacific (R. Fraser, comp.) New Zealand Nat.Comm.for UNESCO, Wellington, New Zealand.
Santander, H. y O.S. de Castillo. 1973. Estudio sobre las primeras etapas de vida de la anchoveta. Inf.Inst.Mar.Peru, Callao. 41:3–30.
Santander, H., J. Alheit and P.E. Smith (in prep.). Estimacion de la biomasa desovante de la anchoveta Peruana, Engraulis ringens, del stock central y norte en 1981 usando el ‘Metodo de Producción de Huevos’. Bol.Inst.Mar.Peru, Callao.
Santander, H., P.E.Smith and J. Alheit. 1982. Determination of sampling effort required for estimating egg production of anchoveta, Engraulis ringens, off Peru. Bol.Inst.Mar. Peru, Callao. 7:3–18.
by
Paul E. Smith,1 Haydee Santander2 and Jürgen Alheit3
1 Southwest Fisheries Center
P.O. Box 271
La Jolla, CA 92038
USA
2 Instituto del Mar del Perú
Esq. Gamarra y Gral. Valle
Apartado Postal 22
Chucuito, Callao
Perú
3 Programa Cooperativo Peruano-Alemán de
Investigación Pesquera (PROCOPA)
Instituto del Mar del Perú
Esq. Gamarra y Gral. Valle
Apartado Postal 22
Chucuito, Callao
Perú
Resumen
Se dispone de datos de reconocimiento de ictioplancton de más de 20 años del sistema de afloramiento del Perú y de más de 30 años del sistema de afloramiento de California. Se comparan las distribuciones de probabilidad de muestras de huevos de dos especies de clupeidos de estos dos sistemas (Engraulis ringens y Sardinops sagax del Perú y E. mordax y S. caerulea de California). El análisis de las distribuciones de las muestras de huevos combinado con datos adicionales permite estudiar actividades biológicas importantes de peces pelágicos, tales como agregación, fertilización, etc. Además se puede determinar la efectividad de canibalismo directo e incidental, de la predación, y de otras causas de mor- talidad a través de la distribución inicial de huevos y la dispersión subsiguien- te y el transporte hacia afuera de las áreas de desove. La escala e intensidad del patrón cambian con el tiempo y pueden afectar el esfuerzo de muestreo que se requiere para estimar la producción y sobrevivencia de los huevos y pueden complicar el ajuste de las ecuaciones de mortalidad que asumen una varianza cons- tante con términos absolutos o relativos.
INTRODUCTION
The egg sample probability distribution of the Peruvian anchovy (Engraulis ringens) has been used to design an egg production survey with precision estimated from existing samples by Santander, Smith, and Alheit (1982). It should be possible, with existing data, to estimate the optimum survey effort for the determination of egg production of the sardine off Peru and California and analagous multiple pelagic-spawners of other species and in other areas, given historical sample data.
It is the purpose of this paper to briefly compare historical data on egg abundance per sample for four stocks from two genera (Engraulis and Sardinops), from two habitats (Peru and California). While it is not yet possible to infer historical egg production rates from these sets of data it should now be possible to estimate the number of samples needed for a given precision in future surveys. Also the analysis of sample probability distributions may lead to new insights into the origins of patches of eggs and the fate of the spawning products as they disperse (Smith, 1973) and the causes and degree of variation in the survival of the spawning products. This study was part of a cooperative project of the Southwest Fisheries Center, California, the Instituto del Mar del Peru and the “Cooperative Peruvian-German Fisheries Research Project” (PROCOPA) which is financed by the “German Agency of Technical Cooperation” (GTZ).
METHODS
Detailed accounts of sampling and sorting methods are given by Santander and S. de Castillo (1979) for the Peruvian samples and by Kramer et al. (1972) for the Californian samples. Briefly, the IMARPE samples are from a Hensen Egg Net towed vertically from 50 meters depth sampling directly under 0.3 square meters. The CalCOFI samples were towed obliquely from 140 or 210 meters. To report the values in similar units the IMARPE samples are divided by 3 and both are reported here as eggs per square meter sea surface area.
RESULTS
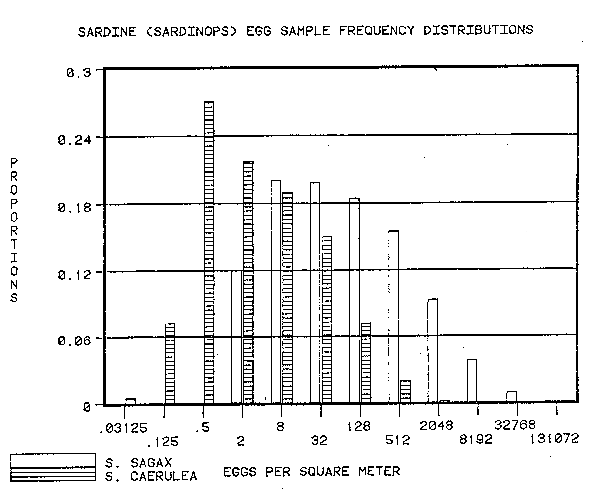
The number of anchovy eggs in the IMARPE samples was greater than the number of anchovy eggs in the CalCOFI samples. The number of sardine eggs in the IMARPE samples was greater than those in the CalCOFI samples. Both species of the genus Engraulis yielded number of eggs greater than the cohabitant of the genus Sardinops (Figures 1 and 2).
Part of the differences between the numbers of eggs per sample are due to the sampling technique. Some anchovy eggs are lost through the meshes of the CalCOFI net. Also the lower treshhold of egg density detected by the IMARPE net is higher (3 eggs per square meter) than that detected by the CalCOFI net (approximately 0.3 eggs per square meter). Since the bulk of the population at the egg stage is in the larger samples, it is not likely that these differences will be important.
The difference in sardine eggs per unit surface area between IMARPE samples and CalCOFI samples is of the same order of magnitude as the difference in anchovy egg sample sizes. In both cases the difference is between 4– and 16–fold. This signals a radical difference between the Peruvian and Californian habitats which directly effects both sardine and anchovy at the time of spawning and during the subsequent dispersal and mortality phase.
DISCUSSION
The most important result of this study is that for a given precision it will be necessary to take more samples in the area of spawning to estimate the egg production of the stocks of Engraulis and Sardinops off Peru than off California. That this is not inherent in the different methods of sampling or different stock sizes is indicated by the stability of the egg distributions of the Californian sardine when several different samples sizes were used while the spawning biomass changed from 4 million tons to less than 10 thousand tons (Smith and Ricardson, 1977).
Figure 1
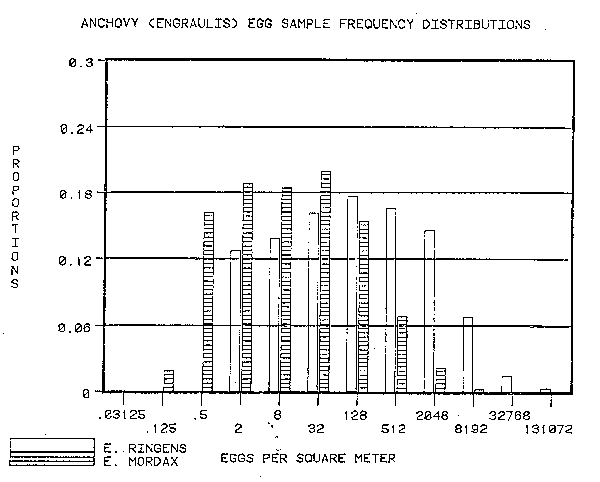
Figure 2
To explore the meaning of the egg sample distributions presented here, it is necessary to postulate a conceptual framework for the four stocks of fish which incorporates spatial distribution of mature adult fish at the time of spawning and the time distribution of the spawning process.
Spatial scale and intensity of distribution: Unfortunately the features of spatial scale and intensity are not equally well known for the four stocks examined here. The geographic distribution of all four species is well known. Also, the stock boundaries are well known in the offshore-onshore plane, but are less well known along the coast and these stock divisions may fluctuate with season and with interannual climatic conditions of changes in stock biomass (see MacCall, in prep.).
For scales of distribution below the species, and stock or subpopulation, only the beginning of perception has been reached for Engraulis mordax. Schools are unevenly distributed in the habitat and the aggregations of schools are called “school groups” or “shoal groups” (Fiedler, 1978). These can be characterized as 3000 schools in a 6 nautical mile (10 km) disc with 100 schools per square nautical mile. While most of the schools are small (15 m radius) most of the fish are in large schools (50 m radius). The school groups probably include all ages and sizes of fish but the schools probably consist of either “0” group or adult but not both.
Hewitt, Smith and Brown (1976) estimated that the schools contained 15 kilograms of mature fish per square meter of which some faction are ready to spawn each night. It is not known what fraction of males participate in spawning each night. The females spawn in the height of the spawning season each 6 to 8 nights (Hunter and Macewicz, 1980; Alheit et al., this volume). That the spawners for a given night segregate within the school before spawning is suggested by the odd sex ratios (3 or 4 males per female) and above average proportions of spawning females.
It is also not known how the various spawners are arrayed at the time of spawning. The quantity of sperm available probably limits the volume through which the eggs are distributed. For the purpose of this discussion we shall use the concentration of ten thousand to one hundred thousand eggs per cubic meter.
In summary, the species involved in this paper extend for one or two thousand miles of coastline in the temperate zone of the Pacific coast of North and South America and into the tropics of South America. The species are apparently subdivided into stocks or subpopulations extending a few hundred miles along the coast within tens of miles of the coastline in South America and within a few hundred miles of the coast in North America. We assume that these stocks form school groups of a few nautical miles extent and these are comprised of schools of tens of meters radius concentrated at 100 schools per nautical square mile. Within the schools in daytime, there are about 15 kilograms of fish per square meter of surface area. The night-time concentration is assumed to be less dense. Also, in the spawning season, the spawning females and their male attendants segregate early in the evening to spawn and fertilize the spawn and reaggregate with the schools before dawn.
Temporal scales of egg production: The early work on spawning frequency (Hunter and Goldberg, 1979; Alheit et al., this volume) indicates that a female of the genus Engraulis may spawn a hundred or so batches of eggs in her lifetime. The female may spawn a limited number of times in the first year of life and in later years may spawn 30 times per year. The spawning appears to be intensified seasonally, beginning in the winter months and persisting for some months, depending on the age, size, and condition of the female and the feeding conditions. Hunter (pers. comm.) believes that spawning rate in Engraulis mordax is controlled by the amount of fat stored in previous summer and the feeding conditions at the time of spawning. Hunter and Leong (1981) state that 10 to 15 batches could be spawned using the energy in stored fat and that subsequent spawnings would be derived from feeding during the spawning season. Smith and Eppley (1982) found a correlation suggestive of a link between the zooplankton abundance in the preceeding summer and the larva abundance in the spawning season. Hunter (pers. comm.) believes the pattern of atresia or resorption of oocytes prior to spawning matches this viewpoint since atresia is most common in young fish with little stored fat and with older fish late in the season of heaviest spawning.
On the daily time scale, the collective spawning interval extends from about sundown to a couple of hours after midnight with a propensity to spawn within 3 hours of midnight. It appears that individual females spawn in a very short time because the increasing incidence of samples with newly spawned eggs (fraction of samples with newly spawned eggs) and the increasing abundance of newly spawned eggs (newly spawned eggs per sample) with time are nearly parallel. If individual females spawned over an 8 hours period one would expect the incidence of newly spawned eggs to rise rapidly with the change in abundance following many hours later.
These general features appear to be similar for Engraulis mordax and E. ringens. The life span of the Sardinops is much longer but the number of spawnings or the maximum rate of spawning is not known for this genus. However the daily cycle of spawning is similar in Sardinops caerulea (Smith, 1973).
Changes of spatial scale with time: At the moment of spawning, the Engraulis schools are at the scale of tens of meters and the scale of the egg patches of Sardinops and Engraulis are on the scale of hundreds of meters (Smith, 1973; Smith and Hewitt MS) and the yolk sac larvae patches are on the scale of a few thousand meters (Hewitt, 1982). In a period of five days after spawning turbulent diffusion has spread the newly spawned eggs, covering at most a few tenths of one percent of the sea surface in the spawning area to covering nearly 70% of the sea surface at hatching time.
There may be different explanations for the greater intensity of Sardinops and Engraulis egg distribution off Peru as compared to California and the differences between the Engraulis in both hemispheres and the Sardinops in both hemispheres. To consider these, we must establish some useful categories of causes for differences in the scale and intensity of patches of eggs. One category of difference can be termed “demographic”. That is if the age distribution of the females is older the stock will be made up of larger fishes and for the two genera the size distribution of Sardinops females will be larger than Engraulis females. Another category of difference can be labeled “behavioral”. That is if the individual females behave in such a way as to distribute their spawn in smaller, more compact patches this would retard subsequent dispersal rates relative to females which disperse their spawn in larger, more diffuse patches. Another category of difference causing changes in distribution of sample sizes of eggs could be labeled “environmental”. That is the subsequent mixing of the spawning products or the pattern of mortality could in time impose a different sample frequency distribution. We shall discuss these categories in more detail.
Demographic factors affecting the number of eggs per sample: The relationships between fish weight and eggs per gram of fish weight are not completely known for Engraulis mordax, Engraulis ringens, Sardinops caerulea, and Sardinops sagax. For Engraulis mordax, the relationship is apparently linear (Picquelle and Hewitt, 1982; Alheit et al., in prep.) for the period 1980 through 1982 for the central subpopulation. Neither E. mordax nor E. ringens have been examined with regard to age-specific fecundity as distinguished from size-specific fecundity. Even though age and weight are related, the differences between weight at age and the ranges of weights and ages could explain the differences apparent in the linearity of the fecundity with weight. It is not known how this would affect the distribution of eggs in the sea. If the older or larger females were capable of spawning more eggs into a column of water there could be persistent changes in the egg sample distribution. However, it appears that the Sardinops places fewer eggs in a column of water even though the female of the genus Sardinops is larger than the female of the genus Engraulis.
Another demographic feature is age and size at first maturity. Females of genus Engraulis appear to begin maturation in the first year of life while the females of the genus Sardinops mature somewhat later and at a larger size. Within Engraulis mordax females it is characteristic for the “0” group females to begin spawning later in the season and stop sooner than females of the older cohorts. If there were similar maturational features in the genus Sardinops, this could lead to both inter-specific and inter-generic differences by some influence on the number of eggs spawned in a column of water according to size. In this case, smaller movements of smaller females would tend to increase the number of eggs per unit surface area. While this would explain the inter- generic differences it is contrary to the interspecific differences in E. mordax with an average female weight of 16 grams while E. ringens with higher numbers of eggs per unit surface area had female weights in the range of 25 grams.
In summary, it is not clear how demographic features could by themselves explain the differences in eggs per unit surface area. It seems more likely that demographic features would be coupled with behavioral and environmental factors to change the distribution of spawn.
Behavioural factors affecting the number of eggs per sample: On the geographic scale, if the adults of the species aggregate on a specific spawning site this would tend to increase the number of eggs per unit area within the spawning area. It is known that Sardinops caerulea migrated to a spawning site hundreds of miles from the feeding zone. To what degree the Engraulis species do this is not known but the Engraulis ringens spawning zone appears to be much more restricted in distance from shore than that for Engraulis mordax. Thus one source to be considered for the differences in the number of eggs per sample is the degree to which the spawners aggregate for spawning. This increases the chance that areas with new spawn would overlap other spawning sites from previous days and thus the number of eggs per unit surface area would be higher. If this were the main cause the order of concentration at spawning time would be Engraulis ringens, Engraulis mordax, Sardinops sagax and Sardinops caerulea. This behavioural factor could interact with population demography if the older and larger females were more capable of assembling denser spawning aggregations.
Another behavioral factor could apply at the individual spawning fish scale. For example, if one species, say an Engraulis in this case, were to continually turn and circle while spawning and Sardinops were to undertake long spawning runs in a straight line, this could affect the initial concentration of eggs and the subsequent dispersal rate. If linear spawning runs were the usual, this would also interact with the demographic factors by faster swimming rates.
Environmental factors affecting the number of eggs per sample: Temperature, turbulence, predation and production are environmental factors affecting the number of eggs per sample. Temperature influences the developmental rate of the eggs (Table 1) and thus influences the probability that the eggs from two different spawning concentrations would be found in a single sample. For example the largest sample of 1300 samples of Sardinops caerulea eggs taken between 1951 and 1959 contained two ages of eggs two days apart in age (Smith, 1973). The probability of this kind of event would increase in colder water. The duration of the egg stage at 13 degrees Celsius is about four days for Sardinops and Engraulis and two days at 18 degrees. This does not appear to be the case for the stocks under investigation. The IMARPE samples are from warmer temperature than the CalCOFI samples.
Table 1
TEMPERATURE AND INCUBATION TIME FOR
ENGRAULIS MORDAX AND SARDINOPS CAERULEA
(ZWEIFEL AND LASKER, 1976)
| INCUBATION TEMPERATURE | ENGRAULIS MORDAX | SARDINOPS CAERULEA |
|---|---|---|
| 11 | 5.8 days | |
| 11.1 | 4.7 days | |
| 12 | 4.8 | |
| 12.5 | 4.1 | |
| 13 | 3.9 | |
| 13.8 | 3.3 | |
| 14 | 3.3 | |
| 15 | 2.8 | |
| 15.2 | 2.6 | |
| 16 | 2.5 | |
| 16.6 | 2.3 | |
| 17 | 2.2 | |
| 18 | 2.0 | 2.0 |
| 19 | 1.8 | |
| 19.4 | 1.7 | |
| 20 | 1.6 | |
| 20.8 | 1.5 | |
| 21 | 1.4 |
Turbulent diffusion could have a major effect on the number of eggs per sample. It appears that both Engraulis species and Sardinops select areas and seasons which minimize turbulent diffusion and offshore transport (Bakun and Parrish, 1982; Husby and Nelson, 1982) off the Pacific coastline of both North and South America. It seems likely that the differences in egg sample numbers could be controlled by the rate of the turbulent diffusion or by a combination of higher initial concentrations of eggs interacting with the lower rate of turbulent diffusion which this would imply.
The effect of predation on the numbers of eggs in each sample would be to change the probability of more than one day's spawning being taken at the same time. It would also be important to know if predation interacted with behavioral features of the predators including cannibals. For example if the predation were merely incidental to feeding on other food particles there would be a proportional drop in all ages of eggs in numbers per unit area. If there were directed predation on the densest concentrations of eggs there would disproportionately higher losses in the earlier ages at the highest concentrations. This could also have an effect on the differences between Engraulis and Sardinops eggs as the latter are much larger and may be filtered by more predators. The difference in effects would rest on the relative concentrations per unit volume even though the effect would eventually be expressed in numbers of eggs per unit sea surface. The relative visibility of the Engraulis and Sardinops eggs would be important for visual predators. The differences between the stocks in different hemispheres would also depend on the abundance and effectiveness of the predators found in those waters in the spawning season. Production may influence the numbers of eggs per sample. One way in which food production could control the numbers of eggs per sample is by increasing the frequency of spawning. So far the applications of the SWFC Egg Production Method have found the fre- quency of spawning off California to be 14.5% in April of 1980, 10.6% in February of 1981, 12,5% in April of 1981, and 12.0% in February of 1982. Off Peru in August–September of 1981, the percent spawning was 16%. This translates to a group average of mature females spawning each 6 days respectively. Spawning at high frequency would influence the chance of two spawning patches overlapping which would increase the range of egg numbers and increase the chances of sampling the origin of an egg patch which would increase the frequency of sampling large numbers of eggs less than the maximum.
Another mechanism for production to influence the number of eggs in a sample is by controlling the feeding behavior of the reproducing stock. For example if the stock were distributed so as not to depress the number of herbivores, the feeding behavior of Engraulis and Sardinops would be by biting-diminishing the incidence of cannibalism by inadvertant filtering. If production were lower and the growth of the herbivore populations were depressed by the fish, then the incidence of filter feeding and incidental cannibalism would increase, diminishing the numbers of eggs per sample.
Another factor controlled by production would be if the mean motion of that portion of a school which is spawning were reduced in favorable feeding areas and increased in less favorable feeding areas. For example a daytime school may contain 15,000 grams of adult fish per square meter of sea surface area over the school. With no net motion nor spreading of the school at night, there would be 7,500 grams of females and about 1000 grams of spawning females per square meter of sea surface area. With a batch fecundity of 500 eggs per gram, there would be 500,000 eggs per square meter, a number higher than yet observed for any of the four stocks considered here. If the feeding activities carried the school 250 meters during the half-hour spawning period there would be 2000 eggs per square meter. This number is exceeded in about 20% of the samples of E. ringens, 3% of the samples of E. mordax, 15% of the S. sagax, and less than 1% of the samples of S. caerulea.
SUMMARY
1) The numbers of eggs of Engraulis ringens off Peru per square meter exceed those of Engraulis mordax off California.
2) The numbers of eggs of Sardinops sagax off Peru per square meter exceed those of Sardinops caerulea off California.
3) Both off Peru and California the numbers of eggs from the genus Engraulis exceed those of the genus Sardinops.
4) A wide variety of demographic, behavioural and environmental factors has been discussed singly and jointly and there needs to be special research conducted to identify the most important influences. It seems plausible that the differences in numbers of eggs per square meter between the genera Engraulis and Sardinops are caused primarily by demographic differences in the populations and that the differences between the Peruvian stocks and Californian stocks are caused primarily by environmental factors in concert with behaviour.
5) Regardless of the causes of the difference in egg distribution among the four stocks off Peru and California, caution is warranted in establishing the optimum number of samples for calculating the egg mortality using the Southwest Fisheries Center Egg Production Method. It appears that more samples will be needed for a fixed precision in the Peruvian anchoveta compared with the other three stocks.
6) Some of the features distinguishing the four stocks studied here may effect the efficacy of the mortality regression method and its precision. Particularly those features implying selective predation and cannibalism (Santander et al., MS) could strongly affect the assumption of equal variance in real or proportional terms for the regression of egg abundance on time. Also environmental changes in the rate of dispersal of the eggs could also complicate regression methods which require stability of variance among the elements of the regression.
7) The degree of difference among the eggs per unit surface area, when all have likely had an origin in a compact volume for external fertilization, is likely to portend great differences in the biology of the embryonic stages and the ultimate contribution of fluctuations of position and survival during this stage to population control mechanisms.
REFERENCES
Alheit, J., V.H. Alarcon and B.J. Macewicz (in prep.) Spawning frequency and sex ratio in the Peruvian anchovy, Engraulis ringens.
Alheit, J., J.R. Hunter, B. Alegre, V.H. Alarcon and B.J. Macewicz (This volume). Batch fecundity and spawning frequency of various anchovy. (Genus: Engraulis) populations from upwelling areas and their use for spawning biomass estimates.
Bakun, R. and R.H. Parrish. 1982. Turbulence, transport, and pelagic fish in the California and Peru Current systems. Calif.Coop.Oceanic Fish.Invest.Rep. 23:101–112.
Fiedler, P.C. 1978. The precision of simulated transect surveys of northern anchovy, Engraulis mordax, school groups. U.S. Fishery Bulletin 76:679–685.
Hewitt, R.P. 1982. Spatial pattern and survival of anchovy larvae: Implications of adult reproductive strategy. Doctoral Dissertation University of California at San Diego, Scripps Institution of Oceanography, Marine Biology. 187 p.
Hewitt, R.P., P.E. Smith and J. Brown. 1976. Development and use of sonar mapping for pelagic stock assessment in the California Current area. Fishery Bulletin U.S. 74:281–300.
Hunter, J.R. and S.R. Goldberg. 1980. Spawning incidence and batch fecundity in northern anchovy. Engraulis mordax. Fishery Bulletin U.S. 77:641–652.
Hunter, J.R. and C. Kimbrell. 1981. Egg cannibalism in the northern anchovy, Engraulis mordax. Fishery Bulletin U.S. 78:811–816.
Hunter, J.R. and R. Leong. 1981. The spawning energetics of female northern anchovy, Engraulis mordax. Fishery Bulletin U.S. 79:215–230.
Hunter, J.R. and B.J. Macewicz. 1980. Sexual maturity, batch fecundity, spawning frequency, and temporal pattern of spawning for the northern anchovy, Engraulis mordax during the 1979 spawning season. Calif.Coop.Oceanic Fish.Invest.Rep. 21:139–149.
Husby, D.M. and C.S. Nelson. 1982. Turbulence and vertical stability in the California Current. Calif.Coop.Oceanic Fish.Invest.Rep. 23:113–129.
Kramer, D.M., M. Kalin, E. Stevens, J. Thrailkill and J. Zweifel. 1972. Collecting and processing data on fish eggs and larvae in the California Current region. NOAA Tech.Rep. NMFS Circ. 370.
Lynn, R.J., K.A. Bliss and L.E. Eber. 1982. Vertical and horizontal distributions of seasonal mean temperature, salinity, sigma-t, stability, dynamic height, oxygen and oxygen saturation in the California Current, 1950–1978. Calif.Coop.Oceanic Fish.Invest.Atlas No. 30. 513 p.
MacCall, A.D. 1980. The consequences of cannibalism in the stock-recruitment relationship of planktivorous pelagic fishes such as Engraulis. pp. 201–220. In Workshop on the effects of environmental variations on the survival of larval pelagic fishes (G.D. Sharp, ed.) IOC/UNESCO, Paris.
MacCall, A.D. (in prep.). Antagonism between population diffusion and density dependent habitat selection: Prediction of anisotropic gene flow.
Picquelle, S.J. and R.P. Hewitt. 1982. The northern anchovy spawning biomass for the 1982–83 California fishing season. Southwest Fisheries Center Admin.Rep.LJ-82–16. 37 p.
Santander, H. and O.S. de Castillo. 1979. El ictioplancton de la costa peruana. Bol.Inst.Mar Peru Callao 4(3):69–112.
Santander, H., J. Alheit y P.E. Smith (in prep.) Estimación de la biomasa desovante de la anchoveta peruana, Engraulis ringens, del stock central y norte en 1981 usando el ‘Método de Producción de Huevos’. Bol.Inst.Mar Peru Callao. 70p.
Santander, H., J. Alheit, A.D. MacCall and A. Alamo. (This volume). Egg mortality of the peruvian anchovy (Engraulis ringens) caused by cannibalism and predation by sardines (Sardinops sagax).
Santander, H., P.E. Smith y Alheit. 1982. Determinación del esfuerzo de muestreo requerido para el estimado de producción de huevos de anchoveta, Engraulis ringens, frente al Peru. Bol.Inst. Mar Peru Callao 7(1):1–18.
Smith, P.E. 1973. The mortality and dispersal of sardine eggs and larvae. Rapp.P.-v.Réun. CIEM 164.282–292.
Smith, P.E. 1981. Fisheries on coastal pelagic schooling fish. pp. 1–29. In Marine Fish Larvae: Morphology, ecology, and relation to fisheries (R. Lasker, ed.) Washington Sea Grant Program, University of Washington Presse, Seattle and London.
Smith, P.E. and R. Lasker. 1978. Position of larval fish in an ecosystem. Rapp.P.-v.Réun. CIEM 173:77–84.
Smith, P.E. and R.W. Eppley. 1982. Primary production and the anchovy population in the southern California bight: Comparison of time series. Limnol. and Oceanogr. 27:1–17.
Smith, P.E. and R.P. Hewitt. (in prep.) Spatial inferences from replicate samples of anchovy eggs.
Smith, P.E. and S.L. Richardson. 1977. Standard techniques for pelagic fish egg and larva surveys. FAO Fish.Tech.Pap. 175:1–100.
Stauffer, G.D. and S.J. Picquelle. 1980. Estimates of the 1980 spawning biomass of the central subpopulation of northern anchovy. Southwest Fisheries Center Admin.Rep.No.LJ-80–90.
Stauffer, G.D. and S.J. Picquelle. (in prep.) Egg production estimates of spawning biomass of the northern anchovy, Engraulis mordax, for 1980 and 1981.
(Summary only)
by
R.H. Parrish and D.L. Mallicoate
Pacific Environmental Group
Southwest Fisheries Center
National Marine Fisheries Service, NOAA
P.O. Box 831
Monterey, California 93942
U.S.A.
SUMMARY
Traditional single species fisheries models have recently received a great deal of criticism, and a shift in emphasis to multispecies and ecosystem models has been advocated. An alternative approach is to develop more realistic single species models that overcome the limitations of most present models. Where sufficient information is available this could be accomplished by replacing spawner-recruit relationships with separate model components from eggs, larvae, and juveniles and by increasing the complexity of the post-recruit, or adult components of the model so that egg production rather than spawning biomass is the index of reproduction.
More precise steady state and density-dependent fisheries models are, of course, not likely to be of much more utility than present models. What is needed is assessment or prediction of the potential variability of populations. This could be accomplished through real-time measurement of population rates or through development of predictive models which describe the relationships between population rates and easily measured climatic or biotic factors.
Fishery sampling and resource surveys carried out through the CalCOFI program in California have produced a data base which is approaching the magnitude which will allow the direct assessment of egg production, egg mortality, larval growth and mortality, and post-recruit growth and mortality. The sampling programs and data base on juveniles are much less extensive than those for eggs, larvae, and post-recruits; however, research on juveniles is increasing.
Expansion of the post-recruit and egg production components of fisheries models is possible on stocks which have a time series of traditional fishery sampling. We have used California Department of Fish and Game fishery sampling and sea survey data on anchovy, Engraulis mordax, and mackerel, Scomber japonicus to describe the variability of post-recruit life history rates, including the following:
- seasonal variation in growth
- regional variation in growth, age composition, and spawning season
- age-dependent variations in spawning season, spawning frequency, annual fecundity and distribution with depth
- interyear variations in growth, age-at-maturity, condition factor, and spawning frequency.
The extreme variability of population rates observed in California pelagic fisheriès and the potential accumulative or synergistic effects-of combinations of these rates suggest that the population biology of these stocks are exceedingly complex. Significant improvement of single species models would be expected through either real-time measurement of population rates or through the development of environmentally-dependent predictive models of the rates.
by
A.A. Elizarov
All-Union Research Institute of Marine Fisheries
and Oceanography (VNIRO)
17, V. Krasnoselskaya
Moscow, B-140, 107140
USSR
The patterns of long-term changes in the Earth's natural characteristics are among the main subjects of modern oceanological investigations. Results of these investigations affect long-range forecasts of atmostpheric and hydrospheric temperature and of ice conditions, predictions of year-class strength of the most important commercial species and of substantial changes in their distribution.
Needless to say, the biotic phenomena are functionally related to abiotic conditions. The strength of year-classes of commercial species, the annual recruitment to fish populations and their total stocks are closely related to annual and long-term variations in abiotic (physical and chemical) conditions.
In many cases, as in the case of the anomalous development of “El Niño”, a close relationship between the ichthyomass fluctuations and the environmental conditions is readily apparent, while in other (most often not extreme) situations it is obscured by some local or short-term processes and phenomena. The latter calls for a close examination of the time of onset and the periodicity of recurrence of extreme years.
For many reasons, such as instability of the processes, inadequate observation series etc., the formal mathematical processing of observation series is as yet unsatisfactory, especially in revealing extreme situations which are of great practical significance.
It has been noted before that there is a very great similarity (pointing to real regularity rather than to randomness) in the onset of extrema in such dissimilar and remote phenomena as: “El Niño” the intensity of warm water influx to the southern Barents Sea; the dispersion of icebergs by the Labrador Current; the strength of cod year- classes in the fishing areas of the North Atlantic and the Norwegian and Barents Seas; the transport of the West Greenland Current; the air pressure difference between Ponta Delgado and Stikkysholm, etc. (Elizarov, 1974; 1976; 1962).
Without exception, in all these observation series the extrema fall on 1949–1951 (most often 1950), 1956–1958, 1964–1966 and 1970–1972. In the North Atlantic other years with extreme situations have been observed, and the analysis of these suggests the existence of two independent quasi-seven year (mostly six-eight year) rhythms of long-term changes in the water circulation intensity and the year-class strength of important commercial fish species. Recent data are consistent with this conclusion. For example, water temperature minima along the Kola meridian occurred in 1941/42, 1948, 1956, 1963, 1971 and 1979, as well as in 1945/46, 1953, 1958, 1966, 1974 and 1981/(82?), while maxima occurred in 1937/38, 1944, 1950, 1957, 1964, 1970, 1975/76, as well as in 1939, 1947, 1954, 1959/60, 1967/68, 1973 and 1980.
Needless to say, a purely formal approach would lead to the conclusion that the minima and maxima set in on the average practically every 3.5 years over the period of 40 years. However, this formal conclusion in inconsistent with the pattern of the analysed wave. Indeed, the interval between adjacent troughs or peaks varies constantly from 2–3 to 4–5 years. The quasi-seven year rhythms are also indicated by the frequency of “El Niño” recurrence and the rhythms of other biotic and abiotic processes (Elizarov, 1974).
The proposed construction is undoubtedly somewhat artificial, yet based on its regularities a certain warming in the southern Barents Sea in 1983/84 and a cooling and, consequently, deterioration of reproductive conditions for boreal fishes in 1985/86 may be expected. As has been said before, formal mathematical computation is at present hardly applicable for prediction purposes because of the instability of major processes and almost complete ignorance of the mechanisms of long-term fluctuations.
To be sure, our artificial construction is by no means the only possible variant. It would be of interest to recall the main concept and principles of predicting long-term cyclic variations in the intensity of Atlantic water influx to northern seas and the associated (related to water temperature variations along the Kola meridian) fluctuations in cod stocks advanced by G.K. Izhevskij more than twenty years ago (1961). According to this author, the most pronounced waves of warm current intensity in our northern seas are those with periods of 4–5, 8–10 and 18–20 years. The maximum productivity effect is achieved in the case of superposition of all the three waves which were attributed by the author to tidal cycles.
Superposition of wave peaks (nearly complete) in 1949–50 resulted in large stocks of cod in 1954–55. In many cases, for example in 1935 and 1954, there was a superposition of two of the three waves. Numerous new data have been collected since the work of G.K. Izhevskij was published in 1961, and it would seem appropriate to test the validity of his conclusions using recent material.
First let us extend the series forming his 4–5 years wave. The minima of 1921, 1926, 1930, 1939 and 1944 are followed by those of 1949/50, 1954, 1959/60, 1964, 1969/70, 1975 and 1980. There are no substantial changes here, except that it may be more correct to speak of the 5–6 year wave. The next series of 1912, 1921, 1930, 1939 and 1949/50 will be extended to include 1959/60, 1970 and 1980. This is a striking quasi - 10 year cycle which tends to have peaks in the last years of the decades. The 18–20 year cycle years of 1903, 1921 and 1939 are followed by 1957 and 1975, i.e. practically all the intervals between wave peaks are equal to 18. The author in the late 1950's could hardly expect nature to be so punctual.
The data illustrated here indicate that as a result of superposition of the waves there were relatively favorable conditions for the formation of good year-classes in the early and mid-1970's, which is generally consistent with the known facts.
According to G.K. Izhevskij (1961, 1964) there is a fairly good agreement in the times of onset of maxima and minima in physical and biological processes, from where follows the basic possibility of conditional calculation of commercial fish stocks by summation of oceanographic indices for the birth years of year-classes on which the fishery is based.
By itself, the coincidence of the extrema does not on any account point to causal connection between, for example, an increase or a decrease in water temperature and the year-class strength of a certain biological species. Until their causality has been proved, these connections can only be regarded as structural (may be effects of a common cause, etc.).
In the discussion of this problem it seems to be important to draw attention to investigations dealing with detailed consideration of the dependence of early development of fish on environmental factors. It has been found, for example, that the survival of young Arcto-Norwegian cod and, consequently, the biomass and abundance of the year-class recruited to the fishery are dependent on the oceanological conditions during the early three years of life (Baranenkova and Kholina, 1967; Pnomarenko, 1970). This extremely important conclusion permits the use of Izhevskij's formula for calculating stocks from oceanographic indices (1961) with allowance for three years of early development. Below are given arbitrary stock indices for the Arcto-Norwegian cod calculated with the use as an oceanographic index of mean water temperatures along the Kola section. 1959 was chosen because this was the earliest year considered by G.K. Izhevskij.
Table 1.
| Year | Stock Index | Year | Stock Index |
|---|---|---|---|
| 1959 | 12.52 | 1971 | 10.15 |
| 1960 | 11.87 | 1972 | 11.00 |
| 1961 | 11.25 | 1973 | 11.50 |
| 1962 | 12.08 | 1974 | 11.42 |
| 1963 | 12.32 | 1975 | 11.76 |
| 1964 | 12.81 | 1976 | 11.99 |
| 1965 | 12.49 | 1977 | 12.41 |
| 1966 | 11.55 | 1978 | 12.77 |
| 1967 | 11.53 | 1979 | 12.50 |
| 1968 | 11.25 | 1980 | 12.04 |
| 1969 | 10.68 | 1981 | 10.67 |
| 1970 | 10.25 | 1982 | 9.50 |
It is easily seen that the stock index calculated from oceanographic indices is highest in 1964 and lowest in 1982, which is generally in agreement with available data. It would also be noted that in 1982 both the stock and the oceanographic indices are at the lowest level for the entire period of observations of water temperature and catch since 1921.
However, this is not the only interesting thing about the table. One can hardly fail to observe that there is also a certain periodicity in stock fluctuations, the maxima falling on 1959, 1964, 1973 and 1978 and the minima on 1961, 1971 and 1982.
The 4–5 year or the 10-year wave is thus manifested, depending on the contribution to the total value.
It therefore appears that long-term fluctuations in abiotic and biotic conditions follow a certain pattern which permits the onset of one or another extremum to be predicted, at least approximately. Formalization of forecasting on the basis of these regularities has so far been impossible, for there is no way of predicting the real contribution of different periodicity waves to the total value of the characteristics.
REFERENCES
Baranenkova, S.A. and N.S. Kholina. 1967. Chislennost' i drefj ikrinok, lichinok i sravnitel'nye dannye o vyzhivaemosti segoletkov (donnye stadii) pikshi Barentseva morya v 1959–63 gg. (Abundance and drift of eggs and larvae, and comparative data on the survival of the Barents Sea haddock underyearlings (bottom stages) in 1959–63). Tr. PINRO, v.XX, Pishchepromizdat, Moscow.
Elizarov, A.A. 1962. O mezhgodovykh kolebaniyakh intensivnosti Labrador-skogo i Zapadno- Grenlandskogo techenij i vozmozhnost' prognoza temperaturnykh uslovij v promyslovykh rajonakh Severo-Zapada Atlanticheskogo okeana. (On annual variations in the intensity of the Labrador and West Greenland Currents and the possibility of forecasting temperature conditions in the fishing areas of the Northwest Atlantic). Okeanologiya. No. 5:796–809.
Elizarov, A.A. 1974. O mnogoletnikh kolebaniyakh temperatury vody i promyslovoj produktivnosti v rajonakh Severnoj Atlantiki, Norvezhskogo i Barentseva morej. (On long-term water temperature variations and commercial fish production in the North Atlantic, Norwegian and Barents Sea areas). Tr. VNIRO. v. 98:7–22.
Elizarov, A.A. 1976. Dolgoperiodnye svyazi izmeneniya okenologicheskikh faktorov i urovnej bioproduketivnosti arkticheskikh bassejnov (na primere Severo-Zapadnoj Atlantiki). (Long- period relations of variations in oceanological factors and in the levels of bioproductivity of Arctic basins (with reference to the Northwest Atlantic)). Tr. VNIRO. v.112:16–22.
Izhevskij, G.K. 1961. Okeanologicheskie osnovy formirovaniya promyslovoj produktivnosti morej. (O c eanological principles as related to the fishery productivity of the seas). Pishchepromizdat, Moscow. 216 p.
Izhevskij, G.K. 1964. Sistemnaya osnova prognozirovaniya okeanologicheskikh uslovij i vosproizvodstva promyslovykh ryb. (System analysis as a basis for prediction of oceanological conditions and reproduction of commercial fish). Izd.MGU, Moscow. 165 p.
Pnomarenko, I.Ya. 1970. O vozmozhnosti dolgosrochnogo prognozirovaniya chislennosti promyslovogo stada i proizvoditel'nosti tralovogo promysla treski s terkhletnej zablagovremennost'yu. (On the possibility of long-range forecasting of commercial cod stock abundance and trawl fishery efficiency three years in advance). Materialy rybokhozyajstvennykh issledovanij Severnogo bassejna. No.16(1), Murmansk.
Por
J. LLeonart y B. Roel
Instituto de Investigaciones Pesqueras
de Barcelona, Paseo Nacional s/n
Barcelona 3
ESPAÑA
Resumen
Se ha diseñado un modelo de simulación que reproduce las diversas fases de la dinámica de una población de peces en explotación. El modelo se ha aplicado empleando los datos de capturas y parámetros poblacionales disponibles de la anchoveta peruana y la merluza sudafricana. Se han escogido estas dos especies por considerarlas representativas de medio pelágico y demersal respectivamente, y por constituir pesquerías que son o han sido muy importantes, por lo cual la información disponible es abundante. Las estrategias de estas dos especies son claramente distintas, y al hacer la comparación de estas dos poblaciones mediante el modelo de simulación se discuten brevemente estas diferencias.