![]()
![]()
![]()
by
Pierre Fréon
ORSTOM 24
rue Bayard 75000
Paris, France
Resumen
La plataforma continental del oeste de Africa entre los 11°N y 24°N repre- senta un área de pesca muy rica relacionada a afloramiento costero. En esta área se presentan dos poblaciones de sardinas (Sardinella aurita y Sardinella maderensis), cuyos adultos migran largas distancias dentro del área descrita. La explotación es intensiva y variada, pero debido a lo poco adecuado de las estadísticas de captura no es posible establecer modelos de producción para toda la población de cada especie.
Dos áreas principales de cría reciben importantes sub-stocks de individuos jóvenes, los que permanecen en dichas áreas hasta su primer desove. Una de las áreas de cría, localizada en la “Petite Côte” de Senegal, es explotada intensa- mente, disponiéndose de series de datos de captura y esfuerzo de pesca (de la pesquería semi-industrial y artesanal).
Se discuten dos hipótesis principales, una relacionada a la estabilidad de la tasa deexplotación fuera de “Petite Côte” y la otra, que se relaciona a parte del reclutamiento. Bajo estas dos hipótesis, cada sub-stock correspondiente puede ser considerado separadamente. Los datos colectados sugieren que los ren- dimientos de la pesca están relacionados con el esfuerzo de pesca local, y con la intensidad del viento responsable del afloramiento costero. La interpretación del efecto del afloramiento sobre los rendimientos se conoce todavía en forma incompleta: hay probablemente una adición a la fertilización del ambiente, y es probable que haya un aumento de la disponibilidad de sardinas asociadas al aumento de la productividad.
Se han establecido diferentes modelos de producción en base a análisis de regresión linear múltiple, incluyendo rendimiento de la pesca, esfuerzo e inten- sidad de vientos, tales como:
c.p.u.e. = a exp (a/f) + b + ε
+ ε
Donde c.p.u.e. es la captura por unidad de esfuerzo para el año (n), f es el esfuerzo de pesca durante el mismo año, V es la intensidad promedio de los vientos durante los años (n) y (n-1), a, b y c son constantes, y es el residuo. Las hipó- tesis preliminares son confirmadas indirectamente y se discuten los resultados obtenidos.
Bajo las condiciones presentes de explotación, el máximo rendimiento sostenible de Sardinella spp en la “Petite Côte” debe fluctuar entre 56 000 y 90 000 toneladas métricas por año. La actual tasa de explotación está próxima a su óptimo y se teme que una disminución de la intensidad del afloramiento (por ejemplo causada por la velocidad del viento), y/o un aumento del esfuerzo de pesca pueda afectar seriamente los stocks.
Sin embargo, los datos actuales no permiten una evaluación precisa de la produc- ción para condiciones extremas de intensidad de viento y esfuerzo de pesca mayores que los esfuerzos de pesca en las áreas costeras, a través de varios métodos:
- la extensión de las áreas de pesca que está actualmente limitada por el tipo de embarcación la localización de los lugares de desembarque,
- mantenimiento de un tipo de explotación flexible con la finalidad de poderlos ajustar rápidamente a las fluctuaciones de producción que pueden estar relacionados a la intensidad de los vientos, en relación a este último punto, la dualidad de la pesquería, artesanal y semi-industrial, tiene gran interés.
INTRODUCTION
The West African continental shelf, extended from 11°N to 24°N, represents a rich fishing ground related to coastal upwelling. Two populations of sardines (Sardinella aurita and Sardinella maderensis) are present, the adults of which migrate over long distances within the mentioned area. Exploitation is intensive and varied, but due to the inadequacy of fishing statistics it is not possible to establish production models for the entire population of each species.
Two principal nurseries receive important “sub-stocks” of young fish which remain present until their first spawning. One of the nurseries, located on the “Petite Côte” of Senegal, is intensively exploited and statistical catches and fishing effort series are available. The study of this nursery is the object of this paper.
SARDINE STOCKS AND SENEGALESE FISHERIES
The biology of the two sardine species has been studied by various authors. These references are available in Boely's synthesis (1980). Sardinella aurita constitute a single stock which can be subdivided in three “sub-stocks”: two important nurseries are observed, one in Mauritania and the other in Senegal on the Petite Côte (Figure 1). There young fishes remain present until their first spawning and then enter in the common sub-stock of migratory adults which moves over the continental shelf between 11°N and 24°N. These migrations occur over grounds generally deeper than 25 m in relation with the thermal front (Boely et al., 1978). So, adult fishes are available in Senegal only during 5 or 6 months per year, and mainly for long range fishing boats.
Sardinella maderensis nurseries localities are similar to Sardinella aurita (Figure 1) but here the young fish migrations are preponderant inside each nursery and generate local variations in availability. Opposed to the case of Sardinella aurita, the adult sub-stock has a low numerical importance, at least in Senegal, and it seems that exchanges between the two nurseries, if existing, are insignificant.
Senegalese fisheries are subdivided in two types: semi-industrial and artisanal. The first one is made up of a 25 m overall mean length, purse-seines fleet, already described in detail (Champagnat, 1966; Boely and Chabanne, 1975), for which the number of units has fluctuated between 10 and 20 during the last 15 years. The second one is characterized by the use of wooden canoes. This type is more diversified as it uses surrounding gill- nets, small purse-seines and beach-seines (Freon et al., 1979). The Senegalese fishery is exclusively a coastal activity. It is developed on Petite Côte where mainly young fishes are captured (Figure 2).
BASIC HYPOTHESIS
For Sardinella aurita the recruitment of young fishes in Senegal has two origins. First the main spawning of adults during the period of May and June on Petite Côte, and on the other hand, the secondary spawning of the young fishes themselves at the same locality during October and November before they leave their nursery (Conand, 1977). Although the relative importance of each spawning season has been calculated in terms of larval density, importance in terms of recruitment is still ignored due to the differences in larval and fry mortality between the two cohorts.
Anyway, it is clear that the exploitation ofSardinella aurita outside Petite Côte (adult sub-stock or Mauritanian nursery) could have consequences on its abundance only through a stock-recruitment relationship, namely the relation between adult sub-stock and the Petite Côte recruitment. The type of relationship is unknown and its precise knowledge is important from a theoretical point of view in order to forecast Petite Côte sub-stock reactions under strong abundance fluctuations of adults sub-stock.
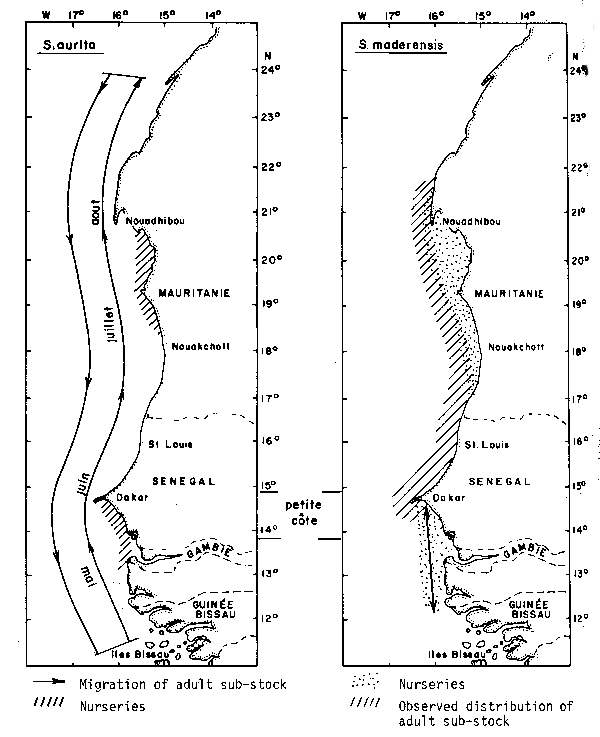
Fig. 1. Sardinella aurita and Sardinella maderensis distribution (mai = May; juin = June; juillet = July; aout = August). from Boely et al. (1978).
Harris' analysis (1975) has shown that both density-dependent and stock- dependent processes are needed to establish the basically dome-shaped curve, which appears to be characteristic of the stock-recruitment relationship within the fishes. Now, in the case of adult Sardinella aurita, it immigrates and does not stay on the spawning grounds, which could limit the stock-dependent mechanism mainly based on cannibalism. In practice, with any figure retained, it can be considered that the adult sub-stock abundance varies around a mean level. However, the variability of recruitment in the Petite Côte sub-stock related to this former sub-stock is not important, comparatively to variability due to other factors, particularly environmental ones. Indeed, abundance fluctuations in the adult sub-stock has been estimated through one index, i.e., catches per unit of effort (CPUE), of fish larger than 25 cm (Freon et al., 1979). During the observed period, annual variations were of one order of magnitude, except for 1975 where the index was strongly under-estimated on account of the target-species change. Curves obtained from other pelagic species (Cushing, 1978) show important variations in recruitment only from three to four orders of magnitude in stock abundance variations, over a critical level of stock size.
So, we have retained as a basic hypothesis that during the period studied, fishing outside Petite Côte did not have any impact on the abundance inside the Petite Côte nursery (Freon et al., 1979).
For Sardinella maderensis the situation is much more simple since recruitment on Petite Côte seems to be from spawnings by young fish only. In fact the latter leave the nursery from 24 cm of fork-length (probably 1.5 years old) and adults are found in abundance only in Mauritania and north of Senegal. So recruitment on Petite Côte is probably not related to their spawning.
Under this hypothesis it can be considered that CPUE in Petite Côte nursery depends essentially on local fishing effort and eventually on environmental conditions influencing on recruitment, young fishes growth and/or mortality.
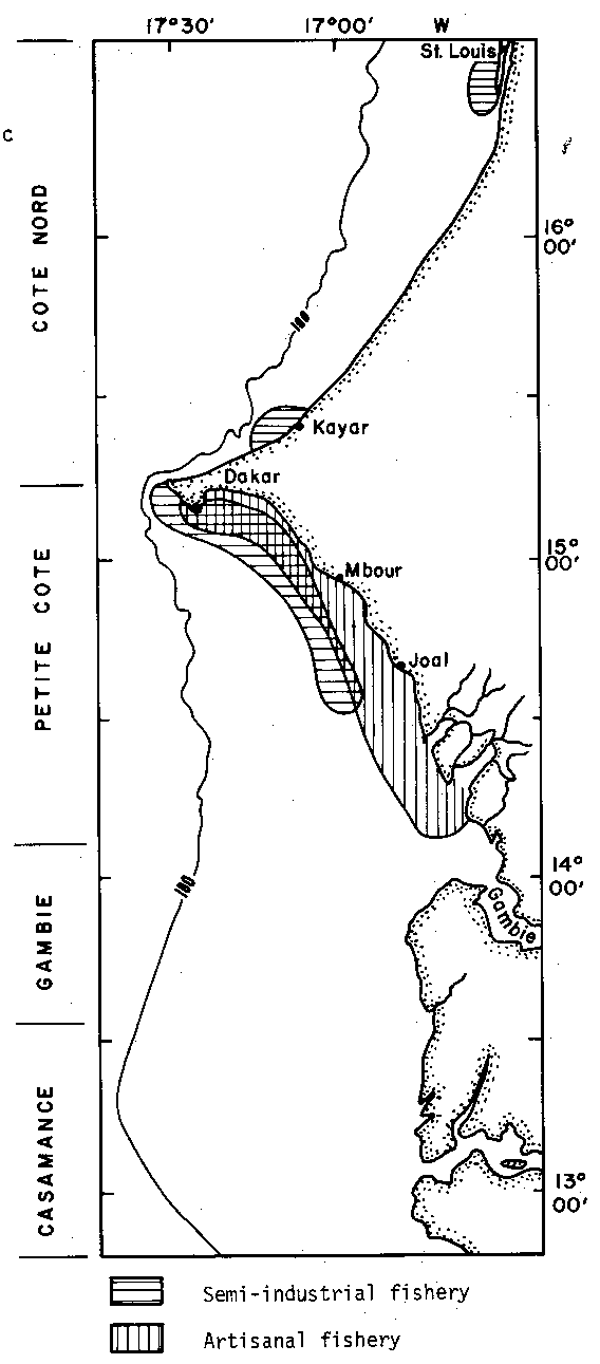
Fig. 2. Senegalese fisheries localization
| Years | Indust. Catches | Indust. C.P.U.E. | Indust. Efforts | Artis. Catches | Artis. Efforts | Total Catches | Total Efforts | Total C.P.U.E. | Wind Speed |
|---|---|---|---|---|---|---|---|---|---|
| 1966 | 4 250 | 13,54 | 314 | 3 970* | 293* | 8 220 | 607 | 13,54 | 4,93 |
| 1967 | 4 240 | 11,62 | 365 | 3 580* | 308* | 7 820 | 673 | 11,62 | 4,74 |
| 1968 | 7 060 | 12,70 | 556 | 4 110* | 324* | 11 180 | 880 | 12,70 | 4,53 |
| 1969 | 9 700 | 9,86 | 984 | 3 360* | 341* | 13 060 | 1325 | 9,86 | 4,40 |
| 1970 | 8 390 | 7,56 | 1 110 | 2 710* | 359* | 11 100 | 1469 | 7,56 | 4,32 |
| 1971 | 9 440 | 10,68 | 884 | 4 037* | 378* | 13 480 | 1262 | 10,68 | 4,70 |
| 1972 | 17 250 | 16,32 | 1 057 | 6 500 | 398 | 23 750 | 1455 | 16,32 | 5,63 |
| 1973 | 17 590 | 11,38 | 1 546 | 11 880* | 1044* | 29 470 | 2590 | 11,38 | 5,53 |
| 1974 | 17 790 | 9,78 | 1 819 | 16 530* | 1690* | 34 320 | 3509 | 9,78 | 5,76 |
| 1975 | 12 430 | 7,22 | 1 722 | 16 900* | 2337* | 29 330 | 4059 | 7,22 | 5,66 |
| 1976 | 14 800 | 8,06 | 1 836 | 24 050* | 2984* | 38 850 | 4820 | 8,06 | 5,79 |
| 1977 | 13 150 | 8,61 | 1 527 | 31 280 | 3630 | 44 430 | 5157 | 8,61 | 5,72 |
| 1978 | 12 660 | 9,15 | 1 384 | 32 280 | 3356 | 44 940 | 4740 | 9,48 | 5,21 |
| 1979 | 13 600 | 6,68 | 2 035 | 26 340 | 4577 | 39 940 | 6612 | 6,04 | 4,68 |
| 1980 | 14 860 | 7,01 | 2 120 | 28 620 | 3837 | 43 480 | 5957 | 7,29 | 4,98 |
* Parially estimated data
| Years | Indust. Catches | Indust. C.P.U.E. | Indust. Efforts | Artis. Catches | Artis. Efforts | Total Catches | Total Efforts | Total C.P.U.E. |
|---|---|---|---|---|---|---|---|---|
| 1966 | 6 450 | 20,3 | 318 | 22840* | 1125* | 29290 | 1443 | 20,3 |
| 1967 | 5 410 | 17,7 | 306 | 20 960* | 1 184* | 26 370 | 1 490 | 17, 7 |
| 1968 | 8 860 | 15,8 | 561 | 19690* | 1 246* | 28 550 | 1 808 | 15,8 |
| 1969 | 14 480 | 14,3 | 1 012 | 1 8760* | 1 312* | 3 3240 | 2 324 | 14,3 |
| 1970 | 12 640 | 11,3 | 1 117 | 15 610* | 1 381* | 2 8250 | 2 498 | 11,3 |
| 1971 | 11 480 | 13,2 | 870 | 19 190* | 1 454* | 30 670 | 2 324 | 13,2 |
| 1972 | 21 720 | 20,9 | 1 039 | 32 000 | 1 531 | 53 720 | 2 570 | 20,9 |
| 1973 | 26 200 | 16,3 | 1 608 | 33 740* | 2 070* | 5 9940 | 3 678 | 16,3 |
| 1974 | 27 770 | 15,9 | 1 747 | 41 480* | 2 609* | 69 250 | 4 356 | 15,9 |
| 1975 | 21 930 | 12,5 | 1 754 | 39 360* | 3 149* | 61 290 | 4 903 | 12,5 |
| 1976 | 26 730 | 14,7 | 1 818 | 54 210* | 3 688* | 80 940 | 5 506 | 14,7 |
| 1977 | 22 400 | 14,8 | 1 513 | 55 200 | 4 227 | 77 600 | 5 740 | 13,5 |
| 1978 | 17 970 | 12,7 | 1 415 | 58 430 | 3 767 | 76 400 | 5 182 | 14,7 |
| 1979 | 22 310 | 10,7 | 2 085 | 47 160 | 4 415 | 69 470 | 6 500 | 10,7 |
| 1980 | 23 800 | 11,7 | 2 034 | 46 440 | 4 319 | 70 240 | 6353 | 11,1 |
* Partially estimated data
AVAILABLE DATA
Detailed data on semi-industrial fisheries have been available since the beginning of exploitation (1961), but catches per unit of effort have been representative of abundance only since 1966. The previous period is considered as experimental (Boely and Chabanne, 1975). Fishing time (total time outside of port minus travelling time) was used as unit of effort (Freon, 1980). Considering the small size of the fishing area and the stability of the exploitation scheme, stratification by zone was not used. In return, unweighted mean of monthly CPUE was computed to get an annual index of abundance.
Artisanal fisheries data is much more incomplete for this very old activity. The first observations were done in 1972, then interrupted from 1973 to 1976 and again have been available since 1977. Estimations were obtained under the hypothesis supposing that semi-industrial CPUE fluctuations are representative of the artisanal ones. This hypothesis is based on similarity of fish length composition of the catches in both fisheries. This is confirmed by the analysis of the available data during the last years.
However, when realized for Sardinella maderensis the estimations lead to a global data table where the proportion of estimated catches and efforts is very high, specially before 1972 due to the predominance of gill-nets over artisanal purse-seine. Moreover, this species is not as sought after as Sardinella aurita by semi-industrial purse-seiners and consequently the derived abundance index can be biased by target-species changes. For this reason only two data sets were considered: one concerning Sardinella aurita and the other regrouping the two species of Sardinella and named now: Sardinella spp. (Tables 1 and 2). The latter presents the advantage of minimizing target-species change without differing too much from the basic hypothesis relative to production models because the two species have the same biotope.
Anyway, usual reserves must be done about the representativity of CPUE as abundance index, specially on an eventual change of the catchability coefficient related to abundance (Ulltang, 1976; Freon, 1980; Saville, 1980).
MODELLING SARDINE PRODUCTION
Apparent relations between CPUE, fishing effort, and wind intensity
The figure obtained from the 1966-1980 data for Sardinella aurita and Sardinella spp. show a negative correlation between CPUE and fishing effort, but the adjustment is very poor when applied to the whole period. In return, when data is subdivided in two periods, separated by January 1st, two decreasing lines (or curves) of regression clearly appear (Figures 3 and 4). This suggests the influence of a second factor on CPUE which strongly changed in 1972.
Both sardine species belong to the first level of the trophic web because they eat phytoplankton during their first stages of life and afterwards they will consume zoo- plankton. On Petite Côte, eutrophication is assumed by a coastal upwelling (Rossignol, 1973) which is probably responsible for the variations in primary production as shown by various authors, of whom Sedykh et al. (1978) in Mauritania. A time plot during the trade winds season (November to May) shows low values of mean wind intensity (expressed in speed) from 1966 to 1971 and high values thereafter, with an exception in 1979 (Figure 5).
On account of an autocorrelation observed in the seasonal wind speed with one year lag (r=8.57) it is difficult to know if the abundance in one year is related only to wind speed during the same year or also during the previous year. The latter case can be supposed because most of the fish caught are between 1 and 1.5 years old. We will see that statistical analysis is of little utility for solving this problem with the available data.
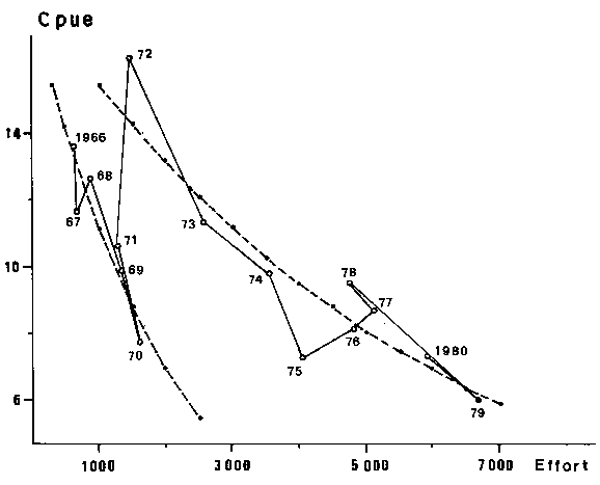
Fig. 3. Sardinella aurita; apparent relationship between fishing effort and catches per unit of effort (c.p.u.e) in the Petite Côte from 1966 to 1980.
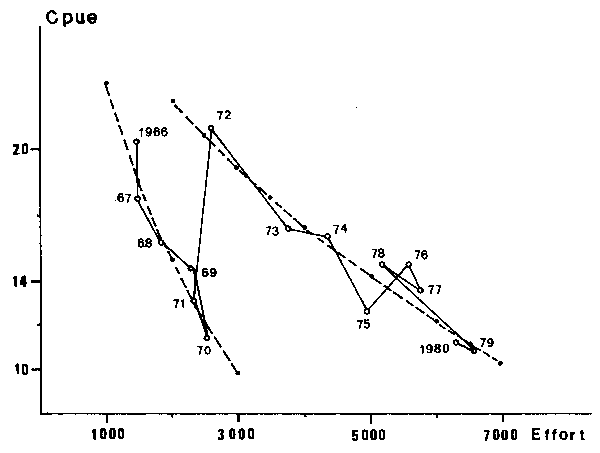
Fig. 4. Sardinella spp.; apparent relationship between fishing effort and catches per unit of effort (c.p.u.e) in the Petite Côte from 1966 to 1980.
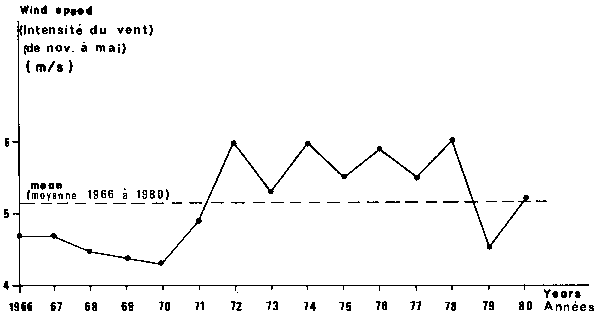
Fig. 5. Time plot of trade wind intensity (from November of year n-1 to May of year n) from 1966 to 1980.
Modelling
Let us suppose that mean CPUE observed during one year would be dependant, first, on fishing effort during the same year, second on mean wind intensity during the trade wind season of the same year and of the previous one. Various multiple - regressions between the three variables were tried, based on different hypothesis about the possible relationship between each variable.
The linear relation between CPUE and effort (Schaefer, 1957) was not used because it supposes that over a certain limit of effort, the CPUE can reach zero, which is in contradiction with our hypothesis for Sardinella aurita which states that part of the recruitment is independant of the exploitation on Petite Côte. So, this model seems too pessimistic and we have retained the negative exponential model (Fox, 1970), where the increase of effort assures a more progressive decline in yields. Supposing a linear relation (discussed later) between wind intensity and yield, we combined the following equations:
log CPUE =_a1 + f + b1 + r1 (1)
CPUE = a2 V + b2 + r2 (2)
where CPUE is the catch per unit of effort during the year n; f is the fishing effort
during the same year; is the mean speed of trade winds (various combinations between
season of year n and n-1 were used); a, b, c are parameters obtained by adjustment,
and r is the residual. From (1) and (2) we obtain:
CPUE = a EXP-á-f + b + c + r (3)
Fitting the observed values to the theoretical curve must be done by iterative computation. The data was processed first with a hand calculator using a multiple linear regression, with EXP-áf considered as a variable, and searching the value of á which minimizes the multi-coefficient of correlation. Then the data was processed on a desk computer using Marquardt's algorithms (1963). In both cases the results showed that introduction of year n-l wind speed did not improve very much the fit for Sardinella aurita, but was of some interest when used for Sardinella spp. model. The best fit was obtained with the following weighted mean:
=(2Vn+Vn-1)/3 (4)
Anyway, this does not mean that equation (4) represents the real influence of wind on production. In the same way, iterative computations show that fit does not change very much according to á. However, this parameter value is strongly related to the curve shape over the observed effort values. The optimal value of á from a statistical point of view has no biological meaning. This is so when applied to relationship (derived from equation (3)) between catches (C), fishing effort and wind speed, it provides a figure where catches lead to infinite when effort increase under a constant wind speed:
c =(a EXP-á-f + b + c) f + ŕ (5)
Being one of the main problems of generalized production models, the non-independence between the two variables CPUE and effort (Sissenwine, 1978; Roff and Fairbairn, 1980), we have applied equation (5) for data fitting, using the non-linear regression analysis. This presents the advantage of allowing computation of the parameters confidence limits. None was significant, even with a 90% confidence interval, on account of, first the high number of parameters (4) in comparison with the low number of observations (15). Second, the uncertainty about the á value previously mentioned. Nevertheless, it is satisfactory to note that when á is fixed at its optimal value in equation (5), the non-linear regression provides for the three remaining parameters (a, b, and c) values which are significantly different from zero using the 95% confident intervals. This means that fishing effort and wind speed statistically have an influence on catches, although the shape of the curve is uncertain over observed effort values.
The problem with the á parameter shows that the best statistical fit is not necessarily the most suitable and that the choice of parameters values must also consider the basic hypothesis especially when the stock has not already suffered over-fishing (this problem can be compared with the choice of parameter m in Fox's generalized produc- tion model (1975)).
SARDINELLA AURITA
| Regression type and equation | Par. | Value | Lower limit | Upper limit | % confid. |
|---|---|---|---|---|---|
| a | 14.60 | 9.00* | 20.2* | 95% | |
| LINEAR | á | .00013 B | - | - | - |
| cpue = a EXP-áf + bV | b | 2.49 | .609 | 4.37 | 95% |
| +c+r (1) | c | -12.89 | -24.85* | -.935* | 95% |
| a | 11.75 | 5.31 | 18.21 | 95% | |
| NONLINEAR | á | .00013B | - | - | - |
| C = (a EXP-áf + bV + | b | .911 | -.534 | 2.36 | 95% |
| c) f + r | c | -2.946 | -10.14 | 4.254 | 95% |
| a | 9.42 | 2.23 | 16.61 | 90% | |
| NONLINEAR | á | .00024 M | -.0007 | .0011 | 90% |
| C = (a EXP-áf +bV + | b | 1.16 | -1.11 | 3.44 | 90% |
| c) f + r | c | -1.01 | -8.10 | 6.00 | 90% |
SARDINELLA SPP.
| a | 23.55 | 16.70 | 30.40 | 90% | |
| LINEAR | á | .00010 B | - | - | - |
| cpue = a EXP-áf + bV | b | 4.13 | 2.55* | 5.72* | 90% |
| + c + r (1) | c | -22.63 | -33.91* | -11.36* | 90% |
| a | 14.63 | 2.58 | 26.67 | 90% | |
| NONLINEAR | á | .00035 M | -.0004 | .0001 | 90% |
| C = (a EXP-áf + bV + | b | 3.230 | 1.428 | 5.033 | 90% |
| c) f + r | c | -6.271 | -13.88 | 1.342 | 90% |
| a | 19.86 | 10.51 | 29.21 | 95% | |
| NONLINEAR | á | .00010 B | - | - | - |
| C = (a EXP-áf + bV + | b | 3.84 | .849 | 6.83 | 95% |
| dW + c) f + r | c | -12.44 | -22.79 | -2.098 | 95% |
| d | -1.646 | -5.597 | 2.306 | 95% |
B: Optimal biological value of á (fixed before computation)
M: Optimal statistical value of á (determined by the regression) on the figures
W: Wind speed during the summer (from June to October)
*: No strictly valid limits (due to the correlation between cpue and f)
Arbitrarily, we considered as best value for á one which provided a stabilization of catches when the effort increases, inside a realistic interval, and when wind speed is high and stable (Table 3).
Equations (3) and (5) lead to tridimensional figures (Figure 6). We also present two dimensional figures, easier to use, from which four curves have been drawn correspon- ding to characteristic wind speeds: 4.55 and 5.55 m/s which are the two means of the respective two observed periods (1966–1971 and 1972–1980), 4.0 and 6.0 the extreme mean speed which have been observed since 1951 (Figure 7). Time-plots of observed and computed values have also been presented (Figures 8 and 9).
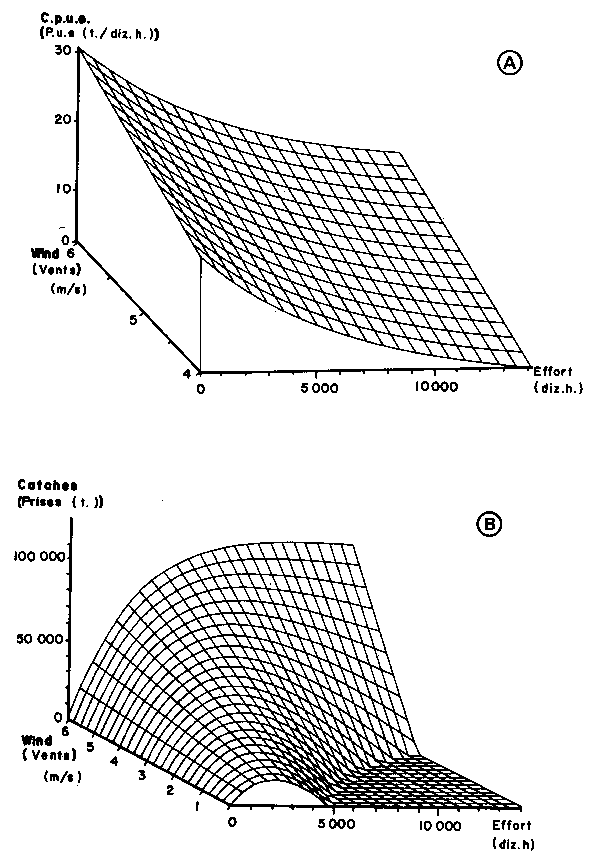
Fig. 6. Tridimensional graphics of the relationship between fishing effort, wind speed and catch per unit of effort (c.p.u.e.) in figure 6A or total catches (C) in figure 6B of Sardinella aurita on the Petite Côte. Sardinella spp. figures present the same shape and are not included in this paper.
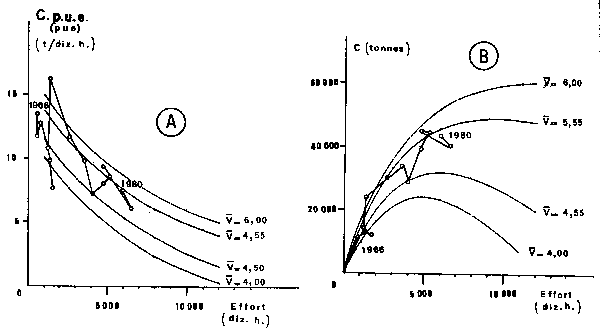
Fig. 7. Two dimentional graphics of the relationship between fishing effort selected wind speeds and catch per units of effort (c.p.u.e) in figure 7A) or total catches (C in figure 7B) of Sardonella aurita on the Petite Côte. Sardinella spp. figures present the same shape and are not included in this paper.
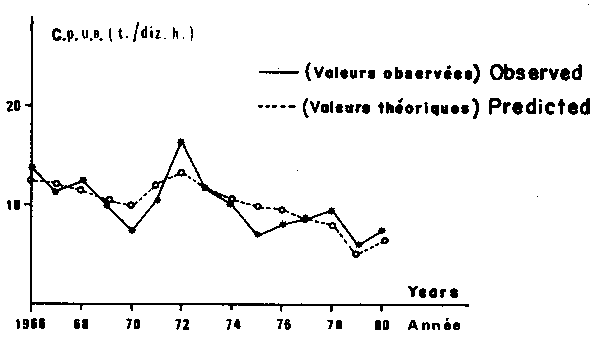
Fig. 8. Sardinella aruita: comparison between observed and predicted values of catch per unit of effort (c.p.u.e.) on the Petite Cô.
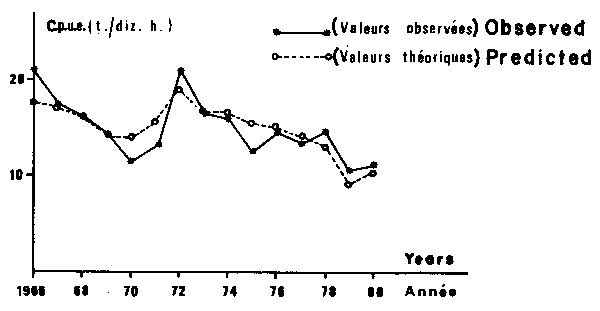
Fig. 9. Sardinella spp.: comparision between observed and predicted valules of catch per unit of effort (c.p.u.e.) on the Petite Cô.
INTERPRETATION OF THE RESULTS
The considered parameters provide a satisfactory fit for the observed points as a whole to the theoretical curve. Anyway, for some years the residuals have not been negligible for both models (although they never exceded two standard deviations). Two main reasons could explain this fact. First, the precision of data, partially estimated is probably not very good and therefore responsible for a certain amount of the observed variability. Second, obviously fishing effort and wind speed are not the only factors influencing CPUE, and some part of the residual variance comes from numerous other variables.
Among these reasons, some could be in contradiction with our basic hypothesis (relation between adult sub-stock; immigration from other sub-stocks, etc…). These will be further analysed. Other sources of variation could take place at the level of recruitment fluctuations, independently of eutrophication and of parental stock. Thus, recent works (IOC No. 28) suggest that the superficial wind-related turbulence could cause a negative effect on larval survival. We added in the models the mean wind speed during the period following the main spawning (June to October). This improved slightly the fit for the Sardinella spp. model showing a negative corresponding regression coefficient (Table 3), but its value was not significantly different from zero even using a 90% confidence interval when calculated with the previously presented method. However, this result is notable because this relationship could be minimized by the positive correlation between the wind speeds during the two described periods of the year.
In the same way, it is evidence that the wind has a negative instantaneous influence on capturability related to school detection and working with purse-seines on rough seas. However, it seems that the favourable effect is dominant here, at least on CPUE expressed in catch per effective fishing time. Last of all, in order to close this non exhaustive list of additional factors, we looked at the influence of other species, considering the multi-specific aspect of the fisheries. This allows predator-prey relationships, but above all in our case, target-species changes related to the relative abundance and to market conditions are also allowed (Boely and Chabanne, 1975). In fact, a study was done (Freon, in press) which shows that during the last years the fishermen balanced their fishing activities in response to the sardine abundance fluctuations by searching for secondary species.
TESTING THE BASIC HYPOTHESIS AND MODEL REVIEW
Testing the hypothesis on the Petite Côte sub-stock independance
Comparison of the fishing effort variations on Petite Côte with the effort on the whole area of the stock distribution indicates a lack of correlation which provides an insurance against a possible confusion between the two variable effects. Moreover, it appears clearly that during the period studied the important fluctuations observed in CPUE on Petite Côte are not explained by changes of the fishing effort within the whole area. The best CPUE obtained by semi-industrial purse-seiners on Petite Côte occurred at the same time with maximum fishing effort on the whole area.
In more details, in the south of Senegal (Casamance, neighbouring Petite Côte), fishing effort was insignificant from 1973 to 1976. From 1977 to 1980 Polish pelagic trawlers got licences and caught up to 70,000 metric tons per year without any sensible effect on yields from the Petite Côte.
These observations do not mean that independance of recruitment in regard to the adult sub-stock will remain true in the future. It is evident that above a certain level of exploitation on the whole stock, the spawners biomass would be too small to assume equilibrium and a collapse could happen unexpectedly, as observed in other small pelagic stocks (Saville, 1980).
Based on the biological references concerning Sardinella aurita, two opposed and extreme theoretical cases could be considered. Obviously, the adult sub-stock abundance depends, on a short-termed basis, on its exploitation in the whole area, and on mean-terms on the exploitation of the two nursery sub-stocks which provide its recruitment. The same reasoning can be applied to the Petite Côte recruitment if its main contents would be provided by the adult sub-stock, particularly if the stock-recruitment relationship would be dome-shaped. Under these conditions our model would require stabile fishing effort and absence of over-fishing outside of the described Petite Côte area. This would provide a relatively stable recruitment (having a stable wind intensity) and an important resistance to local over-fishing in Petite Côte.
The second theoretical case supposes that the spawning of the young spawners in the Petite Côte nursery would assume the greatest part of the nursery recruitment. Although not being very realistic, this hypothesis would allow us to consider this stock fraction as completely independant from the other ones regarding its abundance. The situation would be similar to a single stock with a short-life species affording infinite mortality (total emigration) during the second year of life. Under these conditions the sub-stock would be very dependant on fishing effort on Petite Côte, also because an important proportion of the catches are supported by immature fishes. This case would probably justify the use of a linear regression between CPUE and fishing effort, whereas in the former case, a negative exponential regression corresponding to a low production sen- sitiveness to fishing effort (type m=8.5 in the Fox's generalized production model (1975)) would be suitable.
Reality is probably within these two extremes, since a quasi-constant recruitment is observed all year long on Petite Côte. This fact lets us suppose that adult and young fish spawning provide significant recruitment. Finally, Sardinella aurita stock, thanks to its three components distributed in different countries, probably presents a certain resistance to local over-fishing, and complex regulation mechanisms must exist. So the established model for this species seems tolerant enough in regard to the basic hypothesis concerning the stability of the exploitation rate around Petite Côte. However, the stock never supported heavy exploitation on its three sub-stocks at the same time due to the random distribution of fishing licences between coastal and foreign countries. If this situation should occur then our present knowledge would not allow a forecast of yield. Nevertheless, a collapse must be feared.
Sardinella maderensis sub-stock of Petite Côte (which was not studied individually) presents distinct characteristics since we are almost sure that the adult sub-stock does not spawn in this nursery. Associating both species of sardine in a single production model allows us to be more independent of the main basic hypothesis. In return the Sardinella maderensis sub-stock offers more sensitivity to local over-fishing.
It should be pointed out that for both species the coastal Petite Côte area is not the perfect nursery where all sardines from the Senegalese region are growing. There are obviously some exchanges of young fishes with the adjacent areas.
Testing hypothesis concerning the wind intensity effect on production
It is essentially the important increase of CPUE between 1970 and 1972 which lead me to include the wind speed variable in the production models. It could be supposed that this increment represents no more than the natural variability expression, indepen- dently from the upwelling, or also that the increase originated from a data bias as a change of fishing power. This last event was tested, computing separately the annual CPUE of three vessels which have been working since the early years, always with the same kind of equipment. The figures obtained from these three boats are very similar and correspond exactly to the global data figure. Moreover, it is important to notice that during the year 1972 other anomalies occurred in various eastern Atlantic areas. Sardina pilchardus concentrations appearance in Mauritania (Sedykh et al., 1978; Freon and Stequert, 1979), a demographic bloom of Sardinella aurita occurred both in the Ivory Coast and in Ghana followed up by a Balistes carolinensis bloom (ORSTOM, 1976; FAO, 1980).
The data suggest a linear relationship between CPUE and wind speed. However, various fitting trials with other types of relationships (logarithmic, square, etc…) provide very similar results and it is not obvious that outside the observed range of variation the relation should remain linear. This forces one to use carefully forecasts for extreme wind speed (greater than 6 m/s or lower than 4.5 m/s).
Furthermore, it could be considered that the explicative variable is not the wind intensity and the corresponding upwelling but another correlated factor, i.e., surface temperature. Similar models to those presented were tried, replacing wind speed by surface temperature. They provided analogous results. The fundamental question is now to know if CPUE increase was provided only by the environmentally induced fertilization or also by a certain increase of the sardine availability. The statistical analyses, although difficult to interpret, showed the apparent predominance of the wind speed during the year n (comparatively to year n-1) on CPUE. This suggests a direct influence of wind on sardine availability. Even though, an indirect lag action remains possible because, first, the year n season of trade winds is considered between November of year n-1 and May of year n, second the fish caught is often less than one year old. Rebert (1979) studied monthly variations of sardine productivity in relation with wind anomalies and did not find small scale relations. Anyway the possibility of a combined action of the wind speed (on productivity and on availability) at the year scale is not easy to eliminate. In such a case the expression “production model” should be replaced by “CPUE model” or “catch model”.
APPLICATIONS TO SUB-STOCK MANAGEMENT
The previous analysis attempted to prove that the maximum sustainable catch (which
is perhaps not exactly comparable to a maximum sustainable yield, MSY) depends on wind
intensity. For variations between 4.50 and 5.55 m/s we get the following maximum
catches:
Sardinella aurita: 31,000 to 49,000 metric tons
Sardinella spp: 56,000 to 90,000 metric tons
Anyway, it must be pointed out that these results are strongly related to á parameter values, which were arbitrarily defined. They are in the same range of maximum catches obtained by using a multiple-linear relationship between effort, wind speed and CPUE, i.e., a family of Schaefer's model (1957). However, they turn out to be only indicative. Never- theless, the models allow a look at three main eventualities, from the present situation.
(i) If wind intensity remains constant, any increase of fishing effort would not change the total catches but would reduce the CPUE.
(ii) If wind intensity increases (which seems hardly likely), CPUE and catches would increase, the exploitation rate (f/fMSY) would decline and profits will rise, even if the fishing effort slightly increases.
(iii) If wind intensity lowers significantly, then CPUE, and yield would decrease, meanwhile f/fMSY would increase without any f variation, from which a strong overfishing hazard may be produced.
Finally, it seems that fishing effort on Petite Côte has reached a critical level in biological terms, according to present environmental conditions. On the other hand, economical studies pointed out that artisanal fishermen using purse-seine (which assumes most of the catches) have very low profits due to existing commercial conditions. In spite of this situation, the number of fishing canoes shows a tendency to increase because the traditional distribution of gains privileges the owners of production materials and so, favours the increase in fishing units (Weber and Freon, in press). In consequence, artisanal fishing effort does not have a self-regulation mechanism and a new intensifica- tion of fishing effort on Petite Côte should be feared if wind intensity would decrease. This would lead to the catastrophic case where overfishing is likely. Moreover, the appearance in 1981 of a new tendency toward catching very small fish is also alarming.
It appears imperative to develop management decisions in order to limit the fishing effort growth on Petite Côte which could be done through a limitation of subsidies given for buying equipment and motor-fuel. The modification of traditional habits which favour the owner-minority seems difficult to realize. A more realistic solution lays in extension of the fishing grounds which are presently limited by the boat equipment and by the localization of landing sites. The Senegalese artisanal fishery, even enclosed in its social habits, is very open to technology innovations as demonstrated a few years ago by the successful introduction of outboard engines and afterwards by small purse-seines. In fact other areas of the Senegalese shelf are also very productive all year long (Casamance), or otherwise seasonal (north coast), but the absence of landing points and of commer- cialisation channels limits their full exploitation. Then it would be desirable to first, increase the range of canoes (diesel engines, fish preservation); second, improve fish distribution inside the country; third, renovate the old semi-industrial fleet; and fourth, provide small ports adapted to those boats.
On account of the important variability of the maximum catches related to environmental conditions, it is desirable to maintain flexible types of exploitation in order to allow quick adjustments to production fluctuations. So, the duality of the fishery (artisanal and semi-industrial) is of main interest.
Finally, it must be kept in mind that our models are based on a hypothesis which will not remain indefinitely true. The relative independance of the Petite Côte nursery will remain effective as long as the peripheral areas will not support overfishing. Otherwise, it would be inevitable that at a certain level the relationship between the adult sub-stock abundance and the Petite Côte recruitment will have a depressive effect on the latter. This situation will make obsolete our relatively optimistic models. Senegalese fishery management must be decided in concert with that of adjacent countries.
CONCLUSION
Modelling the whole sardine stock of the described West Africa area seems difficult presently due to the complexity of the population structure and to the data inadequacy in the Senegal adjacent countries. Anyway, under a certain hypothesis, it appears possible to establish production models for the Petite Côte sub-stock which is intensively exploited.
The model parameters obtained provide a satisfactory description of the fisheries evolution during the last 15 years which was mainly related to the fishing effort and to the upwelling intensity variations. However, the validity of the available data and the relative shortness of the observed period induce us to use only with care these models for forecasting purposes.
Presently, the sub-stock yield seems to be close to the maximum catch corresponding to the present wind intensity which is relatively high. In this situation, any fishing effort increase is unproductive and the only effect is a CPUE decrease. If wind intensity will decrease, the production would lower substantially, specially for sardine species. Of course, a wind intensity increase would be beneficial and would allow an effort increase without an overfishing hazard. Although it is difficult to forecast the wind speed, the available data from 1951 seems to indicate that this eventuality is more unlikely than the former one (Figure 10).
Fishery management actions should attempt to limit the present proliferation of fishing units on Petite Côte, especially artisanal ones. This objective can be reached on short term by enlarging the fishery area in latitude and toward the open sea. And finally, Senegalese management must be conducted in collaboration with adjacent countries. Only two of the three greatest dangers of collapse appears in the model equation (Petite Côte fishing effort and wind intensity). The last one, but not the least, is unfortunately hidden in our basic hypothesis (absence of overfishing in the adjacent areas).
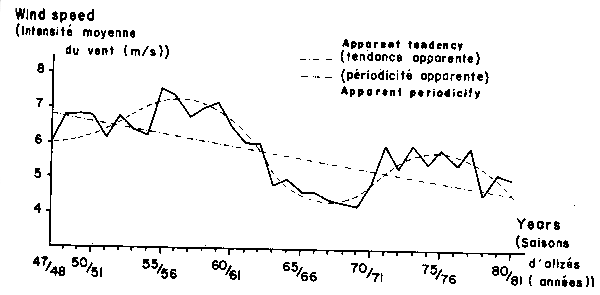
Fig. 10. Time plot of trade wind speed (meters per second) from 1947–1948 to 1980–1981 (data provided by ASECNA of Senegal and complied by C. Teisson).
REFERENCES
Boely, T. 1980. Biologie des deux espèces de sardinelles (Sardinella aurita Valenciennes 1847 et Sardinella maderensis Lowe 1841) des côtes sénégalaises. Thèse Doc. d'état, Université de Paris VI:286 p.
Boely, T., and J. Chabanne. 1975. Les poissons pélagiques côtiers au Sénégal. La pêche sardinière à Dakar: état actuel et perspectives. Bull.IFAN. 37(Sér.A4):859–886.
Boely, T., J. Chabanne, P. Freon and B. Stequert. 1978. Cycle sexuel et migrations de Sardinella aurita sur le plateau continental ouest-africain, des îles Bissagos à la Mauritanie. Document présenté au CIEM/COI/FAO, Symposium sur le courant des Canaris: upwelling et ressources vivantes, Las Palmas, Espagne, 11–14 avril 1978. Commun. 92:12 p.
Boely, T., P. Freon and B. Stequert. 1982. La croissance de Sardinella aurita (Val. 1847) au Sénégal. Océanogr.trop. 17(2):103–119.
Champagnat, C. 1966. Indice relatif d'abondance saisonnières des Sardinelles de la Petite Côte du Sénégal. Doc.Scient.Provis.Centre Rech.Océanogr.Dakar-Thiaroye. (1):5 p.
Conand, F. 1977. Oeufs et larves de la sardinelle ronde (Sardinella aurita) au Sénégal: distribution, croissance, mortalité, variations d'abondance de 1971 à 1976. Cah.ORSTOM, ser.océanogr. 15(3):201–214.
Cushing, D.H. 1978. The problems of stock and recruitment. In Fish population dynamics (J.A. Gulland, ed.). John Wiley and Sons Ltd. 372 p.
FAO. 1980. Rapport du groupe de travail ad hoc sur les sardinelles de Côte d'Ivoire-Ghana-Togo. Tema, Ghana 2–7 Juillet 1979. Abidjan, Côte d'Ivoire 24–28 September 1979. COPACE/PACE Sér. (80/21) (Fa):73 p.
Freon, P. 1980. Choix d'une unité d'effort pour les flottilles sardinières semi-industrielles et artisanale du Sénégal. Doc.Scient.Centre Rech.Oceanogr.Abidjan. 11(1):1–35.
Freon, P. (In press). Des modèles de production appliqués à des fractions de stock dependantes des vents d'upwelling. Doc.Scient.Centre Rech.Océanogr.Dakar-Thiaroye.
Freon, P. and B. Stequert. 1979. Note sur la présence de Sardina pilchardus (Walb.) au Sénégal. Etude de la biométrie et interprétation. Cybium (3°Sér.). (6):65–90.
Freon, P., T. Boely and B. Stequert. 1979. Les pêches sénégalaises: description et analyse des captures et des rendements des principales espèces pélagiques côtières. In Rapport du groupe de travail ad hoc sur les poissons pélagiques côtiers ouest-africains de la Mauritanie au Libéria (26°N à 5°N). Dakar, Sénégal, 19–24 Juin 1978. COPACE/PACE Sér. (78/10):27–62.
Fox, W. 1970. An experimental surplus-yield model for optimizing exploited fish populations. Trans.Am.Fish.Soc. 99(1):80–89.
Fox, W. 1975. Fitting the generalized stock production model by least-squares and equili- brium approximation. Fish.Bull.NOAA/NMFS. 73(1):23–36.
Harris, J.G.K. 1975. The effect of density-dependant mortality on the shape of the stock- recruitment curve. J.Cons.Int.Explor.Mer 36(2):150–157.
IOC. 1981. Workshop on the effects of environmental variations on the survival of larval pelagic fishes, Lima, 20 April–5 May 1980. IOC Workshop Report No.28. IOC/UNESCO, Paris. 323 p.
Marquardt, D. 1963. An algorithm for least square estimation of nonlinear parameters. J.Soc.Indust. and Appl.Math. 11(2):15–34.
ORSTOM. 1976. Rapport de groupe de travail sur la sardinelle (S. aurita) des côtes ivoireo- ghanéennes. Abidjan, ORSTOM, Centre de recherches océanographiques, 28 Juin-3 Juillet 1976:63 p.
Rebert, J.P. 1979. Un essai d'interprétation de l'influence des conditions de milieu sur les rende- ments de la pêches industrielle dakaroise de Sardinella aurita. In Rapport du groupe de travail ad hoc sur les poissons pélagiques côtiers ouest-africains de la Mauritanie au Libéria (26° à 5°N). Dakar, Sénégal, 19–24 Juin 1978. COPACE/PACE Sér. (78/10):105–108.
Roff, D.A. and D.J. Fairbairn. 1980. An evaluation of Gulland's method for fitting the Schaefer model. Can.J.Fish.Aquat.Sci. 37:1229–1235.
Rossignol, M. 1973. Contribution à l'étude du complexe guinéen. ORSTOM:142 p.
Saville, A. 1980. The assessment and management of pelagic fish stocks. A symposium held in Aberdeen 3–7 July 1978. Rapp.P.-v.Réun.Cons.Int.Mer. 177:517 p.
Schaefer, W.J. 1957. A study of the dynamics of the fishery for yellowfin tuna in the eastern tropical Pacific Ocean. Bull.IATTC. 2(6):85–245.
Sedykh, K.A. et al. 1978. Etude de l'upwelling près de la côte de l'Afrique nord-occidentale par l'Institut Atlantique de Recherches Scientifiques de l'Industrie de la Pêche et de l'Océanographie. In Rapport du groupe de travail ad hoc sur les poissons pélagiques côtiers ouest-africains de la Mauritanie au Libéria (25°N à 5°N). Dakar, Sénégal, 19–24 Juin 1978. COPACE/PACE Sér. (78/10):98–104.
Sissenwine, M.P. 1978. Is MSY an adequate foundation for optimum yield? Fisheries. 3(6):22–24 and 37–42.
Ulltang, . 1976. Catch per unit of effort in the Norwegian purse seine fishery for atlanto-scandian (Norwegian spring spawning) herring. FAO Fish.Tech.Pap. (155):91–101.
Weber, J. and P. Freon. (In press). Djifère au Sénégal: la pêche artisanale en mutation dans un contexte industriel. 2° partie: Conséquences d'une innovation technique sur l'organisation économique artisanale, ou les excès d'une réussite. Doc.Scient.Centre Rech. Océanogr.Dakar- Thiaroye.
by
Tsuyoshi Kawasaki
Faculty of Agriculture
Tohoku University
1–1 Amamiya-cho
Tsutsumi-dori
Sendai-shi 980
Japan
Resumen
Los patrones de fluctuación en número de individuos varían de una espe- cie (sub-población) a otra, los que han sido seleccionados a través del pro- ceso de evolución. En el caso de teleósteos marinos se presentan tres tipos extremos de patrones de fluctuación, IA, IB y II, representados respectiva- mente por saury y amodites, arenque y sardina, atunes y peces planos. Una relación entre estos tres tipos puede ser expresada por un triángulo con di- mensiones de longevidad, fecundidad y tasa de crecimiento.
El tipo IA, muestra cambios espaciados de breve tiempo, es una especie de vida corta, tiene una fecundidad baja, y el producto de k (parámetro de crecimiento de la ecuación de Bertalanffy) y T (tiempo generación) es bajo, lo que hace que la tasa instantánea de incremento natural de la población (r) sea alta, mientras que el tipo IB, se caracteriza por mostrar variaciones fenómenales de largo tiempo, son especies de vida larga, menos fecundas y el producto de kT es alto, y además acumulan una gran cantidad de peces cuando se presenta una sucesion de clases anuales fuertes a pesar de una r baja. El tipo II tiene una biomasa estable, son de vida larga, son más fecundos y el producto de kT. es bajo así como r. El patrón de fluctuación específico para esta especie depende mucho de las condiciones ambientales bióticas y abióticas en que se desarrolla la especie.
Las características de la ecología y el ambiente en que se desarrolla cada especie o su población tienen que ser tomadas en cuenta al momento de introducir medidas de ordenación de la pesquería. Se proponen medidas de ordenación para peces pelágicos y se hace una crítica de los modelos dependien- tes de la densidad en uso actualmente.
Los peces que se alimentan de plancton estan situados mucho más cerca a la fuente de energía solar, y por lo tanto parecen ser afectados fuertemente por los cambios del clima a través de los cambios océanicos. Esta observación puede ser válida en particular para sardinas, las que son casi exclusivamente herbívoras. El problema es que mientras en algunos años utilizan el fitoplánc- ton en forma eficiente, lo que da por resultado stocks muy grandes, en otros años no utilizan el fitopláncton tan eficientemente y se producen reducciones en su biomasa.
Aparentemente el patrón de vida de las sardinas cambia. Si las condicio- nes ambientales son favorables, las sardinas aumentan en número adoptando un modo de vida que les permite mantener su población a un nivel máximo posible. Por el contrario, si las condiciones ambientales de la sardina son adversas y su nicho ecológico se contrae, estas se preparan para el siguiente período de prósperidad asumiendo un estilo de vida en el cual se regula el crecimiento de la población.
INTRODUCTION
It has been well known that clupeoid fishes, especially the herrings and sardines, have phenomenal fluctuations in catch, viz. stock size. From of old, a variety of controversies have been held around the cause of such fluctuations and above all a dispute about the Californian sardine distributed off western North America is characteristic.
Stock size of the Californian sardine drastically declined after a peak in 1936 (Fig. 1). The dispute around the collapse of the sardine stock has been continuing between scientists of California State standing on the conservation of the sardine stock and those of the Federal Government of the U.S. standing on the promotion of the fisheries (Radovich, 1981). In a paper jointly prepared by Clark and Marr (1955) each scientist reached an opinion different from the other based on the same data. Clark contended an influence of the exploitation on recruitments, saying that there had been a density-dependent effect between the stock and recruitment because if the stock size of the adult had been small, the resultant level of the progeny tended to become low. On the other hand, Marr asserted an effect of the environment on the recruitment, viz. density-independent effect, suggesting that the relation between the stock and recruitment was obscure.
The same circumstances as above have been seen in the Far Eastern sardine, the catch of which dramatically decreased after a peak in 1937 (Fig. 1). Nakai (1962), a representative researcher on the sardine in Japan, tried to explain this event by the meandering of the Kuroshio. The stream axis of the Kuroshio, which flows eastward along the southern coast of Japan, often shifts, adding a semicircular southward movement. This in turn creates a counterclockwise cold eddy to the north and a clockwise warm eddy to the west. It is said that there are five types of pathway. One is normal or non-meandering (N), while the others meander in somewhat different patterns (types A-D in Fig.2). Although cold eddies associated with types B-D have occurred frequently, large-scale A-type fluctuations seldom have appeared.
Nakai (1962) presumed that the spawning of the sardine was concentrated on a region south of Kyushu, Japan, and their eggs and newly hatched larvae drifting eastward came across an A-type cold eddy, resulting in a mass mortality. On the contrary, Cushing (1971) regarded a disastrous decline in recruitment of the sardine resulting from the heavy fishing as a cause of the collapse of the stock.
While controversies between overfishing and natural cause around the decrease in stock of the sardines have been long held, similar disputes have also occurred about the herrings.
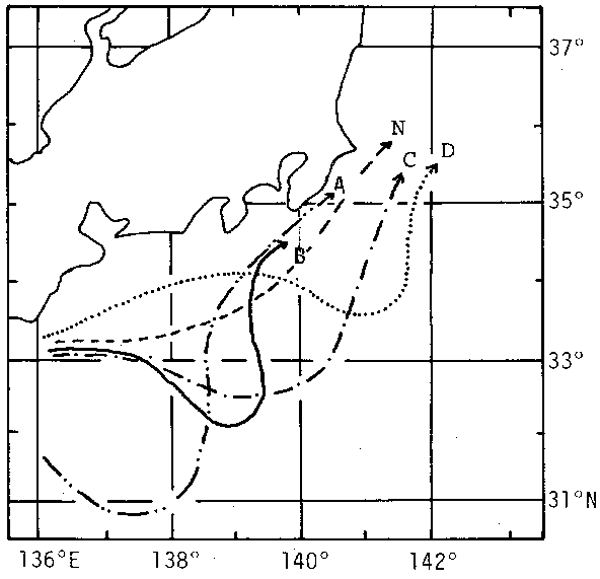
Fig.2. Types of meandering of the Kuroshio path south of Japan.
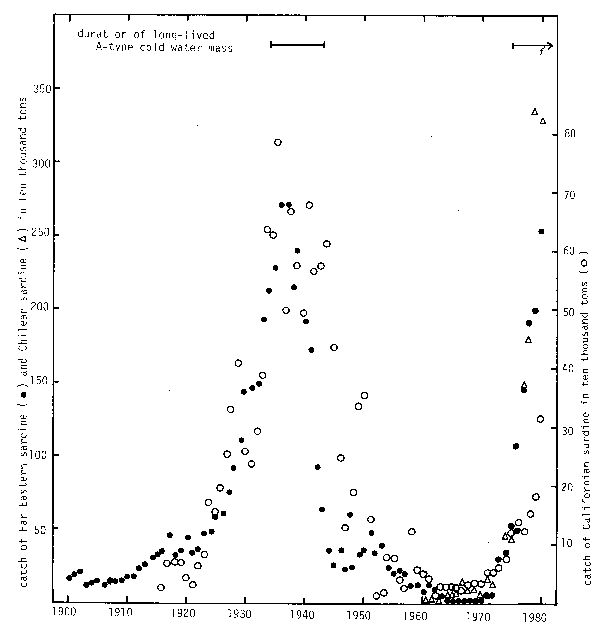
Fig. 1. Large-scale variations in catch of three species of sardine, Far Eastern, Californian and Chilean.
CHANGE IN NICHE SIZE
The number of organisms of a species varies from generation to generation. Let us consider the meaning of this variation. That a species continue to survive means that the maximal quantity of the matter and energy possible are taken over from a generation to the subsequent one. According to Simpson (1952), the number of species currently existing is 2 millions, while that which have been extinguished to date is one half billion. This implies that most species failed to achieve persistant replacement from generation by generation, eventually disappearing from the earth. This also means that a small number of species could remain surviving at present. The author considers that the success or failure of the persistence of organisms (viability) from one generation to the next is closely linked with the status and problems involved in the ecological-niche in the community concerned. “Niche” is defined as the status of a species in a community composed mainly of predator-prey relations. This is provided by the overall biotic and abiotic environment surrounding the species. To maximize the quantity of surviving biomass between generations means that a species regulates its biomass so that the size of its niche is filled completely by its organisms. To regulate the biomass means to regulate the number of organisms. If a population does not increase sufficiently to fill its niche once it has been extended, this niche would be “violated” by another population, the niche of which is close to the former. On the other hand, if a population does not decrease its biomass in response to the contraction of its niche, many organisms of that population would die or become weakened due to overpopulation. Only a species which had acquired the ability to regulate its number so that it fills the niche completely in response to fluctuations in niche size could have survived.
The response pattern to fluctuations in niche size depends on species. Therefore, the pattern of fluctuation in number differs from species to species and this is called species-specific pattern of fluctuation in number. The species-specific pattern of fluctuation in number is the pattern of resource utilization for a species, which is having been formed through evolution and history.
EXTREME TYPES AND DEVELOPMENTAL PROCESSES OF THE PATTERNS OF FLUCTUATION IN NUMBER
Patterns of fluctuation in the number of marine teleosts can be assigned to three broad types.
| Type I: | unstable and unpredictable |
| Subtype IA: | irregular and short-spaced e.g. Pacific saury and Pacific sandlance |
| Subtype IB: | large-scale and cyclical e.g. sardines and herrings |
| Type II: | stable and predictable e.g. tunas and flatfishes |
In what environments did these three types have evolved? Cushing (1975) summarized the longitudinal features of production in the ocean. In the higher latitudes, while the large-scale primary production occurs in a short time and the productivity is very high, the delay period between the trophic levels is long, resulting in low ecological efficiency. In other words, productivity is high, efficiency is low, and variability is large. On this occasion, the abundance of a few species large in biomass largely varies corresponding to the fluctuation in niche size and they alternate with one another at shorter intervals, illustrating a phenomenon known as “alternation between species”. The structure of such a community is simple and the relation among species is lax.
On the other hand, while in the low latitudes the low and continuous primary produc- tion occurs, the delay period between the trophic levels is short, resulting in a high ecological efficiency. In this case, while the productivity is low, the efficiency is high. There are many species whose biomasses are small and remain stable. The structure of a community is complex and interspecific relations are keen.
Not only the high latitudes are productive in the ocean. The productivity is also high in the upwelling areas, coastal areas and vertically in the surface. Because the niche size varies greatly in these environments, the species that have the ability to change their numbers corresponding to the change in niche have taken hold in these environments. These species have to pour more substance and energy into reproduction rather than maintenance and growth of the body in order to secure their broods. This is Type I.
On the contrary, because the variation in niche size is small in a poor, efficient and stable environment, the species need not greatly change their numbers. In such species more substance and energy are used for the maintenance and growth and they have to cope with the severe interspecific competition. This is Type II.
Let us think about the features of environmental variation in the sea. The changes in the seas are considered to be a synthesis of the short-spaced variation, with intervals of one to a few years, occurring in a relatively small area and large-scale variations, with cyles of several decades to centuries, occurring in large ocean-wide areas. While Subtype IA which has evolved matching the former is sensitive to the local environmental variation and its niche size varies finely, the niche size of Subtype IB matching the latter fluctuates largely (Fig. 3).
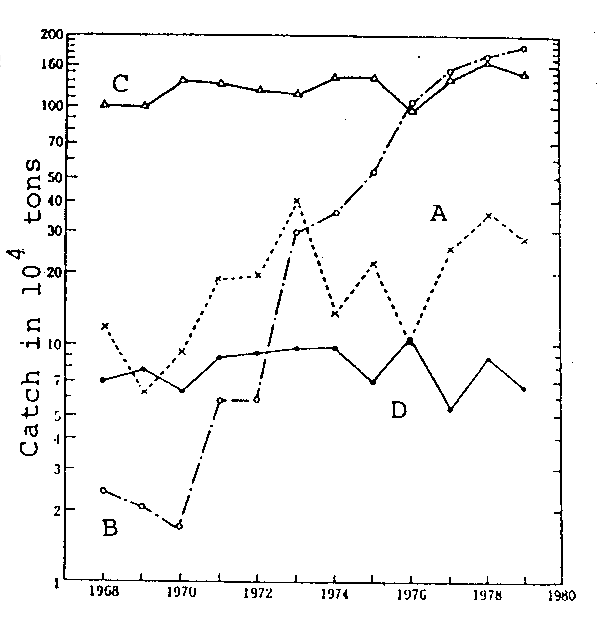
Fig.3. Inter-annual variations in catches of Pacific saury (A), Far Eastern sardine (B), chub mackerel (C) and albacore (D), caught in the Japanese fisheries.
Inter-relation among the three types
Subtypes IA and IB are not equivalent to each other and IA is the original pattern. Fish of Subtype IA have small body with short life, early reproduction and high intrinsic rate of natural increase r. They pour more matter from outside into reproduction by the quick alternation of generations in order to fully utilize their ecological niches, if they are extended by the betterment of environment or to cope with the contraction of their niches resulting from the deterioration of environment.
Whereas the life history type IA is optimal for a short-spaced environmental variation, it is not appropriate for a continuous long-period one, because in order to increase in step with the sustained extension of ecological niche, it is necessary to accumulate large year classes year by year, which in turn will produce larger year classes. Accordingly, this type of life history requires long life. However, to pour energy into reproduction, i.e. into the preservation of brood, is incompatible with long life.
A life history in which most growth is completed in an earlier period of life to begin reproduction as early as possible so that more energy is put into reproduction, has been selected as a way to overcome this contradiction. To reach the maximal size at a relatively young stage means that Bertalanffy's growth parameter k has a high value.
Since k has a dimension of reciprocal of time, k multiplied by cohort generation time, T, has to be used for comparison of growth patterns among species or subpopulations. As seen in Fig.4 values of kT are constant, on average, and a relation between the two parameters is hyperbolical (In Fig. 4 life span is used on behalf of T).
Fig. 4 also shows that all species and/or subpopulations of Genera Sardinops (sardines) and Clupea (herrings) close to Subtype IB, from 4 to 9 in the figure, have high kT's, being situated above an arbitrarily drawn hyperbola.
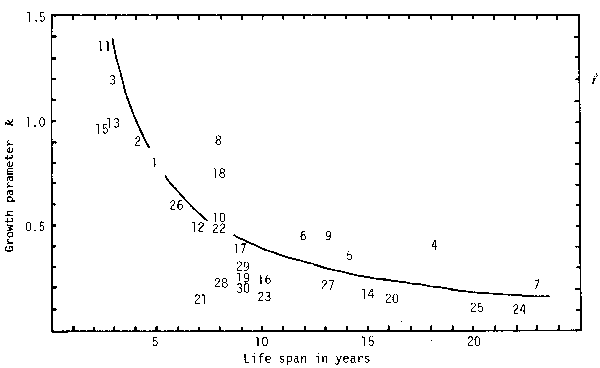
Fig. 4. Regression of growth parameter k on estimated life span, based on data from various sources. Numerals and a curve in the figure denote species number designated in Table 1 and arbitrarily adjusted hyperbola, respectively.
| Order | Family | Species | |
|---|---|---|---|
| Number | Name | ||
| Clupeiformes | Clupeidae | 1 | Sprattus sprattus(North Sea) |
| 2 | Sprattus sprattus(Brittany) | ||
| 3 | Sprattus sprattus(Spain) | ||
| 4 | Clupea pallasi(Hokkaido-Sakhalin) | ||
| 5 | Clupea pallasi(Okhotsk) | ||
| 6 | Clupea pallasi(British Columbia) | ||
| 7 | Clupea harengus(Atlanto-Scandian) | ||
| 8 | Sardinops melanosticta | ||
| 9 | Sardinops caerulea | ||
| 10 | Konosirus punctatus | ||
| Engraulidae | 11 | Engraulis japonica | |
| 12 | Engraulis mordax | ||
| 13 | Engraulis encrasicholus | ||
| Anguilliformes | Muraenesocidae | 14 | Muraenesox sinereus |
| Atheriniformes | Scombresocidae | 15 | Cololabis saira |
| Gadiformes | Gadidae | 16 | Theragra chalcogramma |
| Perciformes | Sillaginidae | 17 | Sillago sihama |
| Carangidae | 18 | Trachurus japonicus | |
| 19 | Seriola quinqueradiata | ||
| Sparidae | 20 | Pagrus major | |
| Sciaenidae | 21 | Argyrosomus argentatus | |
| Scombridae | 22 | Pneumatophorus japonicus | |
| Thunnidae | 23 | Thunnus alalungu | |
| 24 | Thunnus thynnus | ||
| 25 | Thunnus maccoyi | ||
| 26 | Katsuwonus pelamis | ||
| Scorpaeniformes | Scorpaenidae | 27 | Sebastes thompsoni |
| Pleuroncetiformes | Pleuronectidae | 28 | Eopsetta grigorjewi |
| 29 | Cleisthenes pinetorum | ||
| 30 | Microstomus achne | ||
Fishes of Type II have large size and long life, growing slowly and becoming mature late. Thus they allocate more energy to maintenance and growth of the body.
Here, let us examine a problem concerning r where r is expressed as:
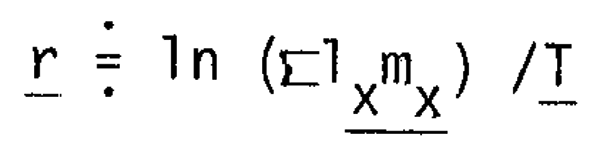
where 1x is the probability of female at age 0 of surviving to age x, mx is the number of female eggs laid by the average female in the age interval (x - 0.5) to (x + 0.5). This equation indicates that r is positively proportional to the product of survivorship at ages producing eggs by fecundity and negatively proportional to the generation time, average ages of mothers, which is more influential on r than the former.
Subtype IA raises its r higher by shortening T as much as possible. Moreover, Subtype IA begins spawning as early as possible, effectively raising lx by producing demersal eggs (in case of Pacific saury) or by their fathers caring for eggs by (in case of snailfish), and allows smaller body size, compensating any decrease in mx resulting from short life. Thus, Subtype IA have acquired large r values like that of the Pacific saury as seen in Table 2.
Since r's in Subtype IB and II tend to become low because of their long T's, some life historical selections had had to be developed. Subtype IB either develops high GSI, gonad weight as a percentage of body weight (Fig. 5), or raises 1x as high as possible by laying demersal eggs (herrings), lowering the first age at maturity (sardines), etc. On the other hand, Type II has selected a strategy for higher mx so that r does not become unnecessarily low. (Table 2).
| species | type | r | fecundity | egg diameter (mm) | age at maturity | mean age of mother | incubation time |
|---|---|---|---|---|---|---|---|
| Pacific saury | IA | 0.921 | 103 | 1.31–2.08 | 1 | 1.5 | 8.5days(24°C)–33(10) |
| Californian sardine | IB | 0.347 | 104 | 1.2–1.4 | 2 | 4.0 | 34hrs(20)–85(15)* |
| chub mackerel | II | 0.245-0.285 | 105–106 | 0.9–1.3 | 3 | 4.2–4.9 | 30hrs(25)–97(15) |
| albocore | II | 0.347 | 106 | around 1 | 6 | 6.9 | 24hrs–38** |
* Far Eastern sardine
** yellowfin tuna
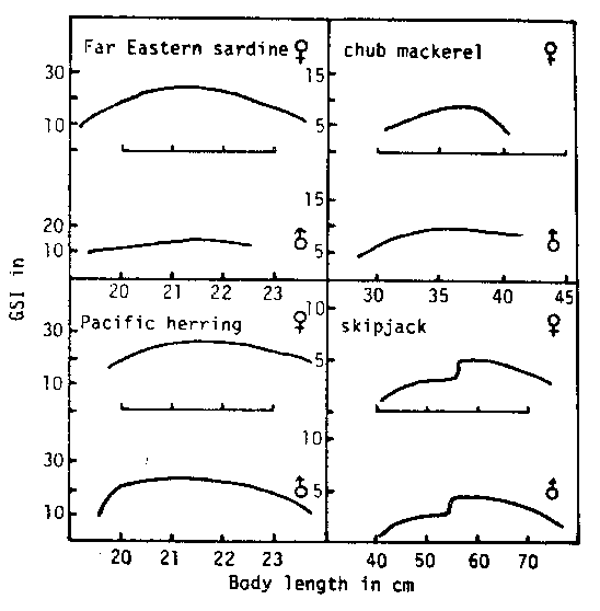
Fig. 5. Maximum-GSI- on-length curves for various marine teleosts. MBL denotes mean body length in mm of the data used, with number of fish in parentheses. F denotes fecundity.
Type II has selected two ways to produce a large number of eggs. One way is to obtain larger body size. Larger size has two advantages. One is to overcome competitors in severe interspecific struggles and the other is to increase available eggs. This is accomplished by keeping egg size small. As the present author (1978) pointed out, egg size of most marine teleosts falls within the range of 0.6 – 1.6mm in diameter. Whereas a number of species under 50 cm in length have eggs larger than 1.6 mm, there are few species over 50 cm with such large eggs.
This way of life historical selection is found in the series from the Far Eastern sardine (Sardinops melanosticta) to skipjack (Katsuwonus pelamis) by way of chub mackerel (Pneumatophorus (Secmber) japonicus) (Fig. 5). In this series, whereas the difference between the sexes is small in respect to body size and GSI, the larger the body size becomes the more the fecundity increases and the less the GSI decreases. Decrease in GSI means that more subtance is poured into growth and maintenance, while absolute size of gonads increases.
The selection in this direction is seen in the migratory pelagic fishes. In these species sexual differences are small because fish of the same age must be of uniform swimming ability and the abundant male reproductive matter is necessary due to inefficiency of fertilization.
Another way to prevent reduction in r is to make the body size of female larger and its life longer as compared with those of male. This means that more matter and energy are allocated to female. Results of this type of selection are seen in Alaska pollack (Theragra chalcogramma) slime flounder (Microstomus achne) and others in Fig. 6. In this series the male lessens its size as well as its GSI. Selection in this direction is found in the less migratory demersal fishes. In this case, a small amount of male reproductive substance is able to fertilize a large quantity of eggs, as evident from the quasi-mating behavior of the slime flounder observed by Sato (1960).
The three types are the extremes and absolute examples may not exist in reality. A relationship among these three types is expressed in a life history triangle and a given species or subpopulation is to be situated somewhere in this triangle, as exemplified in this figure (Fig. 7).
In the life historical triangle (A) of Fig. 7, side IA-II represents a sexual dimorphism scale. In this figure an arrow toward Vertex II indicates that the females becomes larger than males. This is a direction taken by the heterosomes that live long and lay a large number of small eggs. There is another, oppositely directed arrow toward the snailfish and some gobies which are short - lived and produce a small number of large eggs cared for by their fathers.
Along side IA - II the nearshore and demersal fishes occupy their positions, while the domain from IA to II by way of IB is occupied by the pelagic fishes. Over side IA - II GSI is higher in the female than the male because the males of the nearshore or demersal fishes are able to fertilize the eggs more efficiently through various measures than are pelagic fishes that spawn in open surface or subsurface layers.
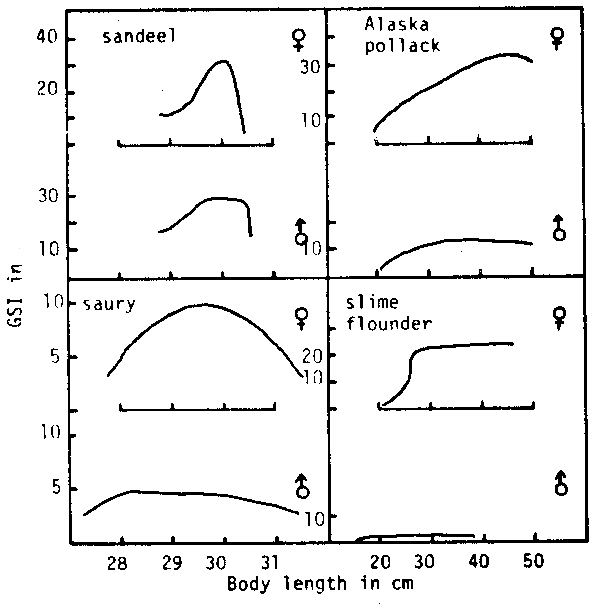
Fig. 6. Maximum-GSI-on-length curves for various marine teleosts. For explanations, see Fig.5.
On the other hand, Pacific saury, a species close to IA, occupies a position along side IA - IB, because this fish is a pelagic “swimmer” and exhibits little sexual dimorphism.
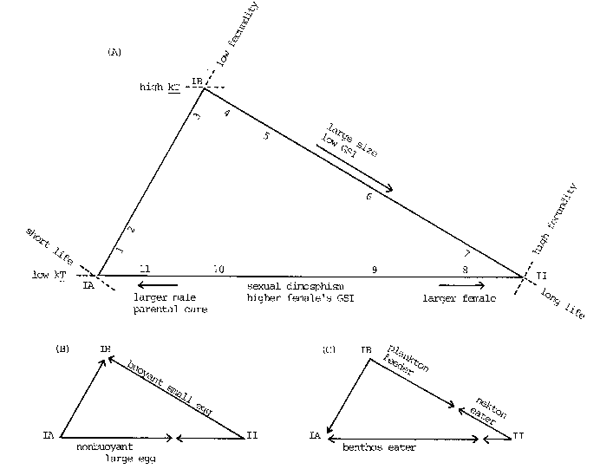
Fig. 7. Life historical triangles of the marine teleosts, from the viewpoint of three dimensions (A), nature of eggs (B) and food habit (C) Number inside the figure (A) denotes locus of each taxon shown below. 1:saury, 2:sandlance, 3:herring, 4:sardine, 5:jack mackerel, 7:tunas, 8:heterosomes, 9:gadoids, 10:gobies, 11:snailfish
A part from vertex IB halfway to II by way of IA in (B) is a domain occupied by species depositing demersal large eggs, while that from IB halfway to IA via II is one occupied by fishes laying pelagic small eggs. Therefore, the sardines (Sardinops) and herrings (Clupea), both occupying loci close to IB, are located along side IB - II in (B) and side IB - IA respectively (Fig.7).
Benthos eaters are located between IA and a point a little apart from II in (C). From the latter point to one close to II on the way from II toward IB the nekton eaters are located (Fig.7). Among the benthos and nekton eaters interspecific competition for food can be keen. This is a domain efficient in food utilization and relatively low in biological production. On the contrary, a part from IA to a point near II by way of IB in (C) is occupied by the plankton feeders where interspecific interactions over food are lax. This is an inefficient and productive domain.
The correlates of three selected types of life history are summarized in Table 3.
| Type I | Type II | |||
|---|---|---|---|---|
| Subtype IA | Subtype IB | |||
| Environment | Variable and unpredictable | Stable and predictable | ||
| Irregular | Lone-term | |||
| variation | variation | |||
| Recruitment | Variable | Stable | ||
| Irregular | Long-term | |||
| variation | variation | |||
| Resources put into | Reproduction | Growth and maintenance | ||
| Reproduction | Reproduction and maintenance | |||
| Lifetime | Short | Long | Long | |
| Growth | ||||
| KT | Low | High | Low | |
| L∞ | Small | Moderate | Large | |
| Reproduction Age at maturity | Low | High | ||
| Very low | Considerably low | |||
| Fecundity | Low | Moderate | High | |
| r | High | Low | Low | |
| Early survival | Variable | Stable | ||
| Trophic level | Low | High | ||
| Species close to each type | Saury, | Sardines, | Tunas, | |
| snailfish | herrings | flatfishes | ||
Patterns of fluctuation in the number of the three types
The variations of the three types are represented diagrammatically in Fig.8. The figure employs the assumption common in population biology that variation in stock size can be represented by a logistic model. Expressing the carrying capacity of the environment K under favorable environmental conditions as K2, and under adverse conditions as K1, the stock size is to increase when K goes from K1 to K2 and to decrease when K declines from K2 to K1.
More formally,
dN/dt = rN (K2 - N) / (K2 - K1) representing the increasing phase (K1→ K2)
dN/dt = rN (K1 - N) / (K2 - K1) representing the decreasing phase (K2 → K1) K1 ≤ N ≤ K 2
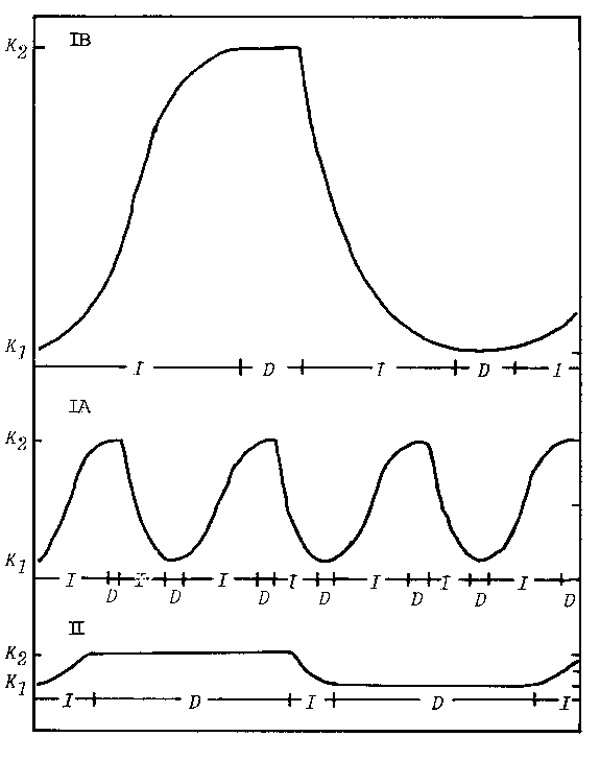
Fig. 8. Three types of patterns of fluctuations in number of marine teleosts.
K2: high K
K1: low K
D: Period when density-dependent factors work in the main.
I: Period when density-independent factors work in the main.
As seen in Fig.8, the values r and K2 - K1 are inherent attributes of a species and vary from species to species, even if they inhabit a common area. In Fig.8. I denotes periods when the density-independent factors (environmental factors) are the main influence, while D denotes periods when the density-dependent factors (biological factors) are the main influence. Duration of I is long and D is short for Type I species, indicating that they are apt to be subject to environmental change. In contrast, duration of I is short and D is long for Type II species, indicating that they tend more to be influenced by overfishing.
LARGE-SCALE FLUCTUATION OF THE THREE SARDINE STOCKS IN THE PACIFIC
Since the plankton-feeding fishes are situated close to the solar energy, they seem to be strongly affected by climate change through ocean change. In particular this is valid for sardines which are almost exclusively herbivorous. The problem is that whereas in some years they utilize phytoplankton as food efficiently, resulting in large stocks, in some years they do not and their biomass declines.
As background to this fact it seems that a change in the life pattern of the sardines occurs. If environmental conditions become favorable for sardines, their numbers increase by assuming a mode of life to keep their population as large as possible. On the contrary, if environmental conditions for sardines become adverse and their niche contracts, they prepare for the next prosperity period by assuming a life style in which population growth is regulated.
What oceanographical variation governs the above situation? Fig.1. displays the tremendous large-scale fluctuations in catch exhibited by three species of Genus Sardinops, the Far Eastern sardine, Californian sardine and Chilean sardine. While these species are in the northwest, northeast and southeast parts, respectively, of the Pacific Ocean, their fluctuations are in phase with one another.
Nishimura (1980) said that the Far Eastern and Californian sardines are twins of a Japan-Oregon element and a species which had evolved off the west coast of North America and subsequently divided into two different species. I imagine that a part of the original species had further proceeded south and became the Chilean sardine. Three sardines are triplets, aren't they?
It would be impossible to explain the cause of a common fluctuation of the three sardine stocks without taking account of the Pacific-scale oceanic variations and related climatic changes.
While the links between ocean and atmosphere are easily recognized at a local and regional scale, there may also be identifiable interactions at a large scale. So-called “teleconnections” (Wyrtki, 1973), which shows significant relations of variations between very distant areas of the ocean and atmosphere, have been a subject of considerable study.
For example, originally it was believed that El Niño occurred when the local winds over the coastal upwelling zone became anomalously weak. According to Thompson (1981), however, there now is considerable evidence suggesting that basin-wide atmospheric and oceanographic anomalies are at least as important as the local winds in creating El Niño (Fig.9). Equatorial trades were unusually strong in 1970 and 1971, but were unusually weak in 1972. Furthermore, the eastward flowing North Equatorial Countercurrent intensified and the South Equatorial Current weakened during the 1972 El Niño. It appears that warm water accumulated in the eastern Pacific, deepening the usually shallow thermocline and covering the cooler upwelled waters. The local coastal winds along the Peru coast during the same period were normal or only slightly below normal.
Teramoto (1981) notes teleconnections between the following items: precipitation and cloudiness on Canton Island (3°S, 172°W) and Ocean Island (1°S, 169°E) in the central equatorial Pacific and the difference between water levels of northernmost and southernmost areas across the North Equatorial Countercurrent as an index of the current; the above difference between water levels and El Niño, using water temperature in the eastern equatorial Pacific as an indicator; the difference between water levels and longitudinal components of the velocity of geostrophic winds on a 700 mb plane along 30°N latitude (Fig.10). Statistical analysis suggests that these indicators lag one another by three to eight months. This same series of teleconnections also seems to be associated with the variation of the Kuroshio.
If the above discussion on large-scale ocean changes is valid, it is understandable why the three sardine species have shown almost identical trends of variation in stock size.
A long-lived A-type cold water mass may be regarded as a local manifestation of large-scale variation (Teramoto, 1981), such as occurred in 1934–1943 and has been occurring since 1975 to the present, a period when sardine stocks have been most abundant (Fig.1).
Such large-scale fluctuation exhibited by sardines depends upon their ecological features. They are long-lived, fast growing, direct herbivores in the coastal area, and these features mean that they are especially subject to changes of oceanic conditions. To summarize, large-scale fluctuation of Sardinops is caused by global-scale environmental variation and depends on whether the sardines are able to utilize a large quantity of phytoplankton or not.
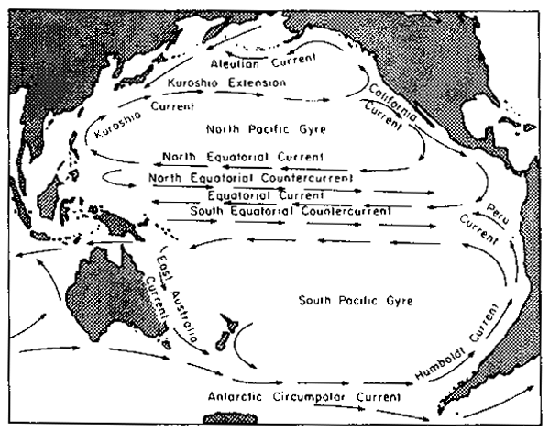
Fig. 9. The current pattern in the equatorial region of the Pacific is more complex than that of the Atlantic, although to north and south similar enclosed circulatory gyres are formed. Recent research designates three west-flowing equatorial currents separated by two east-flowing equatorial countercurrents. (Courtesy Rand McNally Atlas of the Ocean.)
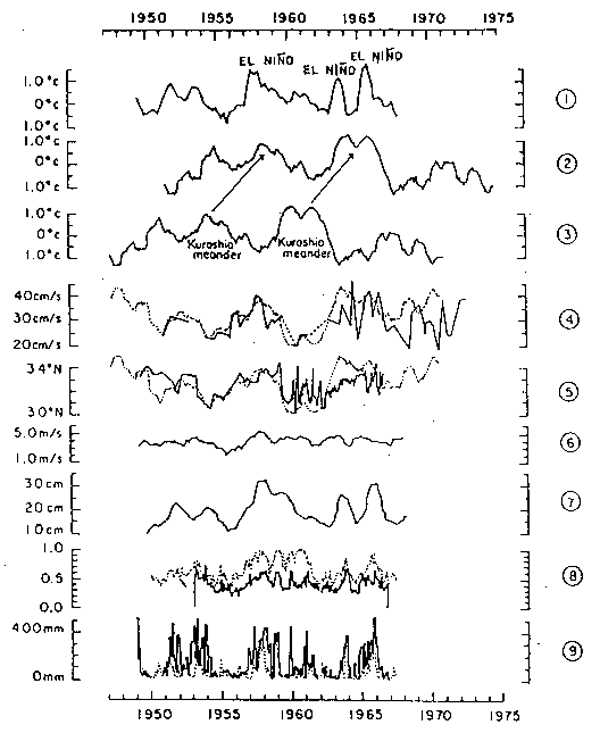
Fig. 10. (1) Anomaly of yearly mean water temperature on the coast of
Central America.
(2) Anomaly of yearly mean water temperature on the coast of
Izu-Oshima Island south of Houshu, Japan, delayed by some
4.2 years.
(3) Anomaly of yearly mean water temperature on the coast of
Izu-Oshima Island south of Honshu, Japan.
(4) Mean of surface current velocity in the profile of the
Kuroshio south of Cape Omaezaki, Japan (solid line), and
inversionof (3) (dotted line).
(5) Stream axis of the Kuroshio south of Cape Omaezaki (solid
line) and inversion of (3) (dotted line).
(6) Annual mean of the strength of westerly wind on a 700 mb
plane.
(7) Variation in annual mean of differences between water
levels across the Equatorial Countercurrent.
(8) Monthly mean cloudiness above Ocean Island (solid line) and
that above Canton Island (dotted line).
(9) Monthly annual precipitation on Ocean Island (solid line)
and that on Canton Island (dotted line).
REFERENCES
Clark, F.N. and J.C. Marr. 1955. Population dynamics of the Pacific sardine. Calif.Mar.Res.Com., Prog.Rep. 1 July 1953 to 31 March 1955.
Cushing, D.H. 1971. The dependence of recruitment on parent stock in different groups of fishes. J.du Cons. 33.
Cushing, D.H. 1975. Marine Ecology and Fisheries. Cambridge Univ.Press, Cambridge.
Kawasaki, T. 1978. Fluctuation in population of the marine teleosts. Kaiyo Kagaku (Marine Science), 10(in Japanese).
Nakai, Z. 1962. Studies relevant to mechanisms underlying the fluctuation in the catch of the Japanese sardine, Sardinops melanosticta (Temminck and Schlegel). Jap.J.Ichthy. 9.
Nishimura. S. 1981. Ocean and Life on the Earth, Kaimei-sha, Tokyo (in Japanese).
Radovich, J. 1981. The collapse of the California sardine fishery: What have we learned? pp. 107– 136. In Resource Management and Environmental Uncertainty. (M.H. Glantz and J.D. Thompson, eds.) John Wiley and Sons, New York.
Sato, Y. 1960. Spawning behavior of the slime flounder (preliminary report). Sokouo Joho, 26 (in Japanese).
Simpson, G.G. 1952. How much species? Evolution, 6.
Teramoto, T. 1981. Long-term variation of the Kuroshio. Kisho-Kenkyu Note (Meterological Research Note), 1412 (in Japanese).
Thompson, J.D. 1981. Climate, upwelling, and biological productivity: Some primary relationships. pp. 13–34. In Resource Management and Environmental Uncertainty. (M.H. Glantz and J.D. Thompson, eds.) John Wiley and Sons, New York.
Wyrtki, K. 1973. Teleconnections in the equatorial Pacific Ocean. Science. 180:66–80.
![]()
![]()
![]()