by
Tomoyasu Kawai and Kimiko Isibasi
Tokai Regional Fisheries Research Laboratory
5–5–1 Kachidoki, Chuo-ku
Tokyo, Japan
Resumen
Se propone una hipótesis de trabajo sobre la mortalidad de las larvas causada por canibalismo y predación por parte del plancton carnívoro y el rol que tiene en los cambios en la abundancia y en la composición por espe- cies de los stocks de peces neríticos pelágicos. Se ha llegado a la deriva- ción de esta hipótesis a través de la investigación de varias característi- cas ecologicas importantes que son inherentes a cada especie. En base a esta hipótesis se propone un modelo matemático que parece describir bastante bien los cambios en el número de individuos en determinada cohorte a través de su vida. Se discute la hipótesis de trabajo en conexión con los fenóme- nos observados en las aguas alrededor de Japón.
Es bien conocido que la capacidad de proliferar es una de las caracte- rísticas biológicas prominentes de los peces, la que se manifiesta con la producción de huevos de tamaño comparativamente pequeño. Otra particulari- dad encontrada entre los peces es la falta de relación entre el tamaño de los huevos y el tamaño del individuo adulto, mientras que en otros animales oviparos es común encontrar una correlación entre estas dos características, caso típico de las aves.
A pesar de este hecho, cada especie de pez alcanza un tamaño corporal definido alrededor de un año después de haber sido desovado, tamaño que determina el tamaño del individuo adulto inherente a la especie. Por ejem- plo, la anchoveta japonesa crece sólo hasta 11 cm. en el primer año de vida mientras que el atun ojo grande crece hasta 55 cm. Los autores piensan que estos cambios en el tamaño derivan de las diferencias en la alimentación durante el estado larvario y el primer año de vida. Se concluye que los hábitos alimenticios tienen una fuerte correlación con los parámetros per- tinentes del crecimiento y reproducción de los peces, tales como la fecun- didad y la primera madurez.
Una de las características observadas en los cambios en la composición por especies en las aguas alrededor de Japón es que la dominancia ha ido cambiando a través del tiempo de una especie costera a otra, que ha estado distribuida en las aguas vecinas mar afuera. Los autores asumen que las especies que se encuentran mar afuera, que se caracterizan por una capacidad potencial de aumentar rápidamente, comienzan a hacerse más abundantes cuando las otras especies comienzan a disminuir (debido mayormente a las grandes pérdidas durante sus estados larvarios causados por la predación del planc- ton carnivoro) y finalmente cambia la dominancia.
Se examinó la relación entre las edades de varios estadios importantes de la vida de las cohortes de 30 especies principales de Japón. Se examinó la edad a la primera madurez (tm), edad máxima (tx) y la edad a la máxima biomasa de la cohorte (ts). Se encontró que la edad a la biomasa máxima (ts) es muy sensitiva a los cambios en la abundancia de la cohorte en relación con los cambios en mortalidad promedio.
El incremento de la mortalidad inevitablemente hace disminuir el valor de ts, que normalmente es mayor que tm y tiene un valor cercano a tm + (tx - tm)/3. Con el aumento de la mortalidad, ts disminuye y se aproxima a tm, lo cual indica el estado de deterioro de la cohorte, especialmente en lo que se refiere a la producción de la próxima generación. Los autores proponen que este tipo de enfoque, es decir la observación de ts, tm y sus cambios en cada cohorte existente, puede ampliar y extender las aplicaciones de los métodos tradicionales de evaluación y ordenación de pesquería. Se hacen también algunas recomendaciones para futuros estudios.
INTRODUCTION
There have been numerous phenomena recorded characterized by large changes in abun- dance and species composition of neritic pelagic resources in many parts of the world's oceans. The waters around Japan are not exceptional when dominance switched from one species to the other over the years. The latest and most drastic change observed in the region was the burst of Japanese sardine and the change in the dominance from chub mackerel during the latter half of the 1970's. The catch of Japanese sardine has greatly increased since the early 1970's and is now more than 3 million tons, accounting for about 50 percent of the total pelagic fish production in the region, while the total production has been rather stable at about the 5–6 million tons level during the past decade. It has generally been extremely difficult to analyze the large and dramatic changes in the stock abundance and species composition of neritic pelagic fish resources. A reasonable explanation of the phenomena observed, or a prediction for future changes, has scarcely been made so far. The authors suspect, for the reason that some of the key factors which play an important role in these phenomena, have not been appropriately covered by the traditional methods of stock assessment, and the analysis of the entire mechanism has eventually remained beyond the conventional approaches carried out so far.
The authors think that more careful attention should be given to the biological-eco- logical factors during the early stages of life, especially on fecundity, growth and feeding habits. This idea has been derived from the results of a series of comparative studies on many fish species including oceanic and demersal fish. The studies have finally come across with a new hypothesis on larval mortality. The authors propose, in this paper, the working hypothesis on the role of several important ecological characteristics, which are genetically inherent to each species, in the change in stock abundance and, accordingly, change in species composition. A mathematical model being based on the hypothesis is then proposed, which appears to describe fairly well the change in the number of fish in a given cohort throughout their life-span. Discussions on the working hypothesis in connection with the phenomena ob- served in the waters around Japan are subsequently presented.
The authors are greatly indebted to Mrs. T. Takahashi for her enthusiastic assistance given to them during the study. The authors are also grateful to Dr. S. Chikuni, Fisheries Department, FAO for the critical comments and assistance he has given to them.
REVIEW OF IMPORTANT BIOLOGICAL CHARACTERISTICS
The authors reviewed the biological characteristics which may be relevant to the change in stock abundance on a comparative basis among many fish species. The authors limited the field of this comparison within marine teleostei. Most of the basic information and data on marine teleosts used in this study have been cited, unless specifically referred to, from Matsubara et al., (1965). Medians were used by the authors for the parameters given with ranges in the original reports. The relevant data on the biological features of 75 species employed in the analyses are given in Appendix I at the end of this paper.
Relationship between egg and adult sizes
Attention was first drawn by the authors to the size of eggs in connection with the large fecundity of marine teleosts. The simple, but principal question which arose from our review study was: Why are the egg sizes generally small throughout the Super-Order including tunas, which attain the largest body size, although the eggs of most tunas are, more surprisingly, usually smaller than those of sardines?
It is a general rule among terrestrial oviparous animals that egg size is nearly proportional to the size of the adult stage. Hence, it is peculiar that no correlation occurs between the eggs and adult sizes in marine teleosts. The authors assume that this peculiarity must have resulted in response to and “correlation” with the environmental conditions in order to maintain species abundances at persistence levels during their struggle for existence. The above-mentioned relationships between egg and adult size are clearly shown in Figure 1 for selected species by the three categories currently living in or around Japan. The adult sizes referred to in this study are the means of largest size generally observed but not the maximum size recorded, see the notation in Figure 1 for the definition of egg size.
Kawai (1978a, b) carried out a series of statistical analyses to look into these characteristics in further detail. However, any of the examinations on the type and nature of eggs, taxonomic position and ecological situation of fish did not show signif- icant linkage with the relationship between egg and adult size.
Discontinuity of growth from egg to adult stages
In order to compare the sizes of fish five critical stages were selected as (1) egg, (2) immediately after hatching, (3) one full year of age, (4) biological minimum, and (5) adult (largest size in a common sense as defined earlier). The biological minimum size referred to in this study is the average size of fish after the first spawning in their life. These stages generally appear to represent the important segments of fish life in terms of growth in length with the exception of the “one full year of age” which is arb- itrary from an ecological point of view. The size at one full year of age has been chosen simply on the basis that the available data lack sufficient information on a more eco- logically-meaningful stage and size during the immature periods. Data for the shorter- lived fish, lives shorter than 3 years, have been excluded from the comparison of the size at one full year of age to avoid any bias related to adult size and early maturity due to small size. In this examination only data from females has been chosen to represent the species if growth is different between sexes. Comparison of sizes has been made between each successive stage of the above-mentioned five stages and the results are shown in Figure 2.
The results clearly show that the highly significant positive correlationships exist between the sizes at (1) egg and larva, (2) age-1 and biological minimum, and (3) bio- logical minimum and adult. However, it appears there is almost no substantial relation- ship, neither positive nor negative, between the sizes at larva and age-1. This implies firstly that a significant discontinuity in growth pattern exists during the first year of age after hatching, and secondly that the species-specific growth pattern which determines the adult size is established during the same period, for instance, anchovy attains about 42 times greater body size from 2.6 mm to 11 cm while big-eye tuna about 370 times from 1.5 mm to 55 cm. The authors believe this phenomenon, which appears to be quite common among marine teleosts but extremely unique among oviparous vertebrates, is really crucial for the growth of each species and also suspect this may play an important role in other ecological features of fish, including those closely or directly linked with the subject of this study.
What could be the major factors which determine, during the first year of life, the species-specific growth pattern throughout the rest of the life? The authors conceived that perhaps differences in the quality of food is the major factor contributing to the differences in growth. It is probable that the growth rate of a specific species could be considerably higher even in the very small stages if highly nutritious foods are taken selectively. Rapid growth (rapid increase in the sizes of body and internal organs) may also boost the larger quantity of food intake which surely accelerates the growth rate.
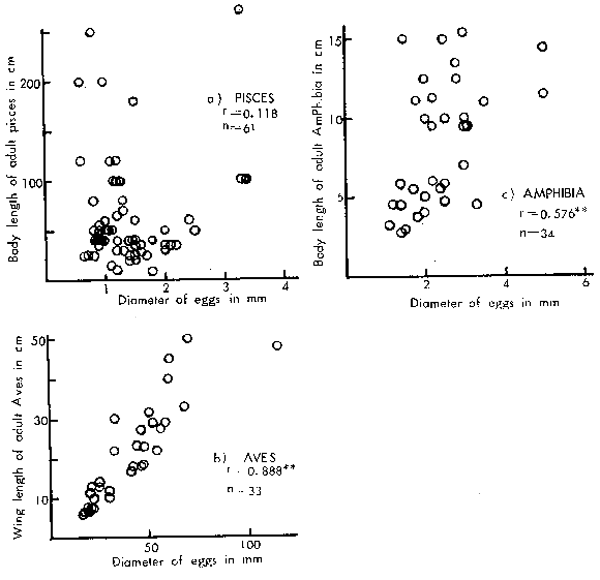
Figure 1
Relationship between the egg and adult sizes for selected species, examples: Pisces, Aves and Amphibia which currently live in or around Japan. The adult size means the largest size generally observed but not the maximum size re- corded. The egg size referred to is the size of eggs at spawn. Means of the major and minor axes were applied for elliptical eggs with the exception of the Aves for which major axis was always applied.
r = correlation coefficient
n = number of sample
*, ** : significant at 5 percent or 1 percent,
respectively, of the level of significance.
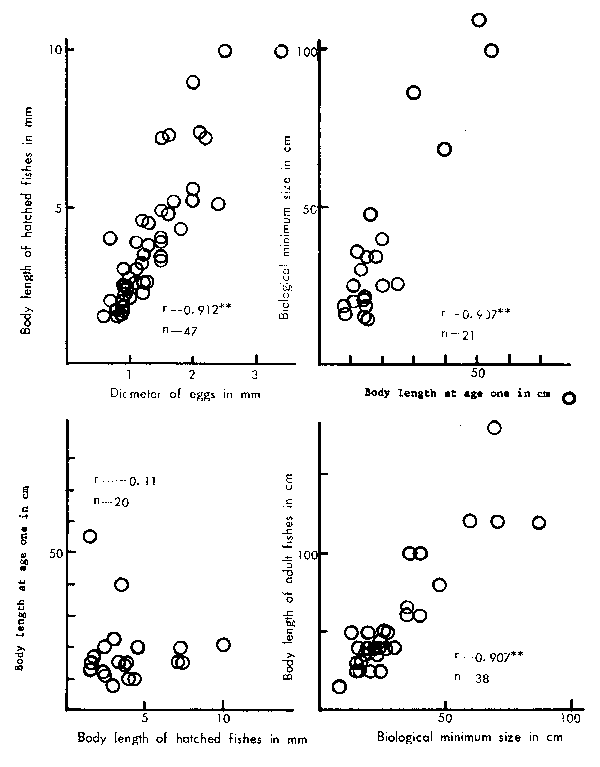
Figure 2
Comparisons of the sizes between two successive stages of life. See the text for the definition of each stage of Figure1 for the notation in the figures.
Through choice of prey the larger species may thus have attained their specific growth patterns for the rest of their lives. The key factor or the trigger of the difference of growth could therefore be in the feeding habit which should have been genetically pre- determined. In fact, it is well known that young fish generally attain the same feeding habits as their adult within the first year after hatching.
Relationship between growth and feeding habit and the implications to fertility
The species were categorized into three groups based on their feeding habits in adult stage which were mostly referred to Suehiro(1941). The planktivores and piscivores were clearly separated respectively and the remainder were all combined into one as omnivores as those species, e.g. benthos feeders, were rather difficult to categorize further into specific groups with such biological/ecological base as the first two. The comparison of body sizes at each growth stage among these species is given in Figure 3.
During the first two younger stages - egg and larva, there is no substantive relation- ship observed between the sizes and feeding habits though the planktivores show a slightly larger size than the other two groups. However, at the oldest two stages - biological minimum and adult, the difference in body size is clearly shown, that is, the largest are in the piscivorous group followed by omnivorous and the smallest in the planktivorous. It appears that the principle in these differences has been established by the end of the first year of life. It is also noted that the adult body size of the piscivorous group is prominent overwhelming the other two groups. These phenomena indicate that the discontin- uity of growth patterns shown during the period starting from larvae to one full year of age was undoubtedly related to the differences in the feeding habits of each species.
These facts relate more importantly to the reproductive potential of any fish. Generally there is no large difference among fish species in the proportion of the ovary weight over body weight, which is usually about 12 percent (Kawai et al., 1981). It may therefore be a general rule that more eggs could be spawned by larger fish. This immediately suggests there is a larger fertility in piscivores. The authors assume that the fertility may have been one of the important rationales for piscivores attained throughout evolutional history. In other words, piscivores among marine teleosts might have evolved behind plank- tivores, specifically along the above mentioned pathway, though every teleost has perhaps strived toward its potential and opportunities to persist. The authors believe that distinction between planktivores and piscivores should be made in the population dynamics studies from this perspective.
Assumed implications of feeding habit to population dynamics
Through the analyses described so far, it has been assumed that piscivores may have evolved toward speeding up growth, but deferring age at maturity. This function is com- pletely the reverse to the phenomena observed in an exploited or stressed single species population. For instance, Japanese sardine which grew slower and matured at age-3 during its prosperous period in the 1930's, speeded up their growth and became mature at age-2 when the stock abundance decreased during the 1950's. However, the authors believe that each of these two contradictory functions has its own biological rationale, considering the two different situations, i.e. the survival of species over the evolutionary long-term and compensatory reactions of a population against the short-term depletion in the latter case. It is assumed along these lines that the above-mentioned evolutionary tendency might have resulted in piscovores growing faster, attaining larger sizes and maturing at older ages which eventually promotes a larger fecundity with relatively small eggs. Enormous repro- ductive potential has thus been realized in many piscivores.
It is interesting to see, at the same time, that the spawning grounds of piscivores are generally located farther offshore than those of planktivores where nutrient conditions are undoubtedly poorer than in coastal waters. In contrast, the fecundity of planktivores is significantly less than piscivores. The authors believe however that there must again be a firm biological rationality even in these contradictory phenomena, and have come to assume that cannibalism of larvae by piscivores must be one of the major roles being played to resolve the nutrient deficiency problem. In fact, it is quite imaginable that larvae could be a source of nutrition to each other in the same population. This may have even- tually functioned to stabilize more or less the magnitude of recruitment.
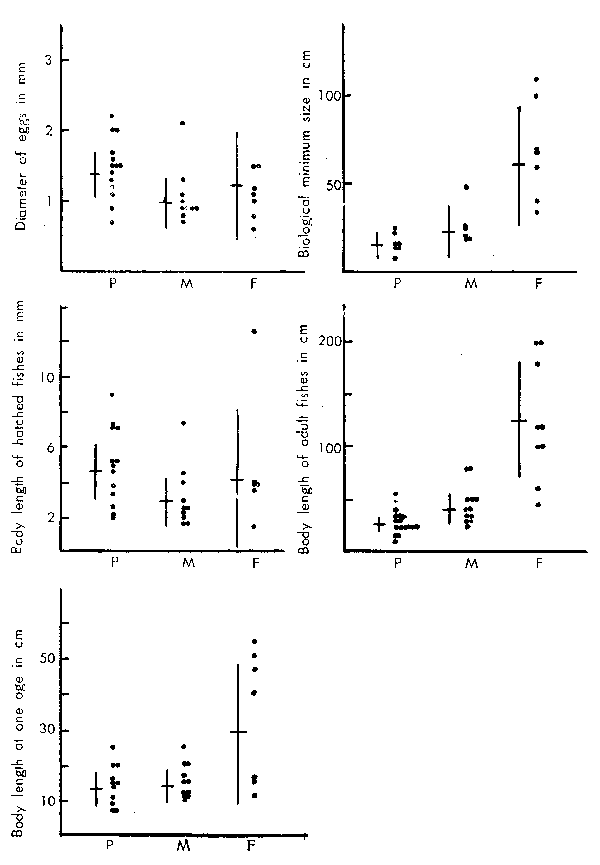
Figure 3
Comparison of body sizes at each growth stage among the groups categorized by feeding habit.
F : Piscivores, M: Omnivores. P : Planktivores.
The cross lines in each figure indicate the mean body sizes and the associated 95 percent confidence interval.
A NEW WORKING HYPOTHESIS ON LARVAL MORTALITY
The basic assumptions of the authors were: (1) the major cause of the loss of larvae must be the predation by something as larvae corpses are hardly seen in the sea, and (2) predators must be abundant to counter-balance the loss of larvae (Kawai et al., 1979, 1981). The hypotheses proposed for piscivores and planktivores are as follows:
Piscivores:
The important features of this species group to be taken into account are: (1) numbers of eggs spawned by each adult female is enormous, (2) spawning grounds are generally located in offshore waters where nutrient conditions are rather poor, (3) although egg size is comparatively small the size of the mouth of postlarva is relatively large and (4) stock abundances of adult piscivorous fishes are fairly stable in comparison to those of plank- tivorous fishes. The authors also assume that all larvae spawned would not necessarily starve to death in low nutrient offshore areas if larvae of the same species could be taken as feed. In other words, cannibalism must be the only way to survive for selected larvae and eventually sustains the existence of the species in such conditions. These features of this species category accords well with the authors' assumption and the hypothesis appears to have a plausible biological rationale in evolutionary contexts.
Planktivores:
The features of this species category are quite contrary to those of piscivores i.e. (1) numbers of eggs spawned by one adult female is relatively small, (2) spawning grounds are generally in coastal waters where plankton are abundant, (3) the mouth size of post- larva is very small and (4) the stock abundance of adult fish is generally accompanied by large fluctuations. Notable also is that the environment of coastal spawning grounds is usually unstable and unfavourable conditions sometimes occur for the larvae. However, more than 99 percent of the larvae spawned are definitely lost every year due to various reasons irrespective of the change in the environmental condition.
The authors hypothesize that the predation by carnivorous plankton would be the major cause of the loss of these fish larvae. It is strange to consider that planktivores are eaten by plankton at their larval stages, however, the authors think this phenomenon may also have biological rationale as such types of interactive co-existence are widely occur- ring.
EXAMINATION OF THE HYPOTHESIS
Larval mortality by cannibalism
It is well known that a massive death of larvae usually takes place during the so- called “critical period”, very short period after feedings starts until attaining swimming mobility. The authors reviewed the morphological studies of the post-larvae of piscivores to investigate the feasibility of cannibalism among those larvae. Basic information employed here were cited from Shirota (1975) and Uchida (1958) in which the data on the sizes of body and mouth at post-larva stage are available for major fish species around Japan as shown in Table 1.
The proportion of mouth size against body size is generally about 10 percent, or about several hundred microns against several millimetres. However, the mouth size of piscivores is markedly larger than the others, mostly about 1 mm which is about double that of the others. Another thing notable in the comparison is that the mouth size is the largest in piscivores followed by omnivores fishes and the smallest in planktivorous. The relative growth of upper jaw against body length shows a more interesting pattern by feeding habit of fish which is given in Figure 4 (Shirota, 1975). That is, skipjack and tunas (Group I) shows a sharp peak in mouth size at the earlier stage of post-larva which is followed by an obtuse peak at a slightly later period by Group II fish such as common mackerel, jack mackerel, yellowtail, red sea bream and sea bass whereas no such peak size is formed in anchovy (Group III) and saury (Group IV). It is the authors' view that the coincidence of the timing when mouth sizes become largest in Fish Group I and part of II, which are piscivores, with the timing of assumed cannibalims supports the proposed hypo- thesis well.
Table 1. Data on body length (L) and mouth size (D) in mm — diameter when mouth is opened - at post-larval stage of selected several species reported by two scientists separately (Shirota, 1975 and Uchida, 1958). The data have been re-arranged by the feeding habit of each species, namely:
P : Planktivores, O : Omnivorous, and F : Piscivorous
(A) Data reported by Shirota (1975)
| Species | P | O | F | ||||||
|---|---|---|---|---|---|---|---|---|---|
| L | D | D/L | L | D | D/L | L | D | D/L | |
| 1 | 5.0 | 0.264 | 0.053 | 5.2 | 0.759 | 0.146 | 5.5 | 1.004 | 0.183 |
| 2 | 6.4 | 0.690 | 0.107 | 4.7 | 0.226 | 0.048 | 5.1 | 0.994 | 0.195 |
| 3 | 3.7 | 0.258 | 0.070 | 6.8 | 0.496 | 0.073 | 5.5 | 0.984 | 0.179 |
| 4 | 5.0 | 0.426 | 0.085 | 3.6 | 0.390 | 0.108 | 3.8 | 0.930 | 0.242 |
| 5 | 5.0 | 0.276 | 0.055 | 3.8 | 0.622 | 0.162 | 4.3 | 0.424 | 0.099 |
| 6 | 9.7 | 0.728 | 0.075 | 2.8 | 0.283 | 0.101 | |||
| 7 | 4.4 | 0.291 | 0.066 | 6.6 | 0.882 | 0.134 | |||
| 8 | 7.3 | 0.546 | 0.075 | 3.2 | 0.287 | 0.091 | |||
| 9 | 9.2 | 0.550 | 0.060 | 2.8 | 0.223 | 0.079 | |||
| 10 | 3.0 | 0.259 | 0.086 | 4.1 | 0.594 | 0.144 | |||
| 11 | 3.6 | 0.303 | 0.084 | ||||||
| Number of Species | 10 | 11 | 5 | ||||||
| Average | 5.9 | 0.429 | 0.073 | 4.3 | 0.461 | 0.106 | 4.8 | 0.867 | 0.180 |
Species
| P 1 : Konosirus punctatus | O 4 : Trachurus japonicus |
| P 2 : Etrumeus micropus | O 5 : Scomber japonicus |
| P 3 : Engraulis japonica | O 6 : Sillago sihama |
| P 4 : Sardinops melanosticta | O 7 : Girella punctata |
| P 5 : Spratelloides japonicus | O 8 : Siganus fuscescens |
| P 6 : Clupea pallasi | O 9 : Platycephalus indicus |
| P 7 : Harengula zunasi | O 10 : Chelidonichthys kumu |
| P 8 : Cololabis saira | O 11 : Fugu rubripes |
| P 9 : Hemiramphus sajori | |
| P 10 : Oplegnathus fasciatus | F 1 : Seriola aureovittata |
| F 2 : Seriola quinqueradiata | |
| O 1 : Mugil cephalus | F 3 : Seriola purpurascens |
| O 2 : Ammodytes persanatus | F 4 : Katsuwonus pelamis |
| O 3 : Ilisha elongata | F 5 : Gadus macrocephalus |
(B) Data reported by Uchida (1958)
| Species | P | O | F | ||||||
|---|---|---|---|---|---|---|---|---|---|
| L | D | D/L | L | D | D/L | L | D | D/L | |
| 1 | 4.8 | 0.269 | 0.056 | 4.0 | 0.520 | 0.130 | 5.5 | 1.025 | 0.186 |
| 2 | 6.9 | 0.676 | 0.098 | 6.6 | 0.884 | 0.134 | 5.1 | 0.549 | 0.108 |
| 3 | 10.4 | 0.730 | 0.070 | 3.3 | 0.236 | 0.072 | 5.5 | 1.007 | 0.183 |
| 4 | 5.9 | 0.508 | 0.086 | 3.6 | 0.318 | 0.088 | |||
| 5 | 4.4 | 0.372 | 0.085 | 4.1 | 0.614 | 0.149 | |||
| 6 | 7.4 | 0.485 | 0.066 | ||||||
| 7 | 10.7 | 0.550 | 0.051 | ||||||
| 8 | 3.0 | 0.310 | 0.103 | ||||||
| Number of Species | 8 | 5 | 3 | ||||||
| Average | 6.3 | 0.488 | 0.077 | 4.5 | 0.514 | 0.115 | 5.4 | 0.860 | 0.159 |
Species
| P 1 : Konosirus punctatus | O 1 : Scomber japonicus |
| P 2 : Etrumenus micropus | O 2 : Girella punctata |
| P 3 : Clupea pallasi | O 3 : Siganus fuscescens |
| P 4 : Sardinops melanosticta | O 4 : Fugu rubripes |
| P 5 : Harengula zunasi | O 5 : Chelidonichthys kumu |
| P 6 : Cololabis saira | |
| P 7 : Hemiramphus sajori | F 1 : Seriola aureovittata |
| P 8 : Oplegnathus fasciatus | F 2 : Seriola quinqueradiata |
| F 3 : Seriola purpurascens |
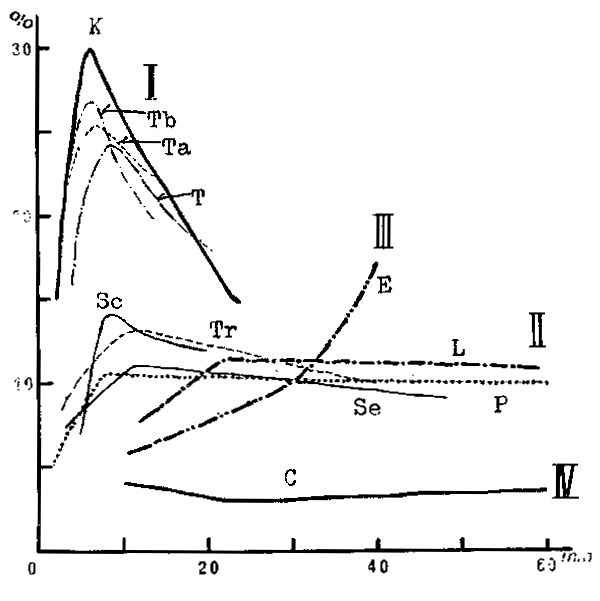
Figure 4
Relative growth of upper jaw against body length during larval and post-larval stages by the type of fish (Shirota, 1975).
| Group I. | T: Thunnus thynnus, Ta: T. alalunga, Tb: T. albacares, |
| K: Katsuwonus pelamis | |
| Group II. | Se: Seriola quinqueradiata, Tr: Trachurus japonicus, |
| Sc: Scomber japonicus, L: Lateolabrax japonicus | |
| P: Pagrus major | |
| Group III. | E: Engraulis japonica |
| Group IV: C: Cololabis saira. |
Mathematical expressions :
The initial stock biomass (Wo) is given by:
| Wo = No wo | ….(1) |
where No : initial stock number
and wo : body weight of a fish.
Assuming that all the brood hatch simultaneously and the stock weight changes due to cannibalism to the biomass W1, (assumed to take place simultaneously),

where r: food efficiency.
After a second cannibalism the stock biomass would be

hence the stock biomass after n-th cannibalism is given by:

The change in Wn against n for various r is shown in Figure 5.
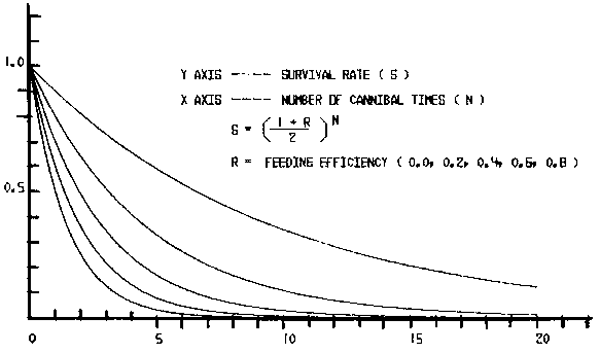
Figure 5
Change in the relative stock biomass over the initial stock biomass (Wn/Wo) against the number of cannibalism (n) for various values of feeding efficiency (r).
It may be appropriate to assume that the amount of food intake would be proportional to the time sequence, that is, the increase in the weight of larvae by rwo by one cann- ibalism means that the (1 + r)wo food would be taken in at the next cannibalism. Assuming that the time interval among each cannibalism would be prolonged by (1 + r) times, the timing of the n-th cannibalism (tn) would be

where d : initial time interval, tl = 0 and r 0. Hence

The time sequence function of the stock biomass is given by putting the above notation into equation (2)

where a 0 as 0 r 1 and a = b. That is to say that the stock biomass (Wt) is noted as a negative power function of time sequence (t). A trial application of the above function was made to the data for yellowtail around Japan. Adopting that the r of yellowtail in rearing condition is about 0.25 (Ichimura, 1978) and assuming that the growth in length during the post-larva stage is about double, the increase in weight would be about 8 times. Therefore
Wn/Wo = (l+r)n = 8 and n = 9.3
This indicates that about 9–10 cycles of cannibalism would take place for the larvae which survived to the post-larval stage. The survival rate during the same period is accordingly estimated to be:

which accords well with the global estimate of larval survival, about 1/1,000.
Larval mortality by predation by carnivorous plankton
It is well known that plankton play an important role in the food chain as the primary food for other animals in marine environment. The converse function i.e. the feeding by plankton on the eggs and larvae of fish has, in contrast, paid little attention to popula- tion studies. There have been, however, many records of predation of carnivorous plankton on fish larvae which made the authors propose their new hypothesis. Documental predators are, for example, medusae, ctenophora, chaetognatha and annelida on herring (Lebour, 1923), Noctiluca on anchovy (Hattori, 1962), Sagitta on sand lance (Hamada, 1965), jellyfish on sprat (Fraser, 1969) and copepod on anchovy (Lillelund et al., 1971).
The authors (Kawai and Ishibasi, 1981) estimated the relative abundance of four major carnivorous plankton species (Medusae, Polychaeta, Chaetognatha and Amphipoda) around Japan based on the data reported by Yamazi (1971). The result obtained was surprisingly large, about 15–20 times the abundance of fish eggs and larvae, and was implied by the large effect of predatory loss of fish larvae.
Mathematical expressions:
The stock number (Nt) and individual body weight (wt) change during the critical period as
Nt = Noe-Mt and
wt = wo + ct
where: No and wo are initial stock number and body weight,
M : the natural mortality coefficient which may be proportional to the abundance of carnivorous plankton,
and c : coefficient of growth which may be proportional to the abundance of food. The stock biomass (Wt) is given from these formulae as
| Wt = Ntwt = Wo (1+Gt)e-Mt | ….(5) |
where G denotes the rate of weight increments against the initial body weight (c/wo) in which an approximation with linear growth function is applied here for the rather short time interval during the critical stage. To identify the changes in the stock biomass in connection with the changes i M, the following quations are derived from equation (5):
assuming:

the maximum stock biomass Ws and the time when Ws is realized are given by

which implies that Wt converges to 0 as t approaches infinity. The coordinates of the turning point (th, Wh) are given by
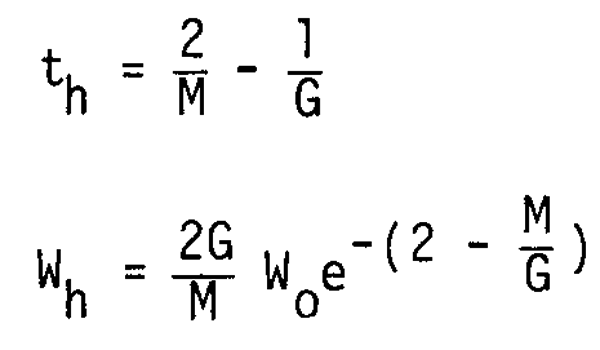
The curves of Wt/Wo against t are shown in Figure 6 for various values of M.
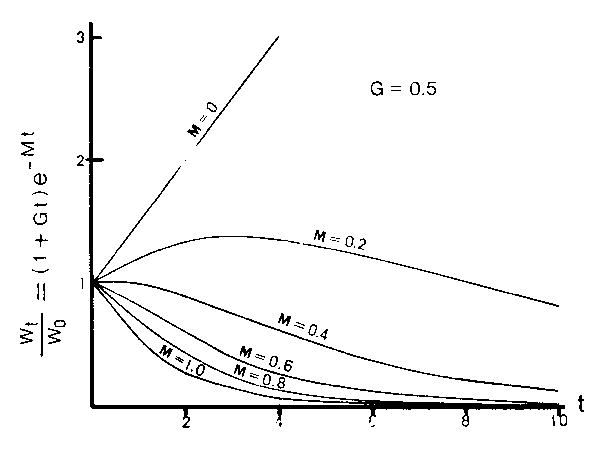
Figure 6
Change in the relative stock biomass over the initial biomass (Wt/wo) against time sequence (t) for various natural mortality coefficient (M). G denotes the rate of weight increments over the initial body weight (c/Wo) where c is the coefficient of growth.
Equation (6) or Figure 6 shows that Wt < Wo is realized somewhere under the condition of M G and vice versa. It is generally accepted in the natural condition that the pro- bability on encountering with feed is larger than that with predator. The stock biomass might therefore be increased slightly to Wt < Wo, which is quite in contrast with the case in cannibalism where Wt never increased, then M G would be realized which gives the condition of the upper limit of M. It is likely, on the other hand, that the stock biomass would decrease than the initial size (Wo) at the end of the critical period even though Wt increased somehow at intermediate stages. The stock biomass at the end of the critical period (for the entire time interval of) is given as
WT = Wo (1 + GT)e-MT
WT Wo hence

The above notation gives the condition of the lower limit of M.
The body length of larvae grows generally about double during the post-larvae period and the body weight grows accordingly to 8 times during the same period as
Wo + cT = 8 wo
hence

the possible range of M is therefore given by
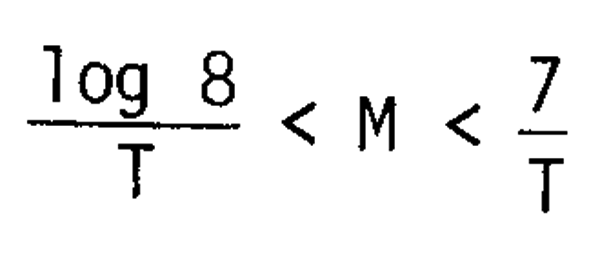
or in survival rate (S), as
0.0009 < S < 0.125
since

The range of the survival rate obtained here for planktivores appears to be well balanced with that of piscivores (about 1/1,000) and also well balanced with the general information on the larval mortality of this type of fish.
Discussion of the hypothesis
It has been widely accepted by many scientists that several unfavourable conditions in the environment such as oceanographic or meteorologically bad conditions, lack of feed and predatory loss by other fish would be the major causes of larval mortality. It may be true that a combination of these factors may play substantive roles, however, the authors doubt whether these factors or the combination of them have definitely been the major causes for the larval mortality which definitely causes the 99 percent loss every year.
The relationship between the change in the oceanographic/meteorological conditions and the definite loss of fish larvae observed every year has remained very vague with the exception of a few special occasions such as drastic changes in upwelling, sea currents, sea-ice formation and water temperature etc.
It is generally said that the plankton biomass would be about 10 times larger than that of all the fish, including adults, to be supplied as feed. Even if we assume that the feed for fish larvae comprises mostly copepod nauplii, it is quite unlikely that an extra- ordinarily severe condition of food supply for fish larvae would occur every year to make 99 percent fish larvae starve to death when the fact that copepod biomass accounts for several tens percent of total plankton biomass is taken into account.
It is also reasonable to consider that the predatory loss to other fish would be one of the major causes of massive larval mortality. It may be unlikely that other fish would feed selectively on fish larvae during their critical period which is of a rather short duration, 2–3 months at most for the entire spawning period. Fish larvae may be taken by other fish together along with the other planktonic organisms. The massacre of fish lar- vae by only other fish is therefore quite unlikely to have happened considering the enormous amount of plankton biomass.
It is concluded that the above-mentioned environmental conditions are supplementary, though there is no doubt on the existence of substantial negative effects by them, and the authors have found it more reasonable to hypothesize that cannibalism among the same fish larvae and the predatory loss by carnivorous plankton would be the major causes of the larval mortality of piscivores and planktivores respectively. The former cause functions as a density-dependent factor while the latter as a density-independent factor, which also gives a logical coincidence with the facts that the abundance of piscivorous stocks fluc- tuate less than that of planktivorous.
APPLICATION OF THE HYPOTHESIS TO THE STOCK ASSESSMENT OF NERITIC FISH RESOURCES AROUND JAPAN WITH SPECIAL EMPHASIS ON THE CHANGE IN SPECIES COMPOSITION
Review of the change in species composition
The historical change in the species composition in the nominal catch of neritic pelagic fish is shown in Figure 7 by major sea region around Japan for the past 80 years. In the figure the component of each species is placed from the bottom to the top in accordance with their body size (smaller to larger), to enable the reader to understand the authors' discussion more easily thereafter.
Generally speaking, smaller species are located at a lower position in the food chain. In fact, the specimens of larger fish, even though smaller stages of them - larvae and fry - has scarcely been found in the stomach of smaller fish. A few examples of this type of phenomena is given in Figure 8, which shows clearly the predominance of larger species over smaller species. A notable phenomenon observed, in addition to the principles mentioned above, is that a certain size species depends not only on the species located just beneath but also all the species of ecologically lower levels. This is somewhat different in prin- ciple, from the hierarchy on species (compilation of dependency between the neighbouring two species - from top to bottom) which has been widely accepted by scientists so far.
Until around 1950 almost no substantial change in species composition was observed in the nominal catch record in each of the regions (Figure 7). This may partly be due to the fact that the fisheries and fishing activity before World War II were not sufficiently fully developed to reflect changes in resources by their catch. It appears, in contrast, that the recent fishing activities would reflect fairly well the change in the major components of the entire exploitable resource in accordance with the development of fishing techniques and the expansion of fishing grounds.
Secondly, it is noted that the change in dominance was taking place generally from smaller species to larger ones (from lower to upper in Figure 7), in each of the regions during nearly the same periods, although the specific species changed are different among the regions. For instance, the dominance was switched from (1) sardine-jack mackerel- mackerel in turn in the Western Japan Sea Region, (2) sardine-saury-mackerel in the Northern Pacific Region and (3) sardine-jack mackerel-mackerel in the Southern Pacific Region, which are all changes from smaller to larger species (lower to upper in Figure 7). The only ex- ception is the recent burst of sardine observed again in each region which will be discussed later.
Among these, changes in the Southern Pacific Region are relatively moderate to the other two regions. The region is located at the southernmost area where the warm “Kuroshio” current prevails. The authors assume that the multi-species nature in warmer waters in the region is well represented in this phenomenon, which may have more or less stabilized any potential changes in species composition. The total amount of the pelagic fish catch in the Southern Pacific Region also shows the most stable trend among the three regions.
Hypothetical consideration on the change in species composition
As was mentioned above, the dominant species have changed from smaller to larger spe- cies in all the regions during 1940 to the early 1970's. The authors eventually found that the changes in species were accompanied by changes in the locations of spawning-nursery grounds from nearshore to offshore waters, which involves an important implication with key factors in the changes in species composition in connection with the hypothesis proposed by the authors.
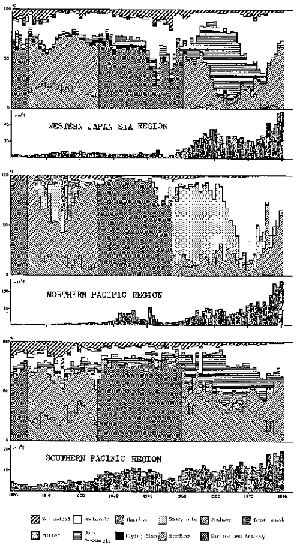
Figure 7
Historical change in the total catch and species composition of neritic pelagic fish around Japan by major sea region.
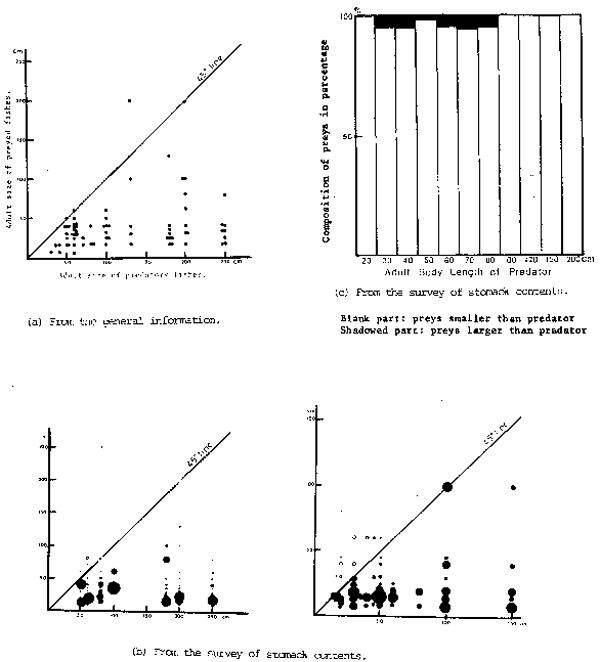
Figure 8
Comparison of body sizes between preys and predators. Data employed were cited from Hayashi et al., 1960, Kudo et al., 1969, Matsubara et al.,1965, Matsumiya 1980, Mikawa 1952, 1955, Misu 1964, Nishimura 1959, Okada 1970, Omori 1980, Saishu et al., 1965, Sato 1975, Toriyama 1958, Yamada et al., 1966, and Yokota et al., 1956, 1961.
The coastal species, such as sardine, are more advantageous than further offshore species to maintain the dominancy, in terms of nutrient condition, if nothing happens to them. If carnivorous plankton blooms in coastal waters simultaneously with the February to April spawning of coastal fish species, a massacre would occur of the larvae which would surely weaken year-class strength. At the same time, a substantial amount of feed plankton is produced as a result of the above-mentioned process. The authors assume that the species, which occupy adjacent areas and which have inherent potential to bloom could eventually colonize and become dominant in coastal areas. If the new species gains further strong reproductive power, it could gradually take over the entire range where the former dominant species prevailed. It should be noted that changes in species composition could have been initiated by the changes in year-class strength which declined in the former species and are reinforced in the new species. Such cyclic processes might occur repeatedly over several decade intervals, and the dominant species would have changed in turn.
The recent change in the dominance from mackerel to sardine may have followed a some- what different process as both the body sizes and habitats of these two species are re- verse from the above-mentioned general pattern. Mackerel is considered to be the outer- most species among the abundant pelagic fish species along the Japanese coast and there were no further offshore species when mackerel dominated the coastal waters around Japan. The authors assume therefore that sardine took over the unoccupied area when mackerel stocks had declined due to extraordinarily large predatory loss of the larvae by the bursts of carnivorous plankton. The authors are unable, however, to say much about the inevitability of the bursts of the sardine, which is the most coastal species in the authors' categorization, compared to the other coastal species. A notable phenomenon was the ob- servation that the change from mackerel to sardine took place throughout the coastal waters around Japan during nearly the same period.
It is interesting to note the fact that the species which have become dominant are limited to only a few species among many pelagic planktivores, though these are widely distributed around Japan. A typical exclusion is anchovy. The authors consider that the mobility and migratory nature of the selected species may have played a substantive role in the above-mentioned process. Indeed, mobile fish advantageously quickly take over the surplus area rather than less mobile species.
Sardine, currently dominating all Japanese waters, will likely be dominated by some other species some time later. The authors are unable to predict the next species to dominate as it is impossible to assume which species will be distributed in bordering offshore areas at the time of the next crisis for sardine larvae.
Supplementary analysis on carnivorous planktons
A comprehensive survey of plankton and fish larvae was carried out during 1965 to 1967 (Yamazi, 1971). Data on the distribution of the biomass of total zooplankton, carnivorous plankton and fish larvae collected during the survey is shown in Figure 9. The distribution pattern of carnivorous plankton shows a proportional trend to that of fish larvae which suggests the aggregative function of predatory plankton to the concen- tration of fish larvae.
Table 2 gives the annual change in the abundance of a typical carnivorous plankton, Chaetognatha in the southern coastal waters of Japan, where major spawning grounds of major planktivores are located, during Janaury to April every year when most of the spawning takes place. It is interesting to see that the timing of the three peaks of the abundance of Chaetognatha namely 1960, 1966–67 and 1972–73 coincide well with the periods when dramatic species change took place in the region, namely 1958–60, 1965–67 and 1973–75.
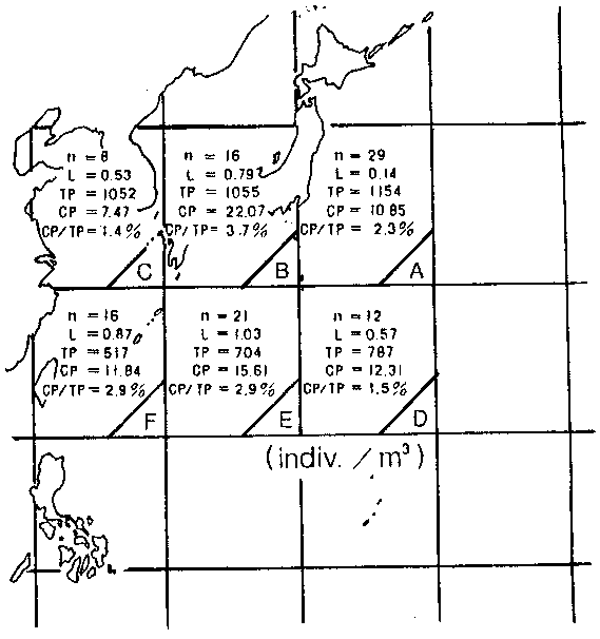
Figure 9
Comparison of the abundances among fish larvae, total zooplanktons and carnivorous planktons in the waters around Japan by 10—degree square area. The data were cited from Yamazi (1971) which were collected during February to May every year for 1965 to 1967.
n : number of observation, L : fish larvae,
TP : total zooplankton, CP : carnivorous plankton.
Another interesting phenomenon has been found in the oceanographic condition which may realize the burst or massive invasion of carnivorous plankton into the coastal waters. Kidachi (1982) reported that the abundance of Chaetognathain spring along the southern coast of Honshu (mainland of Japan) is usually high when the Kuroshio current approaches the coast. The authors analyzed the data on the Kuroshio for 1960 to 1980 and found a trend in that the abundance of Chaetognatha (Table 2), increased when the axis of the Kuroshio tended to approach the coast and vice-versa. The finding implies that the change in dominancy of pelagic fish could possibly take place at nearly the same time along both the Pacific and Japan Sea coasts. It also suggests one possibility of pre- dicting the occurrence of the next burst of carnivorous plankton in coastal waters and accordingly the change in species composition.
A NEW METHOD TO ASSESS THE STATE OF STOCKS ACCOMPANIED BY LARGE FLUCTUATIONS
Apart from the change in species composition, it is concluded that the assessment of stocks, which are usually accompanied by large fluctuations in abundance, is difficult using traditional methods. For instance, the catch of sardine exceeded 3 million tons in recent years but was less than 10,000 tons only 15 years ago and the traditional methods have been almost of no use for such a drastic change in abundance. It is now generally accepted among Japanese scientists that the sardine stocks will decline again some time in the future even if fishing ceases completely. The concept of the SY or MSY is not applicable to such stocks.
The authors think that a new management strategy should be established with a better biological basis and that the establishment of a certain level of abundance would be use- ful as a guidemark to manage the fisheries. The authors propose a new method for use in assessments of such stocks; the analysis of the age at maximum biomass of cohorts (Kawai, 1980).
| Year | Total Number of Chaetognatha (inds.) | Average Number of Chaetognatha (inds./10 m3) |
|---|---|---|
| 1960 | 1 940 | 138.6 |
| 1961 | 1 710 | 61.1 |
| 1962 | 733 | 40.7 |
| 1963 | 1 104 | 50.2 |
| 1964 | 1 097 | 54.9 |
| 1965 | 1 316 | 50.6 |
| 1966 | 2 118 | 78.4 |
| 1967 | 1 908 | 61.5 |
| 1968 | 656 | 36.4 |
| 1969 | 282 | 40.3 |
| 1970 | 872 | 37.9 |
| 1971 | 293 | 32.6 |
| 1972 | 1 497 | 59.9 |
| 1973 | 790 | 60.8 |
| 1974 | 263 | 43.8 |
| 1975 | 241 | 34.4 |
| 1976 | 437 | 54.6 |
| 1977 | 417 | 46.3 |
| 1978 | 292 | 22.5 |
| 1979 | 689 | 53.0 |
| 1980 | 978 | 57.5 |
Mathematical expressions:
In the estimation of the age at maximum biomass of a cohort (ts), the biomass of a year-class after the critical period (Wt) is given by
Wt = wt Nt
= W∞ (1 - e -kt)3Noe -Mt
where was denotes the maximum body weight and k growth coefficient. The age (ts) at the maximum Wt is given under the condition of dW/dt = 0 as,
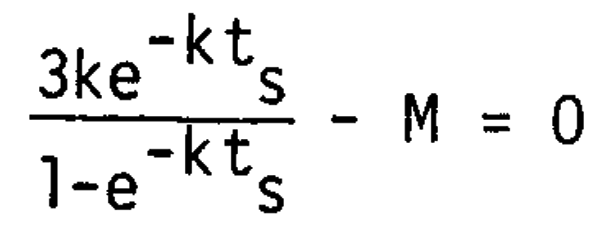
hence

The age (ts) can therefore be determined by k and M. However, some modification of the function is better from the practical point of view as k and M usually are unstable conditions. Kawai (1970) reported that the growth coefficient (k) can be approximated from the age at first maturity (tm) by

Tanaka (1960) proposed the approximation of the relationship between M and lifespan (t) to be

substituting these relations into equation (9), ts is now given as

The age at maximum biomass can, therefore, be estimated from the age at first maturity (tm) and lifespan(to).
It was ascertained, after the investigation of about 30 marine fish species, that there is a general rule that
ts > tm
which may be a rationale in reproductive potential maintenance.
More importantly, the distribution of ts is concentrated in a zone around 1/3 of the interval between t and tm as is shown in Figure 10. On average the relationship is given as

It is surprising to find that the relationship is commonly observed, irrespective of fish species (variation of to and tm) which may be derived from the close relationship among the three ages and their potential effects throughout fish species.
When the mortality coefficient is increased/decreased by a difference, the age at maximum biomass changes to (ts) as

The difference between ts and ts is

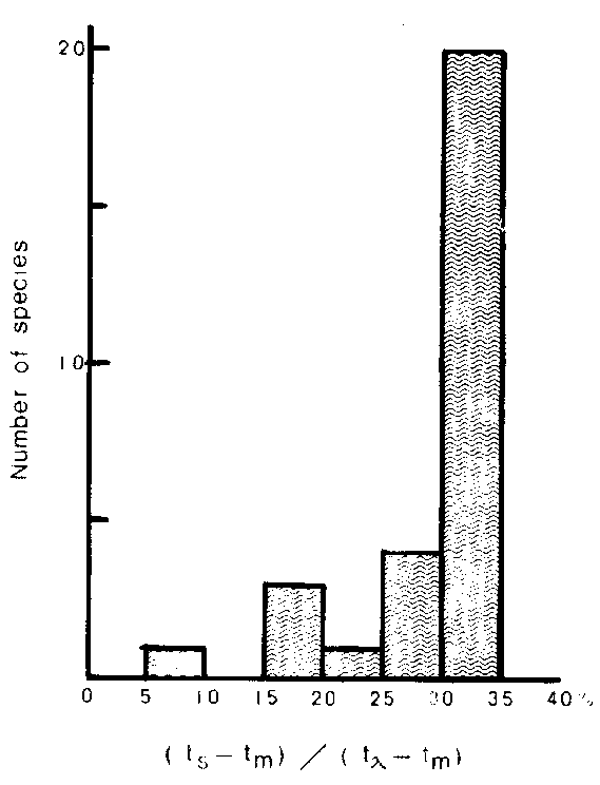
Figure 10
Frequency distribution of the number of species against the relative position of the age at maximum biomass (ts) over the ages at first maturity (tm) and lifespan (tλ).
that is
α > 0, ts < ts
and
α < 0, ts > ts
In other words, the age at maximum biomass decreases in accordance with the increase in mortality. If mortality is seriously increased, ts approaches rapidly to tm and would even surpass it in an extreme case which is considered to be a badly deteriorative condi- tion for the cohort for future reproduction.
The condition under which ts = tm are given from

hence

The average value of to/tm for the 30 species examined is 2.626, putting this into equation (13).
α = 1.018 M
which indicates that the age at maximum biomass decreases equivalent to the age at first maturity when the mortality coefficient is increased to about double, for any reasons, of the usual value under stable natural conditions.
APPLICATION TO SARDINE STOCKS AROUND JAPAN
As was discussed, the age at maximum biomass (ts) is much larger (older) than the age at first maturity (tm) when the stocks are under normal conditions and decreases when the stocks decline for any reason. Observation of the value of ts and changes in comparison to tm in a given stock, is therefore a good measure to assess the state of the stock. The time series data on the relative position of ts could give us the magnitude of the changes occurring. It should be noted here that the increase in mortality is not necessarily de- fined/limited to specific origins. Whatsoever causes the loss of a cohort, natural or artificial, should be taken into account as the factor on changing the position of ts. Figure 11 shows an example of the preliminary application of the new method to the sardine stock around Japan. The value of ts (= 4.0) denoted in the figure indicates the value es- timated by equation (10) in the previous section, which is the valsue under othe normal condi- tion of the stock being determined by tm and to, while the observed value (ts) for each of the year-classes is shown by the abscissae of the peaks on age compositions in weight.
It is apparent that ts was far below (younger) than tm during the poor catch period, (year-classes 1948–50) which indicates seriously deteriorated status of the reproductive potential of the stock. It, however, is larger again when the stock abundance began to recover after the early 1970's and is equivalent to or even surpasses the value of tm in recent year-classes (1975–77 in a favourable catch period) which clearly shows the stable and quite favourable status of the stock. The authors believe this type of analysis would be one of the useful methods when it is established through further studies to clarify the problems on both the theoretical and practical aspects (data collection etc.).
DISCUSSION
Apart from the discussions on the technical aspects of the proposed hypotheses speci- fied at the end of each section, the authors intend to present here some considerations from a broader perspective.
Comparative analysis with demersal fish stocks
Drastic changes in species composition in demersal fish stocks has rarely been ob- served. In some boreal areas a single species sometimes predominates over the other spe- cies, e.g. Alaska pollack in the eastern Bering Sea and Okhotsk Sea, but its dominancy has not changed. In temperate areas, on the other hand, no single dominant species overwhe lms the other and changes in species composition usually take place in gradual and moderate progression. The authors assume that these phenomena would have derived from the nature of larval mortality of those species.
Demersal fish are generally omnivores which feed on a variety of organisms such as plankton, benthos, fish, molluscs, crustacea etc. The authors consider that the mechanisms and processes of larval mortality for demersal fish are much more diverse than those of planktivores and piscivores which are placed at the extreme - both ends of the feeding habit of fish. In other words, the fish located at the intermediate position of feeding habit might have attained the diversity in larval mortality for which the extreme functions such as cannibalism and predation by carnivorous planktons are not general.
On the other hand, the rapid and drastic changes in abundances of planktivores would not have taken place if some density-independent impact did not affect the larvae during their critical stage. The abundance of piscivores would have been comparatively stable in this regard, density - dependent loss during the critical stage, and changes in dominance have rarely been observed. The diversity of larval mortality of demersal fish might also be one of the major reasons preventing drastic changes in abundance or species composition.
Another feature of demersal fish is that often demersal fish groups are rich in spe- cies as a community. It is imaginable that such variety would have also functioned to prevent the drastic changes at both the species and community levels. Figure 12 shows an example of a very stable status of year-class strengths of branquillos taken from Japanese waters, from the same criterion as given in Figure 11 in regard to ts, ts and tm. The spe- cies composition of the catch also shows a stable trend. The authors assume that the “Diversity-Stability Rule”, which is commonly applied to terrestrial ecological studies, would also be applicable to marine teleosts.
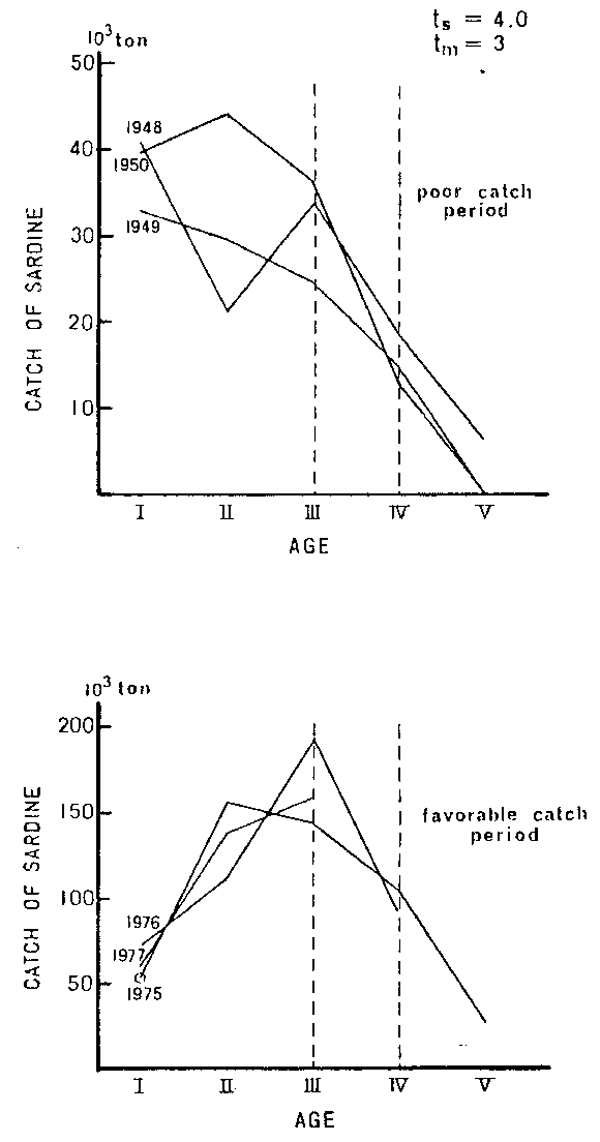
Figure 11
Change in the age composition in weight of the selected year-classes of Japanese sardine in comparison with the ages at first maturity (tm) and at maximum biomass(ts). The value of ts = 4.0 denoted in the figure was estimated by equation (10) in the text which was de- termined by tm and to under the normal condition of the stock, while the observed value of the age at maximum biomass (ts) for each year-class is shown by the abscissa of the peak of each age composition figure.
Change in dominance on a world-wide scale
The authors analyzed the changes in dominance observed in many productive waters in the world from a comparative basis, in which the diversity index was applied to the species composition in each of the FAO Fishing Areas (Kawai et al., 1983). The authors found that diversification has occurred in many areas since 1965 and an area, where a reverse trend was shown, was scarcely found. Secondly, two major zones of the world oceans were identi- fied, namely the Western Pacific and the Eastern Atlantic, which were considered to have experienced similar phenomena in changes in the prominent species biomass there, and sub- sequent dramatic changes in species composition occurred. The authors assume that these phenomena and the long-term trends in these are similar in nature even though they are separate, independent processes, with different species, timing and magnitudes. It is therefore concluded that the principles involved result from usual evolutionary processes in marine teleosts, and that the changes in species composition would be a typical cha- racteristic of neritic pelagic fish resources.
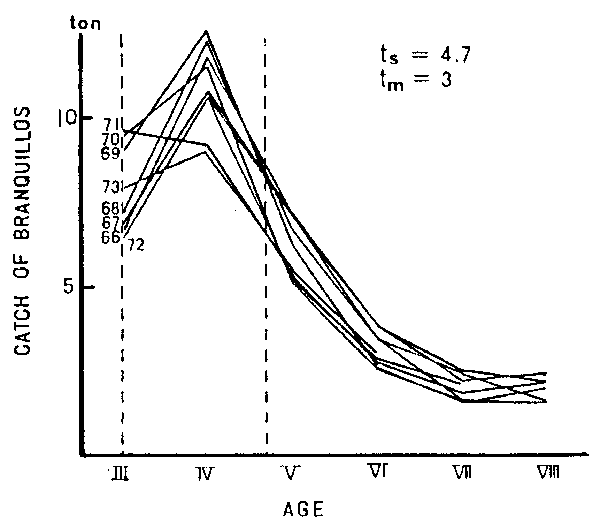
Figure 12
Change in the age composition in weight of branquillos for the year-classes 1966–72 caught along the Japanese coast. See the notes in Figure 11 for the notation and interpretation.
It is also hypothesized that if drastic changes in dominance are mostly due to carnivorous plankton in connection with the change in the oceanographic conditions, and if such conditions are cyclically-realized on a global bais. there would be a firm rationale for the coincidence of such phenomenon on a world-wide scale.
Future studies
The authors have identified the following issues needing to be taken into account in order to validate the proposed hypotheses and in order to eventually develop methods to be applied to stock assessment of neritic pelagic fish resources for management purposes.
(1) Consideration of the evolutionary aspects of fish should be more intensively in- corporate into all studies. It is the authors' view that the dramatic changes in species composition will take place repeatedly in the future and any direct measure to control them will not be applicable in the immediate future. Clarification of their nature, principles and roles are, therefore, considered to be of basic import- ance.
(2) More observation and analysis should be carried out specifically on the inter- specific rfelationships among ofish and plankton.
(3) Comparative studies of the phenomena observed in different areas should be inten- sified. There is no doubt that such studies would improve understanding of both local and general processes, as well as othe differences in species, biological and environmental conditions resulsting from such processes.
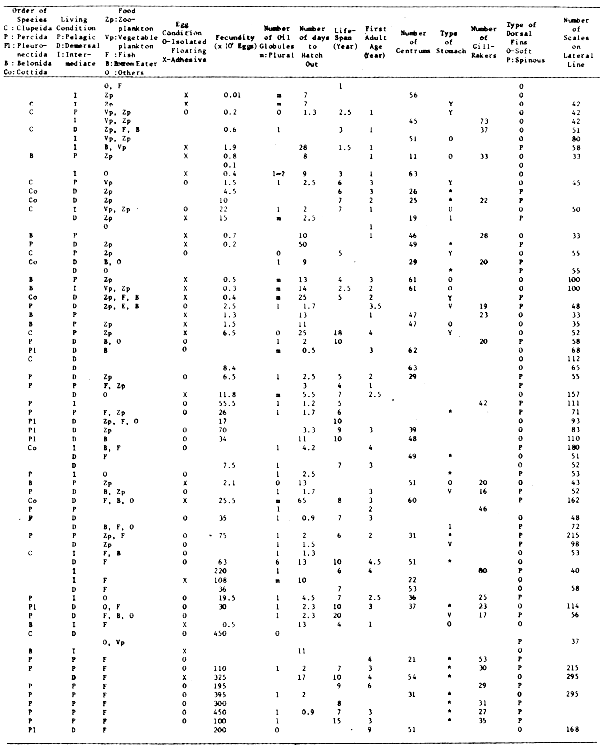
Appendix1 Important biological features of the major 75 species of Teleostei occurring in the waters arosund Japan.
| Japanese Name | Scientific Name | Body Length in Adult (cm) | Diameter of Egg(mm) 0-Isolated Floating x-Adhesive | Body Length at Hatch Out (mm) | Body Length at 1 Age (cm) | Biological Minimum Size (cm) | Number of days to Hatch Out |
|---|---|---|---|---|---|---|---|
| Tatunootosigo | Hippocampus coronatus | 8 | 9.0 | 8 | |||
| Siwaikanago | Hypoptychus dybowskii | 9 | 1.8 x | 7 | |||
| Kibinago | Sprapelloides Japonicus | 10 | 1.2 x | 4.6 | 7 | ||
| Katakuchiiwashi | engraulis Jatonaca | 15 | 1.1 0 | 2.6 | 11 | 8 | 1.3 |
| Sappa | Harengula Zunasi | 15 | |||||
| Nagisu | Glossalodon Semifasciatues | 20 | 1.5 | ||||
| Kurumesayori | Hemiramphua Kurenvus | 20 | 1.4 | ||||
| Mahaze | acanthogobius Flavimanus | 25 | 0.8 x | 28 | |||
| Ariaketobiuo | Cypselurus Starksi | 25 | 1.7 x | 5.2 | 25 | 25 | 8 |
| Yoziuo | Syngnathus Schlegeli | 25 | 9.5 | 21 | |||
| Ikanago | Ammodytes Personatus | 25 | 0.7 x | 4.0 | 10 | 9 | |
| Maiwasi | Sardinaops Melanosticpa | 25 | 1.4 0 | 16 | 15 | 2.5 | |
| Mebaru | Sebastes Inermis | 25 | 9 | 16 | |||
| Kasago | Sebastiscus marmoratus | 25 | 7 | ||||
| Kanosiro | Konosarus Punctatus | 25 | 1.5 0 | 3.3 | 15 | 15 | 2 |
| Kawahagi | Stephanoleps Cirrhifer | 25 | 0.7 x | 2.0 | 2.5 | ||
| Umitanago | Diterema Temmincki | 30 | 12 | ||||
| Hosotobi | Cypsenerus Opisthopus Haraii | 30 | 1.6 x | 4.8 | 10 | ||
| Hata | Aretoscopus Aaponacus | 30 | 2.0 x | 9.0 | 7 | 16 | 50 |
| Urumeswasi | Etrumeus Micropus | 30 | 1.3 0 | 3.8 | 14 | ||
| Kitizi | Sebastolovus Macrochir | 30 | 1.2 0 | 2.6 | 9 | 17 | 9 |
| Ibodai | Psenopsis Anomala | 30 | |||||
| Sanma | Cololavis Saira | 35 | 1.6 x | 7.3 | 20 | 13 | |
| Sayori | Hemiramphus Sagori | 35 | 2.2 x | 7.2 | 20 | 25 | 14 |
| Ainame | hexagrammos Otakii | 35 | 2.1 x | 7.4 | 15 | 19 | 25 |
| Kidai | Dentes Tumifrons | 35 | 0.9 0 | 1.7 | 15 | 1.7 | |
| Tukusatoviuo | Cypselures Heterurus Doverleini | 35 | 2.5 x | 5.6 | 20 | 13 | |
| Tobiuo | Prognichthys Agoo | 35 | 1.5 x | 4.9 | 11 | ||
| Nisin | Clupea Pallasi | 40 | 1.5 x | 7.2 | 15 | 22 | 25 |
| Tadai | Evynnis Japonaca | 40 | 1.0 0 | 2.1 | 11 | ||
| Inunosata | Cynoglossus Robustus | 40 | 0.9 0 | 1.8 | 14 | 23 | 0.7 |
| Gisu | Pterothrissus Gissu | 40 | 16 | ||||
| Tokogeeso | Sauriva Elongata | 40 | |||||
| Kinguti | Pseudosciaena Manchurica | 40 | 1.5 0 | 3.4 | 8 | 20 | 2.5 |
| Gomasava | Seomber Eapeinocephalus | 40 | 28 | ||||
| Komai | Eleginus Gracillis | 40 | 0.9 x | 2.5 | 20 | 25 | 5.5 |
| Isaki | Parapristipoma Trilineapum | 40 | 0.9 0 | 1.6 | 13 | 1.2 | |
| Maazi | Trachrus Japonicus | 40 | 0.9 | 2.5 | 11 | 20 | 1.7 |
| Akagarei | Hippoglossoides Dubius | 40 | 1.5 | 13 | 30 | ||
| Souhatigarei | Cliisthenes Herzensteini | 40 | 0.9 0 | 3.0 | 8 | 18 | 3.3 |
| Vabagarei | Microstomus Achne | 40 | 1.8 0 | 4.3 | 10 | 11 | |
Hō ō ō | Chelidonichthys Spinosus | 40 | 1.2 0 | 3.2 | 12 | 27 | 4.2 |
| Maeso | Saurida Undosquamis | 45 | 11 | ||||
| Kuroguti | Argyrosomus Nive | 45 | 0.9 | 11 | 25 | ||
| Mezina | girella Punctata | 50 | 1.0 0 | 2.3 | 11 | 2.5 | |
| Hamatoviuo | Cypselures Pinnatidarvatus Gaponicus | 50 | 2.50 x | 5.2 | 13 | ||
| Kurodai | Acanthopagrus Sehlegeli | 50 | 0.9 | 2.0 | 12 | 19 | 1.7 |
| Hokke | Pleurogrammus Azonus | 50 | 2.5 x | 10.0 | 21 | 65 | |
| Maresooda | Auxis Tapeinosoma | 50 | 1.0 | 2.7 | 25 | 27 | |
| Siroguti | Argyrosomus Argenpatus | 50 | 0.8 0 | 1.5 | 15 | 20 | 0.9 |
| Akaamadai | Vranchiostegus Japonicus japonicus | 50 | 1.0 | 15 | 13 | ||
| Masaba | Scomber Japonacus | 50 | 1.1 0 | 3.0 | 25 | 26 | 2 |
| Isidai | oplegnathus Fasciatus | 55 | 0.9 0 | 2.2 | 1.5 | ||
| Hira | Ilisha elongata | 60 | 2.4 0 | 5.1 | 1.3 | ||
| Suketōdara | Theragra chulcogramma | 60 | 1.5 0 | 3.9 | 15 | 34 | 13 |
| Vora | Mugil Cephalus | 60 | 1.0 | 20 | 40 | ||
| Torahugu | Fugu Rubripes | 70 | 1.3 x | 2.7 | 25 | 10 | |
| Wanieso | Saurida Tumbil | 65 | 1.2 | 18 | 35 | ||
| Suzuki | Lateolavrax Japonicus | 80 | 1.3 0 | 4.5 | 20 | 4.5 | |
| Hirame | Paralichthys Olivaccus | 80 | 0.8 0 | 1.7 | 17 | 48 | 2.3 |
| Madai | Pagrus Major | 100 | 1.2 0 | 2.3 | 12 | 36 | 2.3 |
| Datu | Ablennes Anastomella | 100 | 3.3 x | 12.6 | 47 | 40 | 13 |
| Sabahi | Chanos Chanos | 100 | 1.2 0 | 100 | |||
| Menada | Liza Haematocheila | 100 | |||||
| Tenzikudatu | Tylosurus Melanotus | 100 | 3.4 x | 10.0 | 11 | ||
| Katuo | Aatsuwonus Pelamis | 120 | 16 | ||||
| Vuri | seriola Quinqeradiata | 120 | 1.2 0 | 3.5 | 40 | 69 | 2 |
| Madara | Gadus Macroceehalus | 120 | 1.1 x | 3.9 | 60 | 17 | |
| Binnaga | Thunnus Alalunga | 120 | 0.6 0 | 30 | 87 | ||
| Siira | Coryphaena Hippurus | 180 | 1.5 0 | 4.0 | 70 | 2 | |
| Kihada | Thunnus Albacares | 200 | 1.0 0 | 51 | 110 | ||
| Mevati | Thunnus Obesus | 200 | 0.6 0 | 1.5 | 55 | 100 | 0.9 |
| Kuromaguro | Thunnus Thynnus | 250 | 0.8 | ||||
| Ohyo | Hiepoglossus Stenolepis | 270 | 3.3 | 11.2 | 8 |
REFERENCES
Asami, T. et al. 1967. Studies on the features of yellowtail in spawning and larval period and on the tagging experiments in its juvenile stage. Kenkyu Seika, published by the Agriculture, Forestry and Fisheries Research Council, Tokyo, Japanese Government. 30:1–61.
Fraser, J.H. 1969. Experimental feeding of some Medusae and Chaetognaths. J.Fish.Res.Bd.Canada. 26:1743–1762.
Hamada, H. 1965. Study on relation of food between Sagitta crassa and Ammodytes personatus. Bull.Hyogo Pref.Fish.Exp.St. 3:1–6.
Hattori, S. 1962. Predatory activity of Noctiluca on anchovy eggs. Bull.Tokai Reg.Fish.Res.Lab. 9:211–220.
Hayashi. T. and Y. Yamaguchi. 1960. Study on food niches of the benthic piscivors. Kenkyu Seika, published by the Agriculture, Forestry and Fisheries Research Council, Tokyo, Japanese Government. 2:1–113.
Ichimura, T. 1978. Culture fisheries at the phase of turning point in circumstances. Suisan Shinko. 127:1–21.
Isibasi, K. 1981. Changes of neritic pelagic fish resources around the world. I. Sakana, published by the Tokai Regional Fisheries Research Laboratory. 27:25–34.
Kawai, T.A. 1970. A review and some discussions on growth equation. Bull.Jap.Soc.Sci.Fish. 36(3):289–296.
Kawai, T.A. 1978a. A study of comparative biology on Japanese pisces to population analysis. I. The statistical analysis on the growth of fishes. Bull.Tokai Reg.Fish.Res.Lab. 93:29–43.
Kawai, T.A. 1978b. A study of comparative biology on Japanese pisces to population analysis. II. The statistical analysis on the feeding habits of fishes. Bull.Tokai Reg.Fish.Res.Lab. 96:75–92.
Kawai, T.A. 1979. On the effects of feeding habits of fishes to the fluctuation of fish resources. Rep.Fish.Res.Invest.Japan Gov. pp. 71–84. In Divisional report of demersal fisheries in western region of Japan.
Kawai, T.A. 1980. A study of comparative biology on Japanese pisces to population analysis. IV. The quantitative analysis on biological production of a cohort. Bull.Tokai Reg.Fish.Res.Lab. 103:31–40.
Kawai, T. and K.Isibasi. 1979. A study of comparative biology of Japanese pisces to population analysis. III. A quantitative analysis on the laval mortality by cannibalism. Bull.Tokai Reg.Fish.Res.Lab. 100:79–89.
Kawai, T. 1981. A study of comparative biology on Japanese pisces to population analysis. v. A quantitative analysis on larval mortality devoured by carnivourous plankton. Bull.Tokia Reg.Fish.Res.Lab. 104:55–66.
Kawai, T., K. Isabasi and T. Takahashi. 1983. Changes of nertic pelagic fish resources around the world. II. Sakana. (29):(in press).
Kidachi, T. 1982. On the distribution of macro-plankton in coastal region and Kuroshio. Bull.Coast.Ocean. 19(2)131–148.
Kudo, S. et al. 1989. Food study of bottom fish in continental slope of Tosa-Wan. Bull.Nansei Reg.Fish.Res.Lab. 2:85–103.
Lebour, M.V. 1923. The food of plankton organisms. J.Mar.Biol.Assoc.U.K. 13:70–92.
Lillelund, K. and R. Lasker. 1971. Laboratory studies of predation by marine copepods on fish larvae. Fish.Bull. 69(3):655–667.
Matsubara, K. and A.Ochiami. 1965. Ichthyology (Part II). Tokyo Koseisha-Koseikaku Co. Ltd. 958 p.
Matsumiya, Y. 1980. Stomach contents examination of the piscivorous demersal fishes in Shijiki Bay. Bull.Seikai Reg.Fish.Res.Lab. 54:333–342.
Mikawa, M. 1952. Studies on the digestive system and feeding habit of bottom fishes in the north- estern sea area along the Pacific coast of Japan, Bull, Tohoku Reg.Fish.Res.Lab. 1:20–24.
Mikawa, M. 1955. Studies on the digestive system and feeding habit of bottom fishes in the north- easteern sea area along the Pacific coast of Japan. III. Atheresthes evermanni Jordan et Starks. Bull. Tohaku Reg.Fish.Res.Lab. 4:136–146.
Misu, H. 1964. Fisheries biology on the ribbon fish (Trichiurus lepturus Linne) in the East China Sea and the Yellow Sea. Bull.Seikai Reg.Fish.Res.Lab. 32:1–57.
Nishimura, S. 1959. Foods and feeding habit of the Pacific mackerel in the coastal waters of Niigata Prefecture, Japan Sea in 1958. Ann.Rep.Nihonkai Reg.Fish.Res.Lab. 5:77–87.
Okada, K. 1965. Illustrated encyclopaedia of the fauna of Japan. Tokyo. The Hokuryukan Co. Ltd. 763 p.
Okada, K. 1970. Some observations on the feeding activity of the sharp toothed eel Muraenesox cinereus (Forskal) in the East China Sea. Bull.Seikai Reg.Fish.Res.Lab. 33:47–59.
Omori. M. 1980. Feeding habit of yearling red sea bream (Paqrus major) in Yuya Bay. Bull.Seikai Reg.Fish.Res.Lab. 54:93–109.
Saishu, K. et al. 1965. On feeding habit of Gurnaid Chelidonichthys spinousus (McClelland) in the East China Sea and the Yello Sea. Bull.Seikai Reg.Fish.Res.Lab. 33:47–59.
Sato, Y. 1975. Studies on the life history of the bastard halibut Paralichthys olivaceus (Temmink et Schlegel) near Sendai Bay. Bull.Tohoku Reg.Fish.Res.Lab. 35:15–30.
Shirota. A. 1975. Fresh-marine organisms as living feed for fishes. Tokyo, Koseisha-Koseikaku. 514 p.
Shirota. A. 1978. Studies on the mouth size of fish larvae. II. Specific characteristics of the upper jaw length. Bull.Jap.Soc.Sci.Fish. 44(11):1171–1177.
Suehiro, Y. 1941. A study on the digestive system and feeding habits of fish. Jour.Zool. 10(1):1–301.
Tanaka, S. 1960. Studies on the dynamics and the management of fish populations. Bull.Tokai Reg.Fish.Res.Lab. 28:1–200.
Toriyama. M. 1958. On diurnal rhythm in the feeding activity of Saurida undosquamis (Richardson) and Upeneus bensasi (Temminck et Schiegel). Re.Nankai Reg.Fish.Res.Lab. 9:84–91.
Uchida, K.(ed.). 1958. Studies on the eggs, larvae and juveniles of Japanese fishes. Series I. Fukuoka, Japan. Second laboratory of fisheries biology, Fisheries Department, Faculty of Agriculture, Kyushu University, 187 p.
Yamada, U., M. Tagawa and H. Mako. 1966. On the feeding activity of lizard fish Saurida tumbil in the East China Sea. Bull.Seikai Reg.Fish.Res.Lab. 34:11–25.
Yamazi, I. 1971. Data report and distributional maps of the CSK standard zooplankton samples. Misc.Reps.Nat.Sci.Museum. 6:1–703.
Yokota. T. et al. 1956. On the fish community in the view of feeding habit. Rep.Nankai Reg.Fish.Res.Lab. 3:73–83.
Yokota. T. 1961. Studies on the feeding habit of fishes. Rep.Nankai Reg.Fish.Res.Lab. 14:1– 234.
by
Peter A. Shelton and Michael J. Armstrong
Sea Fisheries Research Institute
Private Bag X2
Rogge Bay 8012
Cape Town
South Africa
Resumen
La dispersión de los puntos observados en stocks de Clupeoides frecuentemente hace que la elección de la curva de reclutamiento sea díficil y arbitraria. El efecto dominante del componente aleatorio (independiente de la densidad) enmascara la relativamente debíl respuesta regulatoria de la población. Si las respuestas regulatorias son ingnoradas completamente, la asesoría para la ordenación a medio tiempo de especies de vida corta debe basarse en información obtenida y de censos de pre-reclutas hechos inmdiatamente antes de que se inicie la actividad de pesca sobre esa clase anual en partícular. Es dudoso que en Sudáfrica se pueda interrum- pir o reducir el esfuerzo de pesca en breve tiempo si se detecta una clase anual pobre. Una estrategia alternativa es elegir una curva de reclutamiento que se ajuste mejor, y usar la medida de los residuos para determinar la probalidad de diferentes rendimientos a varios niveles de mortalidad por pesca. Un enfoque de ese tipo se beneficiará de un entendimiento de cómo los mecanismos compensatorios potenciales pueden influir, aunque sea débilmente, en la forma de la curva de reclu- tamiento. Hay una lista interminable de posibles estrategias compensatorias que pueden ser puestas en evidencia por una población de peces pelágicos. En la sardina de Sudáfrica (Sardinops ocellata) y anchoveta (Engraulis capensis) hay evidencias de que la edad de la madurez y el peso promedio de las gónadas pueden tener un efec- to regulador importante. La geografía del desove así como el comportamiento del cardúmenaje y la distribución, que se evidencian por la capturabilidad, pueden tam- bién afectar la forma de las curvas de reclutamiento. La consecuencia general de una respuesta compensatoria es la de mantener el reclutamiento por encima de la línea del remplazamiento cuando se plotea el stock y los reclutas, y permitir que se pueda obtener un rendimiento relativamente alto a niveles de biomasa bajos. Si se permite que la captura exceda la capacidad de compensación de la población, entonces el colapso será rápido siguiendo la pendiente de la parte izquierda de la curva de reclutamiento. Cuando se para la explotación, los mecanismos depensa- torios por debajo del nivel de la línea del remplazamiento pueden evitar que la población se recupere inmediatamente. El incremento de la presión predatoria debi- do a una división de los cardúmenes, agregada a un cambio en el mecanismo de preda- ción a un nivel poblacional menor, que pueden conducir a la creación de un segundo nivel de equilibrio. El hecho de que la biomasa de la sardina Sudáfricana se haya estabilizado a un nivel de biomasa reducido después de su gran caída en los años 1960s, a pesar del hecho que el esfuerzo es dirigido hacia la captura de esta espe- cie para enlatado, puede ser una evidencia circunstancial de un segundo equilibrio.
INTRODUCTION
In clupeoid stocks the observed scatter of point often makes the choice of a recruitment curve difficult and arbitrary. The dominant effect of the variable density- independent component masks the relatively weak population regulatory responses. It has been estimated by MacCall (1980) that in Engraulis mordax the density-dependent coefficient in recruitment is only one-tenth the density-independent coefficient.
If the weak, underlying population regulatory response is ignored entirely then medium-term management of short-lived species must give way to information gained from a prerecruit census immediately prior to the start of fishing activity on the particular year class. In the South African context it is doubtful whether fishing effort could be sufficiently reduced at short notice if a weak year class were detected. The alternative strategy is to choose a recruitment curve that gives the best fit and to use the variance of the residuals to determine the probability of different yields at various levels of fishing mortality. Such an approach would benefit from an understanding of how potential compensatory mechanisms could influence, albeit weakly, the shape of the recruitment curve.
There is an open-ended list of possible compensatory strategies that may be displayed by a pelagic fish population. Recently MacCall (1980) and Csirke (1980) have shown that cannibalism of eggs by adults is one of the important mechanisms regulating the abundance of Engraulis mordax off California and Engraulis ringens off Peru. In the South African pilchard Sardinops ocellata and anchovy Engraulis capensis there is evidence that age at maturity and mean gonad weight may have important regulatory consequences. In addition, spawning geography as well as schooling behaviour and distribution as evidenced by catchability may also effect the shape of the recruitment curve.
STOCK SIZE AND RECRUITMENT TRENDS
The pilchard population rose to a biomass peak in 1959 of over 2 000 000 tons (Virtual Population Analysis estimate, m = 0,5) yielding a maximum catch of 410 000 tons in 1962. Spawner biomass peaked at just over 600 000 tons in 1961 (Figure 1). The stock subsequently declined rapidly to less than 300 000 tons by 1966. Total biomass has currently stabilized at around 200 000 tons and spawner biomass at less than 100 000 tons despite the fact that effort is directed towards catching this species for canning. With a change to a small mesh net during 1964 and 1965 the anchovy has made an increasing contribution to the fishery (Newman and Crawford 1980) and current annual catches are about 300 000 tons. Virtual Population Analysis (VPA) estimates indicate a biomass increase in this species due to good recruitment in 1973 (Figure 2) although the fishery is still dependent on catches of fish one year old and less. A comparison shows that peak pilchard spawning biomass was substantially larger than the current anchovy spawning biomass (Figure 1) but that anchovy recruitment has in nearly all instances been larger and has displayed fluctuations that are less damped (Figure 2), in keeping with rapid maturity and a short generation time.
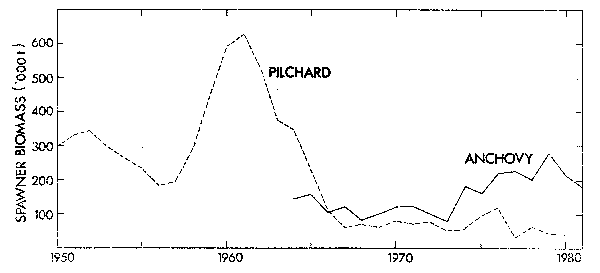
Figure 1. Time series of South African pilchard and anchovy spawner biomasses from VPA analysis.
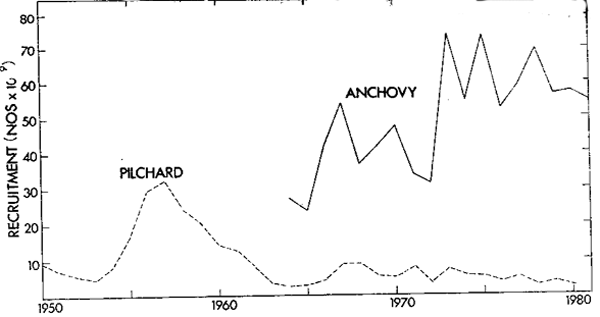
Figure 2. Time series of South African pilchard and achovy recruitment values from VPA calculation of number of fish alive at 6 months of age.
AGE AT MATURITY
Corresponding to the decline in the pilchard pop lation there has been a substantial change in the length at maturity of fish (Figure 3). During the 1950's and early 1960's 50% maturity occurred at an average caudal length of 18,5 cm, corresponding to an age of four years. After the decline the average length at 50% maturity was reduced to 15,5 cm or two years of age (Crawford, Shelton and Hutchings 1980). There has been an increase in length at 50% maturity in the anchovy (Figure 4) after the increase in biomass that resulted from good recruitment in 1973. Clearly a shorter-lived species like the anchovy has less manoeuvrability in age at maturity than the pilchard.
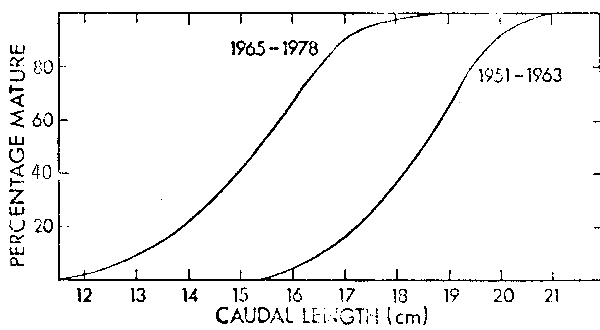
Figure 3. Percentage maturity at length ogives for pilchard sampled during the periods 1951–1963 and 1965–1978.
GONAD WEIGHT
Bagenal (1973) reported an increase in the mean number of eggs per gram of female body weight with a decrease in the size of pike Esox lucius and plaice Pleuronectes platessa populations. He considered this to be a compensatory mechanism. Fecundity estimation in clupeoids is complicated by serial spawning and has not been recorded at different population sizes for the South African pilchard. However, gonad weight is easy to measure and monthly mean values are available since sampling commenced in 1950. From the data gonad condition factors (GF) were calculated for four periods during the history of the fishery using the formula:

which takes into account increased gonad weight with fish weight. The monthly plots for the four periods (Figures 5 and 6) show a seasonal increase in GF over the summer spawning season, but more particularly, in both females and males there is a clear compensatory increase in GF with the decline in the pilchard population subsequent to 1961.
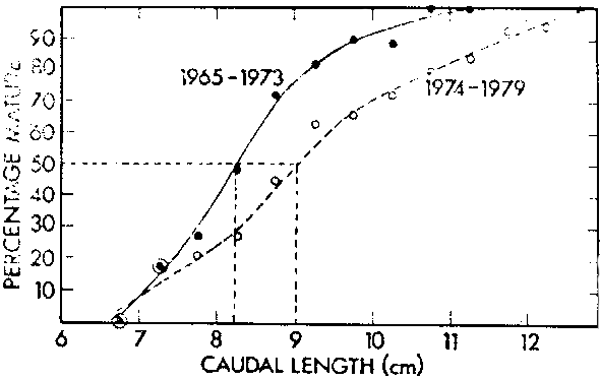
Figure 4. Percentage maturity at length ogives for anchovy sampled during the periods 1965–1973 and 1974– 1979.
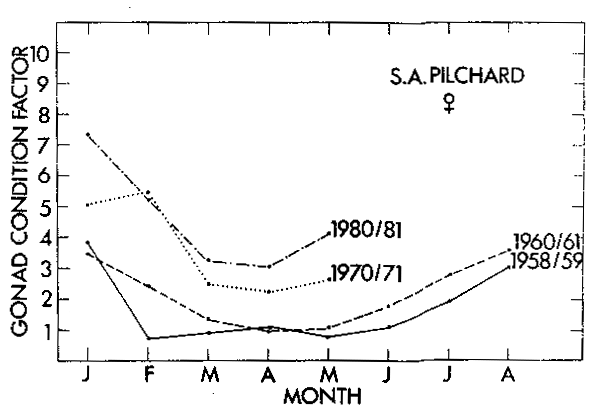
Figure 5. The mean gonad condition factor of mature 15–20 cm female pilchard in each month of four different periods during the history of the fishery.
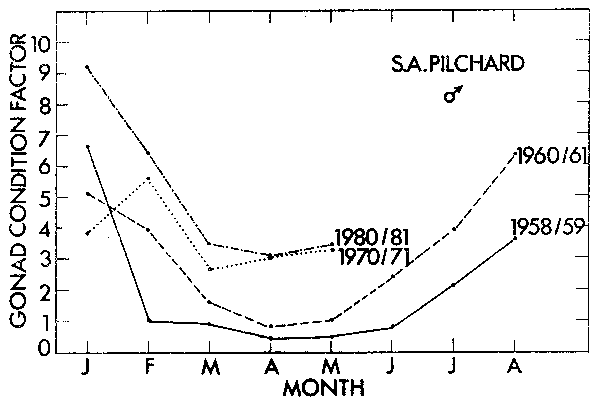
Figure 6. The mean gonad condition factor of mature 15–20 cm male pilchard in each month of four different periods during the history of the fishery.
SPAWNING GEOGRAPHY
As a population expands or contracts its range, changes in the spawning locality may occur. In contrast to other eastern boundary current regions, the convexity of the South African coastline splits the southern Benguela system into a warm water southern region and a cold water western region.
In the anchovy, egg production coincides in time with maximum upwelling but is highest in the warm southern region where upwelling is minimal and egg development is rapid (Figure 7). Early stage larvae derive maximum benefit from the equatorward geostrophic flow associated with upwelling (Shelton and Hutchings 1982) to be transported rapidly into the rich plankton region down-stream of the two main upwelling sites. There has been no detectable change in spawning geography after the good recruitment recorded in 1973).
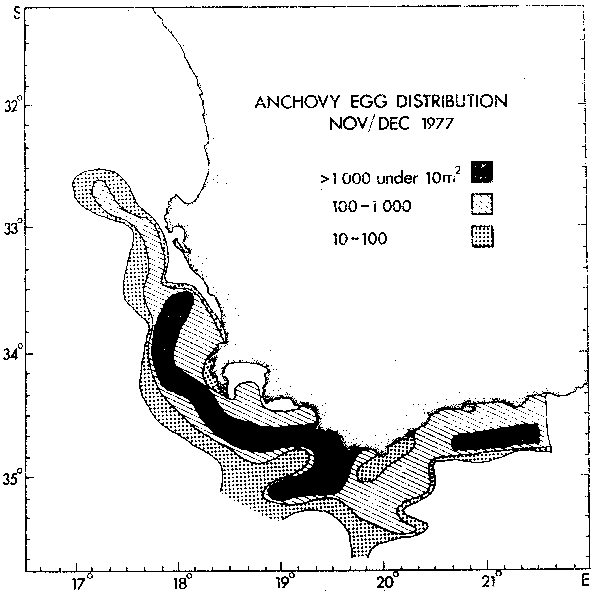
Figure 7. The distribution of anchovy eggs during November and December 1977.
Prior to the pilchard decline, when fish up to nine years old were present in the population, spawning occurred predominantly off the west coast, offshore of the major up- welling region and close to the recruitment ground (Figures 8a). With the decline in population size and the associated reduced age composition and change in the age at maturity, the centre of spawning has shifted to the south (Figure 8b). The change in spawning area may be expected to alter recruitment. The change could only be considered compensatory if survival through to recruitment was favoured. While the more stable structure of the water column in the south may favour spawning and egg development in the depleted population, recruitment still occurs on the west coast and requires favourable larval transport, perhaps more risky than recruitment from west coast offshore spawning at high population size. The reduced pilchard population may derive some benefit from spawning in association with the anchovy since early recruits of anchovy and pilchard frequently shoal together as evidenced by the number of mixed catches (Crawford 1981). A preliminary examination has not revealed an increased incidence of mixed shoaling but comparison is only possible since 1964 when the small-meshed net was introduced, and by this time the pilchard population had already declined.
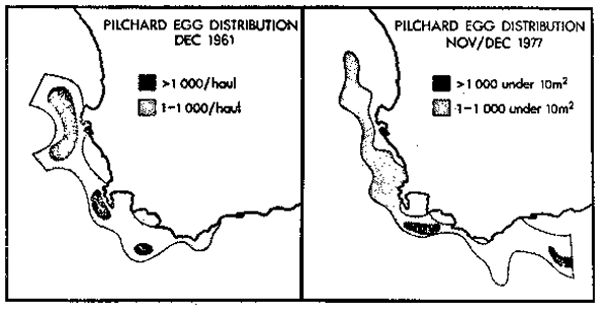
Figure 8. A comparison between pilchard egg distribution during December 1961 and November/December 1977.
CATCHABILITY AND SCHOOLING
The observation by Paloheimo and Dickie (1964) that catch per unit time may depend as much on the size of schools and densities of fish within them as on overall abundance and that there may be an inverse relationship between the catchability coefficient and abundance, has important consequences in density-dependent population regulation. This has been realized by Csirke (1980) who used catch per unit effort as an index (S) of population density in the Ricker equation (2)
| R = aBe-bS | (2) |
similarly MacCall (1980) incorporated a coefficient (c) to reduce the effect of the density-dependent term in the Ricker equation
| R = aNe - bNc | (3) |
When c = 1 a Ricker curve results, but when c decreases below k the ascending limb of the recruitment curve becomes steeper and more linear, the peak becomes broader and the descending limb becomes progressively shallower. In the South African pilchard and anchovy there is strong evidence of an inverse relationship between catchability and population size (Crawford pers. comm.) (Figures 9 and 10).
Jakobsson (1980) has found that the stock-recruit relationship in Icelandic herring is linear or even depensatory at low population size. Depensatory curves have been considered by Larkin, Raleigh and Wilimovsky (1964), Paulik (1973), Holling (1973), Clark (1974), Gulland (1977), Peterman, Clark and Holling (1979) and Ulltang (1980). Clark (1974) emphasized that when depensation occurs in the recruitment curve a small increase in effort can switch the relationship to an unstable state, leading to extinction. Although the cause may be different, Gulland (1977) regards this effect as similar to that observed when there is and inverse relationship between catchability and collapse. In both instances the equilibrium yield profiles are similar. Ulltang (1980) has observed that the combined effect of the inverse catchability relationship and depensation will rapidly deplete the stock at a catch or effort level above MSY.
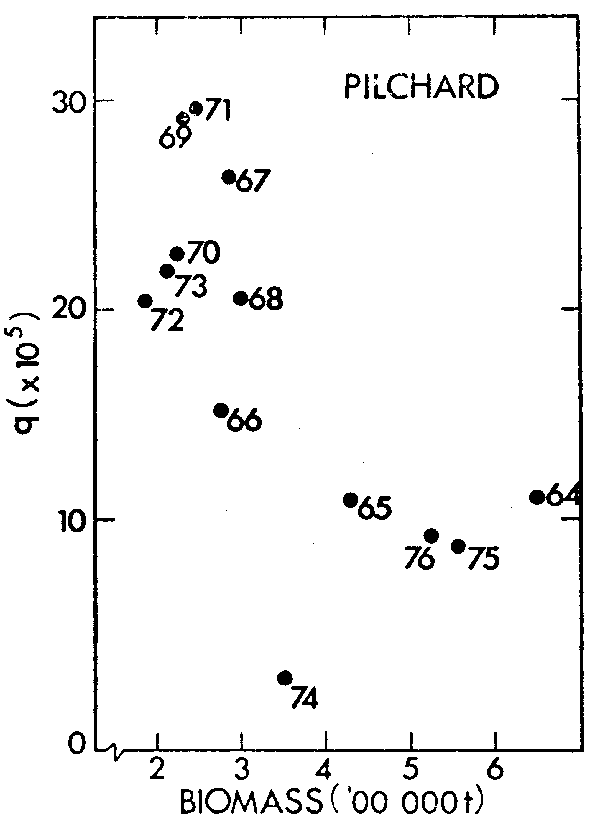
Figure 9. The catchability coefficient of pilchard calculated as weighted F from VPA divided by directed effort and expressed as a function of total pilchard biomass (from Crawford, R. J. M., Sea Fisheries Research Institute).
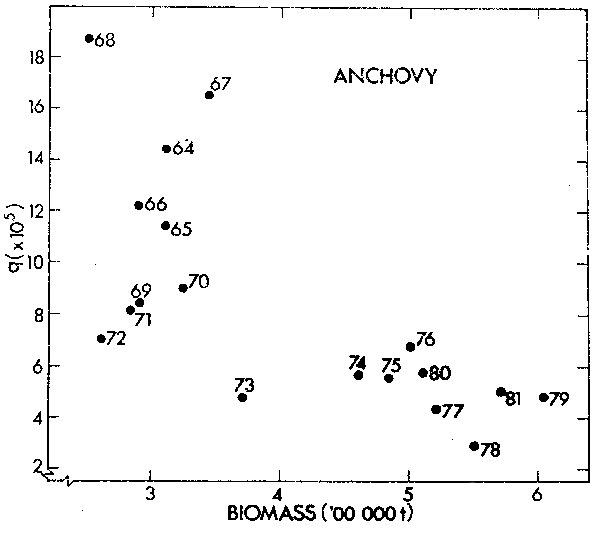
Figure 10. The catchability coefficient of anchovy calculated as weighted F from VPA divided by directed effort and expressed as a function of total anchovy biomass (from Crawford, R. J. M., Sea Fisheries Research Institute).
Increased mortality rates leading to depensation in the recruitment curve at low stock levels may be caused in a number of ways. Those involving the breakdown in school- ing, leading to, for example, ineffective egg fertilization or the inability to feed successfully and maintain energy reserves for serial spawning, are attractive. Clark (1974) suggests that since the efficiency of schooling increases with the size of schools, depensation in the recruitment relationship could result from an increase in the rate of juvenile losses to predation at low population levels. If predation on the juveniles is of the Type III form (Holling 1973) then a refuge from predation will occur at low population density, giving rise to a stable equilibrium on the recruitment curve at a low population size (Peterman et al. 1979). Hewitt (1981) has found that in the Californian anchovy, school formation starts at 18 days after hatching. Between this stage and recruitment juveniles could be preyed on by a number of species. In the Benguela system the jackass penguin Spheniscus demersus has been recorded eating pre-recruit clupeoids and is capable of switching prey between pilchards and anchovy (Crawford and Shelton 1981) and could thus exert a Type III predatory response on juvenile pilchards. The fact that Smith and Lasker (1978) have not recorded a relationship between large larvae and recruitment in the Californian anchovy supports the idea that recruitment is determined subsequent to the onset of schooling.
THE RECRUITMENT CURVE AND YIELD
The effect of various shapes of the recruitment curve on yield is particularly impor- tant at high levels of fishing effort when a further small increase in effort or fishing effort could result in the collapse of the population. In Fig. 11a the solid line is a fairly typical recruitment curve for a clupeoid population which displays an inverse relationship between catchability and population size, as described by equation 3 where c has a value, for examples, of 0.5. This slightly domed recruitment curve corresponds to a symmetrical yield curve. If c takes on a value of 1 the normal Ricker relation results (broken line curve). This has a more domed appearance due to the steeply descending righthand limb resulting from the assumption that the rate of density-dependent mortality (e.g., cannibalism) is directly proportional to spawner biomass rather than density. The maximum yield is greater, but occurs at a lower fishing mortality.
A compensatory decrease in the age at maturity in a depleted population has the effect of decreasing the slope of the replacement line at any F value (Figure 11b, line 1 to line 2). The influence on the yield curve is to displace the righthand limb, allowing a yield to be taken at a higher fishing mortality than would otherwise be possible.
If fecundity varies in a density-dependent compensation manner then the recruitment curve has a more pronounced dome and more steeply sloping limbs (Figure 11c, solid line curve). This means that the maximum yield is larger, is taken at a higher level of fishing mortality and drops off sharply beyond MSY. The incorporation of this effect into the Ricker equation.
| R = aNe - bNC | (4) |
requires modification of the normally density-independent “a” term, corresponding to environment and fecundity, into a part that is density-independent (a) due to the environ- ment and a part that is density-dependent (g) representing density-dependent changes in fecundity so that
| g = f(N). | (5) |
The rewritten equation would then take the form
| R = agNe-bNc | (6) |
Depensation resulting from increased mortality at low population size (Figure 11d, solid line curve) will result in the yield curve suddenly collapsing, and in order to halt this process, fishing mortality must be reduced. This results in an equilibrium yield curve that bends backwards. If the depensation falls below the replacement line at F = 0 then it is termed “critical” (Clark 1974) and the population collapses even in the absence of fishing. Even if the depensation is non-critical, the equilibrium points (e.g. 2) along the backward bending part are not stable and depending which way the population is displaced, it will either collapse or move up to the stable equilibrium (1) on the recruitment curve.
If the recruitment escapes the depensatory trough at some low population size (Figure lle, solid line curve) then the backward bending of the yield curve will be arrested and a stable equilibrium (3) will be obtained.
In general, the combined effects of an inverse relationship between catchability and population size, a compensatory decrease in the age at maturity and a compensatory increase in fecundity will allow yield to be maintained up to a high level of fishing mortality but will precipitate a rapid collapse at a point only slightly above MSY. When depensation is superimposed on these effects, the collapse is more rapid and recovery will be slower. In some instances a reduced mortality of juveniles at a low population size may arrest collapse and allow a small but stable yield to be harvested.