![]()
![]()
![]()
Ecosystem structure and dynamics
Simulation of management scenarios
The complementary role of models
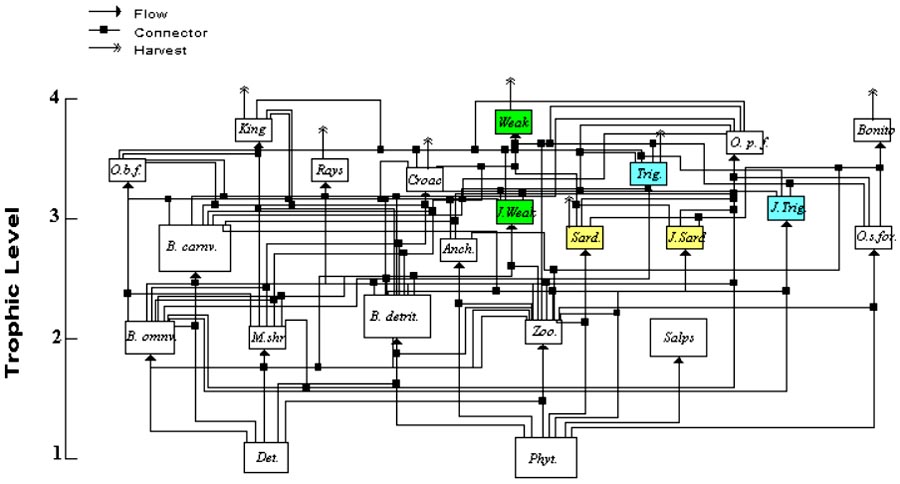
Figure 5 shows the flow diagram representing the major components and trophic flows in the Southeastern shelf ecosystem. Model parameters are shown in Appendix I, Tables I.2 and I.3. The model depicts phytoplankton and detritus at trophic level 1, as primary producers, planktonic and benthic consumers at trophic level 2, small pelagics, juvenile stages of weakfish and triggerfish, and benthos carnivores at intermediate trophic levels, and all demersal and pelagic feeding fish groups at the top of the food web.
Three peculiar features of the ecosystem are represented in the model. First the partition of the system between pelagic and benthic food chains at lower trophic levels (1 to 3) representing energy pathways originated from phytoplankton and from detritus. Benthic and pelagic food chains are mainly linked at the top of the food web by predators, such as weakfish, that optimize foraging benefits by feeding from both systems, and by the juvenile stages of demersal species that are active pelagic planktonic feeders (e.g. weakfish and triggerfish). Second, the model depicts the partition of the mid-trophic level pelagic niche among Sardine, Anchovy, Other forage fish, and juveniles of top predator groups. Finally, the model represents the relatively high abundance of Salps noticed by Pires-Vanin et al. (1993) as major primary consumers that are apparently not utilized by higher order consumers in the system.
A central question for fisheries management is whether the changes observed in the Southeastern Brazilian Bight ecosystem, i.e. collapse of the sardine stock and apparent increase in anchovy biomass, represent a natural and reversible change caused by oceanic regimes or do they reflect a loss of resilience of the ecosystem and a change of state caused by excessive exploitation. Several biological-oceanographic processes may be at play to cause regime shifts in marine ecosystems following disturbance by fisheries and natural events. A review of the last 18 years of publications (referenced in the Aquatic Sciences & Fisheries Abstracts, ASFA) on the causes of fluctuations in small pelagics showed that the majority of the papers (30 out of 52) associate changes to direct fishery and environmental effects. These include processes such as long term changes in temperature, wind intensity, and food enrichment mechanisms, that directly affect recruitment success of fish populations.
Trophic mechanisms are also used to explain apparent regime shifts in the productivity of small pelagics. The most frequently visited hypotheses are food competition, and predation of adult anchovy/sardine on the early life stages of the competing species (Santander et al. 1983; Alheit, 1986; Butler and Pickett, 1988; Butler, 1991; Valdez Szeinfeld, 1991). Cury et al. (2000) also pointed at behavioral causes such as the “school trap” phenomenon commonly observed in small pelagics. The “school trap” is caused by behavior mechanisms that drives sardines, anchovies and sardinellas species to school together with other species when their relative abundance is diminishing. By doing so they subordinate their specific needs to a different set of environmental preferences, such as migration paths, habitat types, etc., not necessarily optimal for the species. Under these conditions stock productivity is expected to remain low for longer periods.
The hypothesis of replacement by food competition implies two interrelated assumptions; first that the mid-trophic level pelagic niche is occupied by a dominant species, and that a competing species may “fill the environmental void” created by the depletion of the dominant one (Turner and Bencherifi, 1983); second that food is limiting production, so that even in the absence of a fishery the depleted population would not recover its biomass. In many cases, the hypothesis of food competition between sardine and anchovy has been refuted by considerable differences between the diets of the two species. In the Benguela system, for instance, competition between the two species seems to be limited by differences in the size composition of the diet, where sardine usually consume smaller prey than anchovy (Louw et al., 1998).
Evidence of predation of adult sardine/anchovy on eggs and larvae of the competing species would point to the existence of “trophic triangles” in the pelagic niche (Bax, 1998). In this case adults of sardine and anchovy would share a common prey pool, while also feeding on the early life stages of the other. Thus reducing the biomass of one species of the pair would lead to an increase in prey availability and in the abundance of the competing species, which in turn would cause an increase in larvae and juvenile mortality due to predation. There are two reasons not to support the hypothesis of predation relationships between sardine and anchovy in the Southeastern Brazilian shelf. First, the lack of evidence of eggs and larvae in stomach contents of both species (Goiten, 1983; Schwingel, 1996). Second, which corroborates the first, is that although sardine and anchovy inhabit the same region, spawning behavior differs between species (Matsuura et al., 1992). While sardine spawning occurs in the surface warm mixed layer during spring and summer, anchovy spawns all year round mainly beneath the thermocline, inside the cold waters which are present in the shelf bottom layers during spring and summer. Eggs and larvae of both species are found mainly above the thermocline in the coastal regions. Therefore adults and early life stages seem to be spatially segregated during the peak spawning season.
Ecosim was used to examine the likely importance of some of the above mentioned mechanisms in explaining the observed changes in sardine stock production and the apparent increase in anchovy biomass between the 1970s and 1990s. Anchovy biomass in the late 1980s was estimated by Castello et al. (1991); biomass in the late 1970s was assumed ca. 2 times smaller than in late 1980s based on the low frequency of occurrence of the species in acoustic surveys conducted between 1974 and 1980 (Johannesson, 1975; Rijavec and Amaral, 1977; Saccardo, 1983). The mechanisms examined in the retrospective simulation were: i) overfishing; ii) predation and food competition; iii) changes in primary production or food enrichment; iii) changes in abiotic variables that affect sardine egg/larvae survival independent of the availability of prey and predators. Figure 6 contrasts observed data against model predictions of changes in sardine and anchovy between the 1970s and 1990s. Because the intention of this figure is simply to illustrate trends in biomass of sardine and anchovy, the axes labeling was left out to reduce clutter. Predicted biomasses from the effect of fishing mortality and trophic interactions alone (Figure 6a) does not fit the data as well as when time forcing functions are introduced (Figure 6b and 6c). Two types of forcing functions are shown; panel b shows the effect of introducing interannual changes in egg/larvae survival controlled by an unknown abiotic variable, while panel c shows the effect of introducing changes in primary production. Both time forcing functions improve model fitting of the observed sardine biomass time series, but only scenario (b) shows trends in anchovy biomass consistent with the increase in the species abundance with the collapse of sardine. That is, in the model, anchovy benefits from the release in food competition when the reproductive success of sardine is affected, whereas both species are affected when the overall productivity of the system deteriorates. The predicted anomalies in productivity are consistent with a suspected failure of sardine year classes in the late 1980s due to below optimal environmental conditions for egg/larvae survival (Matsuura et al., 1992; Bakun, 1996). This simulation exercise was not intended to resolve the question about species replacement and regime shifts in the SSB, but to show the potential role of an ecosystem model in exploring the nature of mechanisms involved in ecosystem changes.
Figure 6. Predicted (lines) and observed (dots) changes in sardine and anchovy biomass in the Southeastern Brazilian Bight between 1977 and 1990. Fishing mortality rates for sardine used in simulations are from Vasconcellos (2000). Panel (a) are biomasses predicted by simulating the effect of fishing sardine; (b) the effect of fishing plus a time forcing function representing the effect of an abiotic variable on egg/larvae survival; (c) the effect of fishing plus a time forcing function representing changes in primary production. The inset bar charts are the time forcing anomalies in egg/larvae survival (b) and primary production (c) that provide the best fit to data. In the three scenarios prey vulnerability parameters were set to represent a “wasp-waist” trophic control type.
(i) Ecosystem simulations
(ii) Single species
Results of simulations of the effect of fishing strategies on the biomass and catches of sardine are shown in Table 2. It is predicted that closing the purse seine fishery (scenario 2) will lead to an increase in sardine biomass of 2 to 5 times the baseline level of the late 1980s. Halving the current fishing rate (scenario 1) would lead to a biomass increase of 1.5 to 2 times, and it is predicted to cause either a decrease or slight increase in catches depending on the type trophic control used. Higher biomass and yield recoveries are predicted with wasp-waist control. For a comparative analysis, results obtained with the single-species approach for the same short term policies are listed in Table 3; for instance, closing the purse seine fleet is expected to result in an increase in sardine biomass between of 1.27 and 2.66 times the baseline biomass, depending on the environmental conditions prevailing during the 5 years.
Table 2 also allows for a direct comparison of the effect of decisions in other fisheries (scenarios 4, 5 and 6) on the resulting sardine biomass and catches. For the rebuilding strategies (4 and 5) results point to smaller biomass and catch than is predicted under the purse seine only scenarios (1 and 2). On the other hand, doubling all fisheries (scenario 6) has a smaller effect on sardine biomass than that predicted by doubling the purse seine fleet (scenario 3). These results illustrate the type of indirect effects expected when fish stocks are linked by predator-prey relationships, i.e., allowing the rebuilding of species at the top of the food web to cause a reduction in the benefits expected from releasing fishing pressure on sardine, specially when the fisheries target species that directly affect sardine production, either by competing for the same food resources or by being a predator. The latter situation occurs with Bottom trawl and Pole-and-line fisheries, for harvesting adult weakfish and bonito which are predators of small forage fish in the model.
Table 2. Relative change in sardine biomass and catch after 5 year under different fishing scenarios. Values are relative to the Ecopath baseline level. Scenarios 1, 2 and 3 involve changes in the purse seine fleet only.
|
Scenario |
Biomass |
Catch |
||
|
Bottom-up |
Wasp-waist |
Bottom-up |
Wasp-waist |
|
|
1 |
1.51 |
2.16 |
0.76 |
1.08 |
|
2 |
2.26 |
5.29 |
¾ |
¾ |
|
3 |
0.61 |
0.46 |
1.21 |
0.92 |
|
4 |
1.34 |
1.79 |
0.67 |
0.89 |
|
5 |
1.69 |
3.31 |
¾ |
¾ |
|
6 |
0.69 |
0.54 |
1.37 |
1.08 |
|
Future environmental conditions |
Close purse seine fishing |
Halve purse seine fishing |
|
Bad |
1.27 |
0.82 |
|
Good |
2.66 |
2.20 |
Table 4. Relative change in biomass of main harvested species in the Southeastern Brazilian Bight as predicted by Ecosim after 5 years with all fisheries closed or doubled.
|
Groups |
Closing all fisheries |
Doubling all fisheries |
||
|
Bottom up |
Wasp-waist |
Bottom up |
Wasp-waist |
|
|
Bonito |
1.47 |
1.59 |
0.66 |
0.66 |
|
Adult Weakfish |
4.50 |
4.54 |
0.37 |
0.37 |
|
Rays/Skates |
4.14 |
4.13 |
0.20 |
0.20 |
|
Croaker |
1.23 |
1.25 |
0.80 |
0.80 |
|
King Weakfish |
1.41 |
1.46 |
0.85 |
0.85 |
|
Triggerfish |
0.91 |
0.88 |
1.02 |
1.02 |
|
Marine shrimps |
0.51 |
0.52 |
1.51 |
1.51 |
|
Anchovy |
0.90 |
0.88 |
1.22 |
1.26 |
|
Sardine |
1.69 |
3.31 |
0.69 |
0.54 |
Figure 8 shows the expected yield and probability of stock collapse over a range of exploitation rates for sardine as predicted by the single-species approach. Two curves are shown in each case to demonstrate the effect of including an estimation error in the stock biomass assessment. The maximum yield is predicted at an F of 0.69 year-1 when no errors are included, and 0.51 year-1 with estimation error assumed to have a coefficient of variation of 50%. Errors in stock assessment estimates have also the effect of increasing the probability of stock collapse. For instance, with no errors in stock assessment, fishing at the average fishing mortality between 1977 and 1990 has an associated probability of collapse of less than 1%, while with a 50% coefficient of variation in the stock assessment the probability of collapse increases to ca. 70%. In effect, errors in stock assessment cause a divergence between the target and implemented fishing mortality rate and result in large variances in fisheries exploitation (the sardine fishery, which is not managed by a target fishing mortality, generated F values between 0.4 and 2.5 year-1 in the period of 1977 and 1990). Errors of this magnitude are commonly observed, for example, in biomass obtained by acoustic methods, as a result of variations in the adjustment of ecosounders, changes in the acoustic properties of fishes, and the efficiency with which surveys cover the complete distribution area of the stock (MacLennan and Simmonds, 1992). Misund (1997), for instance, reported differences of ca. 100% in the estimation of herring biomass obtained between surveys in the same year. Similarly, acoustic assessment of sardine biomass in the 1988 spawning season (Castello et al., 1991) produced a confidence interval for stock biomass between 38 and 77 thousand tons, corresponding to a coefficient of variation in the order of 30%.
Figure 8. Expected yield and probability of stock collapse for constant fishing rate strategies as predicted by the single species model. CV is the coefficient of variation of the biomass estimation procedure.
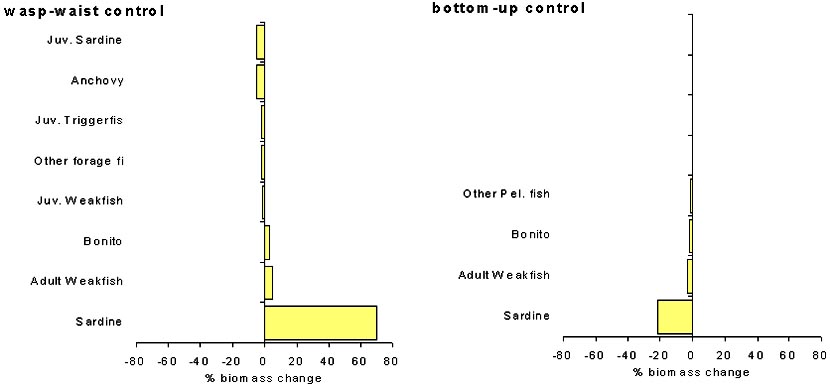
Figure 9 shows the predicted equilibrium yield obtained using Ecosim. Results are shown for two types of trophic control hypothesis. With a bottom-up control the model predicts that the maximum yield is obtained with a fishing mortality rate of 0.99 year-1, while with a wasp-waist control the maximum yield is predicted at F of 0.47 year-1. As pointed by Walters et al. (1997) bottom-up control generally produces a catch curve that achieves an asymptote at higher Fs, predicting that stock can sustain much higher fishing pressure before it begins to decline. This occurs because under bottom-up control, predation mortality rate tends to remain more stable, while the consumption rate of small pelagics increases with the decrease in biomass, to make them more productive per biomass due to donor control of total food eaten. In both trophic control types, adopting the optimal fishing rates is predicted to have only minor effects on other ecosystem components. Figure 10 shows the predicted changes in the biomass of other species when the system is disturbed from the baseline state (average F1977-1990) by fishing sardine at the predicted optimal Fs. Results are qualitatively different depending on the type of trophic control used in simulations. Under wasp-waist control the baseline F for sardine is above the predicted optimal F. Fishing at the optimal F leads to an expected increase in sardine biomass of ca. 60% and a modest increase in the biomass of sardine predators (bonito and weakfish). Groups that are negatively affected are sardine competitors including anchovy, juvenile triggerfish and other forage fish. On the other hand, with a bottom-up control the baseline F for sardine is below the predicted optimal F. Adopting a higher F leads to a decrease in sardine biomass of ca. 20% accompanied by a relatively small decrease in the biomass of sardine predators.
Figure 9. Expected yield for constant fishing rate strategies as predicted by Ecosim under two trophic control hypothesis; wasp-waist and bottom-up control.
Single-species and multi-species models provided estimates of Fmsy for sardine which are consistent with the sustainable fishing rates for small pelagics suggested by Patterson (1992). A meta-analysis conducted by Patterson (1992) showed that exploitation rates (F/Z) above 0.4 were often associated with the collapse of small pelagic fisheries. For the Brazilian sardine an exploitation of 0.4 represents a fishing mortality rate (F) of approximately 0.6 year-1, which is within the range of fishing rates predicted for maximum yields with both models. The predicted impact of fishing at this optimal rate has qualitative differences depending on the type of trophic control utilized. It is also sensitive to the accuracy of the stock assessment method.
Constant harvest rate strategies are considered very robust strategies to cope with the inherent uncertainties created by climatic effects on marine fish populations (Walters and Parma, 1996). They are usually implemented by fishing control systems that rely on annual biomass estimates and on simple feedback rules that specify the proportion of the adult stock, or the total allowable catch, to be harvested each year. The success of catch control systems is however dependent on the accuracy of the stock assessment which often suffers from large uncertainties in parameters and variables (e.g. catch at age, relative index of abundance) used in the estimation procedure. The critical information for the success of catch control systems is therefore the frequency and accuracy of stock abundance estimates, which may call upon a combination of data from surveys (e.g. acoustic assessments of spawning biomass and recruitment), better monitoring of catch composition (age and size) used in virtual population analysis, tagging experiments, and may as well rely on the active participation of resource users in data collection (Walters and Pearse, 1996).
A central question for fisheries assessment today is on how to evaluate and communicate the consequences of alternative fishing policies to marine resources and ecosystems. For a quantitative analysis the question consequently concerns the choice for the modeling approach.
Models have many possible purposes and uses, and no one model is right for the entire range of uses. In principle, the choice for which type of approach to be used depends on the type of products or outputs expected from the analysis, i.e., on what type of information is needed for deciding among harvest decisions. Costanza et al. (1993) suggested three criteria for judging model performance: realism (simulating system behavior in a qualitatively realistic way); precision (simulating behavior in a quantitatively precise way); and generality (representing a broad range of system’s behavior with the same model). No single model can do well on all three of these criteria, and the choice of which objective to pursue depends on the fundamental purposes of the model. In modeling complex systems, tradeoffs must be made between realism, precision, and generality. For instance, when seeking for generality, models must give up some realism and/or precision. High precision (quantitative correspondence between data and model) will often sacrifice realism and generality. When the goal is to develop realistic assessments of a system, generality and precision must be relaxed. High realism models are concerned with accurately representing the underlying processes in a specific system, rather than with precisely matching quantitative behavior or being generally applicable. Costanza et al. (1993) argued that in many types of system modeling, the desired outcome is to accurately determine the overall magnitude and direction of change, trading off realism for some moderate amount of generality and precision.
Conventional fisheries stock assessment models strive for quantitative precision when describing time series of population abundance, calculating catch quotas, or predicting the consequences of policy options. Cochrane (1998), for instance, pointed to the need of an “ecosystem operating model” in management procedures for multi-species resources. A management procedure is defined as a set of rules which specify how a management recommendation is set and what data are used for this purpose (Butterworth et al., 1997). Rules are selected based on their anticipated performance as estimated by simulation on an operating model of the resources and fishery. Successful implementation of formal management procedure for multi-species or ecosystem management will require from the operating model (Cochrane, 1998): precision, so that the expected system response to a management strategy is quantitatively similar to that predicted by the model; realism in simulating adequately the fishery-resources interactions; the incorporation of all sources of uncertainties to enable robust forecasts of ecosystem responses to a management strategy; and the output of meaningful performance criteria.
A model with high precision would be able to describe perfectly well the quantitative changes in the variables of interest with changes in controls and strategies. Both models used in this work were able to reproduce reasonably precise changes in sardine recruitment (Figures 6 and Figure I.2), at the expense of an increasing level of model complexity with the introduction of variables representing an unknown environmental forcing. Realism varies between approaches. The Ecopath/Ecosim model provides a more realistic description of the resource and ecosystem by representing not only the characteristics of the sardine stock but also the trophic interactions with other ecosystem components, and the possible interactions between fishing fleets. The ecosystem model however still lacks a proper representation of important fishery-resource interactions such as the effect of changes in gear selectivity, which is often one of the most applied policy variables in fisheries management. Lack of realism in representing important processes and uncertainties may in this sense apply for both modeling approaches, as models will always involve some degree of simplification of the observed processes in nature. The critical question is therefore not which model is more realistic, but which level of simplification imposed when using a model is less appropriate for the type of problem and policy variables in hand.
When the objective of quantitative modeling is prediction, very simple models very often outperform more complex models. For instance, Ludwig and Walters (1985) showed that non-age-structured models produce better predictions of management actions than detailed age structured models. As a rule, the increase in model details makes it more difficult to specify how the components functionally interact, and each additional model parameter becomes less well specified by the available historical data. Walters (1986) showed that uncertainty about a policy parameter is likely to be minimized, for a fixed data set, by basing its calculation on parameter estimates from a model of intermediate complexity. The increase in model complexity decreases the prediction error (increase the ability to fit historical data) but increases uncertainty on parameters used to calculate the policy of interest.
In summary, the choice for model complexity depends basically on the purpose of the model and on the amount of available information, i.e., if the model is too simple there is a risk of lacking realism, whereas if the model is too complex there will be not sufficient information in data to distinguish between the possible parameter values of the model. Also, the increase in model complexity should never compromise the transparency of arguments and conclusions of the model, and ideally, should be preceded by the analysis of its likely contribution to the final qualitative argument (Walters, 1986). Therefore, if the objective is prediction of the dynamics of multi-species systems or ecosystems, single-species models are of little use, but detailed models involving all important species may not be the solution either, since the sensitivity of complex models to errors in parameters needed for their construction will make them unreliable (May, 1984; Hilborn and Mangel, 1997).
From a manager’s point of view, the difference between the analysis of scientific advice based on single or multi-species models may be irrelevant since the questions faced by managers concerning the quality of science and the political acceptance of regulations are exactly the same, regardless of the modeling approach (Brugge and Holden, 1991). In this respect, Brugge and Holden suggest situations where the use of multi-species models will tend to go wrong. Among the possible operational reasons for the failure are first, when recommendations based on multi-species models differ radically or are totally contradictory to those proposed in the immediate past with single species models. As stated by Gulland (1991), new scientific advice is most likely to be used if it implies changes in current management practice that are straightforward and preferably minor. Second, if the use of multi-species models causes an increase in the complexity of both management and assessment, they are unlikely to be applied. Complexity in the management system is likely to increase if the conflicting interests are to discuss how the relative abundance of the multiple stocks should be changed. As for assessment, data requirements will most likely increase with multi-species models. Finally, multi-species models are inclined to fail if the lack of data forces extreme simplifications in overall system structure and process, thus compromising realism (an argument also constantly used against single-species models).
In the present work, Ecosim and the single-species model provided similar prediction of the optimal fishing rates, and of the expected changes in sardine biomass due to fishing. Christensen and Walters (2000) warned about the possibility of Ecosim providing the same answers as a single-species approach to policy questions related to the species (e.g. Fmsy), when production parameters of both models have been fitted to the same time-series data. Several examples like this led the authors to conclude that detailed trophic models such as Ecosim will not lead to substantial improvements in stock size predictions just by accounting for predator-prey effects. Ecosim can, on the other hand, help in interpreting the effects of environmental regime changes that may have caused ecosystem-scale changes in productivity (Christensen and Walters, 2000) and provides information on possible ecosystem responses to fishing on a target stock.
The achievement of a comprehensive understanding that is useful for both realism and prediction will perhaps call upon the integration of the different approaches. Not that the “truth will lie in the intersection of independent lies” (Levins, 1966), but that the combination of approaches can provide complementary valuable results. Multi-species ecosystem models produce a more complete caricature of the system, explicitly recognizing its major components and processes, which enable us: i) to visualize the broad consequences of fishing policies (e.g. removing all the prey will impact the predators) and hence provide guiding principles in which to ground ecosystem goals when defining conservative exploitation rates, catch quotas, etc.; and ii) to test and formulate hypotheses about the causes of the observed changes in marine fish populations, and about the functioning of marine ecosystems. The latter is particularly relevant in the scrutiny of research questions to which resources are to be allocated to improve the understanding of the processes affecting fish populations. The simpler structure and data requirement of single-species models, on the other hand, make them particularly useful for prediction of policy variables and monitoring purposes in the management of fisheries for single stocks, as is the case with most small pelagic fisheries such as the sardine fishery considered here. Christensen and Walters (2000) advocate an iterative process where information should be passed between single-species models and Ecopath/Ecosim as a way to check and improve estimates of policy parameters, and to address questions about the degree to which ecosystem events can be attributed to impact of fisheries, climate change, and predator-prey interactions. In the present case study the ecosystem model provided the means to evaluate alternative hypotheses about the causes of ecosystem change, and corroborated with the single-species approach in the estimation of conservative target fishing rates for sardine in the Southeastern Brazilian Bight.
![]()
![]()
![]()