![]()
![]()
![]()
1. Impact of Hurricane Mitch
2. Damage inflicted on the farming sector by Hurricane Mitch
3. Trends in food production
4. Food imports and exports
The region's productive sectors were those that sustained the greatest damage as a result of Hurricane Mitch. In those sectors, the impact (including both direct and indirect damage) accounted for 65 percent (US$3 907 million) of total damage (US$6 018 million). Farming and forestry production together accounted for 49 percent of that 65 percent. The infrastructure sector sustained 21 percent (US$1 246 million) of total damage, with roads, bridges and railways (18 percent) being hardest hit. Social sectors sustained total damage of around US$799 million (13 percent of the total), with damage to homes making up the highest proportion of that total, at 10 percent. Lastly, damage to the environment amounted to US$67 million, or 1 percent of all damage sustained as a result of the hurricane.9
As far as the human cost is concerned, it was reported that around 18 385 people had died, 12 842 people had been injured and approximately 3 464 662 others had been directly affected by the hurricane (see Table 6). This is equivalent to 11 percent of the region's total population.10 This volume of damage clearly illustrates the vulnerability of the region. Added to this, there were the serious interruptions to transport and communications which, during the first week of the hurricane, threatened the food security of the major portion of the region's population directly affected by the hurricane, as well as (to a lesser degree) that of the remaining 28.3 million inhabitants.
Table 6. Population affected by Hurricane Mitch in Central America
|
Category |
Belize |
Guatemala |
El Salvador |
Honduras |
Nicaragua |
Costa Rica |
Total |
|
Dead Missing |
N/a |
268 |
240 |
5657 |
3045 |
4 |
9214 |
|
121 |
19 |
8058 |
970 |
3 |
9171 |
||
|
Total deaths |
N/a |
389 |
259 |
13715 |
4015 |
7 |
18385 |
|
Population directly affected |
N/a |
730000 |
346910 |
1500000 |
867752 |
20000 |
3464662 |
N/a: Not available; Source ECLACThe greatest damage was inflicted on Honduras, where the hurricane's strongest winds and rains and were concentrated, and where the hurricane stayed for the longest period during its passage through the region. Nicaragua was the next hardest-hit, followed by Guatemala, El Salvador, Belize and Costa Rica, in descending order. Costa Rica is not included in this study, because it sustained a relatively minor amount of damage.
In terms of the number of deaths and the total damage, the impact of Hurricane Mitch was greater than that of Hurricane Fifi which, in 1974, left 8 000 people dead and caused damage of around US$540 million, with Honduras the hardest-hit country.
Although the hurricane inflicted the greatest damage on the rural population, it also affected major segments of the urban population living along the banks of small rivers and on the slopes of outlying hills. With the intense rains, those rivers swelled into violent flows of water that inundated and destroyed the scant housing and productive infrastructure of the local inhabitants, whose marginal status also makes them constantly vulnerable to landslides when intense rains occur, due to deforestation and the absence of systems for the conservation of hillsides and soils in general.
Hurricane Mitch therefore highlighted the vulnerability of Central American countries to such disasters and the paucity of preventive and relief actions put in place to deal with them.
It should be noted that 65 percent of region comprises hydrographic basins, which have been damaged as a result of deterioration due to deforestation, forest fires, the lack of conservation systems in hillside agriculture and the effects of cyclonic events such as Hurricane Mitch, which demonstrate the region's considerable vulnerability to natural phenomena - especially hurricanes and tropical storms.
These basins have been significantly altered, and this had the effect of exacerbating the damage caused by Hurricane Mitch. Another contributing factor was the gradual incursion of farmland, which prevents the soil from absorbing the rains adequately - especially in humid regions.
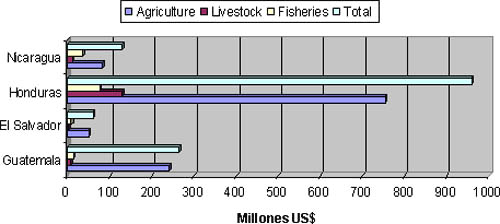
A summary of damage caused by the hurricane in the primary sector of the economy is given in Table 7, which shows that direct sectoral damage was around US$1 445.4 million. Of that total, 80 percent (US$1 159.1 million) occurred in the agriculture sector. In livestock, the impact was equivalent to around US$151.2 million (10 percent of the total), while fisheries accounted for the remaining 10 percent of the damage (US$151.2 million).
Table 7. Direct damage inflicted on farming sector by Hurricane Mitch (US$ millions)
|
Activity |
Belize |
Guatemala |
El Salvador |
Honduras |
Nicaragua |
Costa Rica |
Panama |
Total |
|
1. Agriculture: |
N/a |
242.0 |
50.5 |
754.3 |
82.5 |
23.9 |
5.9 |
1159.1 |
|
Exports |
N/a |
193.9 |
12.9 |
480.3 |
39.5 |
15.3 |
3.7 |
745.65 |
|
Basic grains |
N/a |
10.2 |
35.8 |
113.3 |
30.7 |
4.3 |
0.5 |
194.8 |
|
Fruit and vegetables |
N/a |
21.6 |
1.8 |
83.1 |
N/a |
4.2 |
0.3 |
111.0 |
|
Others |
N/a |
16.3 |
N/a |
77.6 |
12.3 |
0.1 |
1.4 |
107.7 |
|
2. Livestock |
N/a |
8.1 |
1.0 |
129.8 |
11.5 |
0.3 |
0.5 |
151.2 |
|
3. Fisheries and Aquicult |
N/a |
14.0 |
8.8 |
76.5 |
35.8 |
0 |
0 |
135.1 |
|
Total |
N/a |
264.1 |
60.3 |
960.6 |
129.8 |
24.2 |
6.4 |
1445.4 |
N/a= Not Available; Source: CORECA Secretariat, ECLACClearly, it was Honduras whose farming sector was hardest hit. Damage in Honduras totalled around US$960.6 million, equivalent to 66 percent of estimated total losses. The damage to its agriculture sector was equivalent to 65 percent of overall damage in the sector and accounted for 78 percent of overall damage sustained by Honduras in its farming sector. In absolute terms, Guatemala occupied second place in terms of the total value of sectoral losses, accounting for 18 percent of the total. Nicaragua suffered 9 percent of total losses, while the other countries accounted for the remaining 8 percent. In general, for all countries, it was the agricultural sector that sustained the most severe damage.
The crops most affected in each country were, in the case of Guatemala, bananas (56 percent of forecast production), coffee, 11 percent, and, to a lesser degree, garden vegetables and basic grains (although they are very important in economic terms, because they are grown by small producers). In the case of Honduras, the damage was focused on banana plantations (50 percent), and, to a lesser degree, basic grains, coffee and palm oil (each at 7 percent), while sugar cane and milk sustained losses of 6 percent. In Nicaragua the biggest losses were recorded in basic grains (beans, 71 percent; maize, 51 percent; and rice, 28 percent); sesame, at 65 percent of production; soya, 33 percent; peanuts, 27 percent; sorghum, 22 percent; bananas, 17 percent; and coffee and sugar cane, each with 6 percent. El Salvador sustained damage largely in the area of basic grains (49 percent), with the coffee sector accounting for 24 percent, sugar cane, 20 percent; and, to a lesser degree, garden vegetables (1 percent).
Chart 6. Damage to farming sector
The livestock sector reported losses among bovines, although, in the case of Nicaragua, the extent of those losses provoked some degree of doubt. In the remaining countries, however, the damage in this sector was focused primarily on the soil resource and livestock grazing areas, resulting in weight loss among fattening animals and a decline in milk production, which was influenced by the lack of communications routes, the lack of power at storage sites, and by the fact that the purchasing power of marketers was initially limited.
a. Basic grains
a.1 Trends in planting areas since Hurricane Mitch
Overall, the harvests since the hurricane have shown that the areas responsible for basic grains production have not fully recovered back to their levels prior to the hurricane. Each country has different trends for each basic grain. At a regional level, maize and beans seem to have had an increase in comparison the years prior to the Hurricane. The same recovery was not noted for rice. The country with the largest amount of agricultural lands is Nicaragua, and it has not recovered to the level of its highest historical production due to the very high production costs, and the high level of importation in competition with the national production.
El Salvador seems to have been the worst effected country where bean and rice production has decreased drastically by - 47.5 percent and -24 percent respectively in the last agricultural cycle. The reduction in area sown with beans is also important in Honduras (-27.5 percent), however Honduras has a great recovery with regards to rice (200 per cent for the 2000/20001 agricultural cycle)11 as can be seen on the table below:
Table 8. Trends in planting areas for basic grains - Agricultural cycles 1997/98-2000/2001
|
Country |
Agric. cycle |
Maize |
Beans |
Rice |
Total |
||||
|
ha |
(%)* |
ha |
(%)* |
ha |
(%)* |
ha |
(%)* |
||
|
Belize |
1997/98 |
16.9 |
14.6 |
4.2 |
1.3 |
6.2 |
7.8 |
27.3 |
10.7 |
|
1998/99 |
14.3 |
-15.0 |
4.6 |
9.2 |
5.2 |
-16.4 |
24.2 |
-11.6 |
|
|
1999/00 |
14.8 |
3.0 |
4.6 |
0.0 |
4.6 |
-11.8 |
23.9 |
-1.0 |
|
|
2000/2001 |
N/d |
|
N/d |
|
N/d |
|
N/d |
|
|
|
Guatemala |
1997/98 |
588.4 |
2.1 |
124.6 |
1.5 |
12.3 |
3.6 |
725.2 |
2.0 |
|
1998/99 |
588.7 |
0.1 |
124.6 |
0.0 |
13.3 |
8.6 |
726.6 |
0.2 |
|
|
1999/00 |
589.8 |
0.2 |
125.7 |
0.8 |
14.0 |
5.3 |
729.4 |
0.4 |
|
|
2000/2001 |
N/d |
|
N/d |
|
N/d |
|
N/d |
|
|
|
El Salvador |
1997/98 |
306.1 |
9.7 |
83.0 |
22.6 |
14.9 |
38.9 |
404.0 |
13.0 |
|
1998/99 |
295.4 |
-3.5 |
78.1 |
-5.9 |
10.3 |
-30.6 |
383.8 |
-5.0 |
|
|
1999/00 |
263.4 |
-10.8 |
151.9 |
94.6 |
10.9 |
5.8 |
426.2 |
11.1 |
|
|
2000/2001 |
260.7 |
-1.0 |
79.7 |
-47.5 |
8.3 |
24.0 |
348.7 |
-18.2 |
|
|
Honduras |
1997/98 |
388.8 |
-4.5 |
144.3 |
47.8 |
16.2 |
-0.6 |
549.3 |
5.4 |
|
1998/99 |
390.2 |
0.4 |
111.8 |
-22.5 |
5.7 |
-64.8 |
507.7 |
-7.6 |
|
|
1999/00 |
370.7 |
-5.0 |
110.2 |
-1.4 |
3.6 |
-36.8 |
484.5 |
-4.6 |
|
|
2000/2001 |
458.4 |
23.7 |
79.5 |
-27.9 |
11.1 |
208.3 |
549.0 |
13.3 |
|
|
Nicaragua |
1997/98 |
233.1 |
-16.5 |
135.0 |
12.6 |
74.9 |
10.8 |
443.0 |
-5.0 |
|
1998/99 |
252.6 |
8.4 |
189.3 |
40.2 |
83.2 |
11.1 |
525.1 |
18.5 |
|
|
1999/00 |
267.9 |
6.1 |
206.9 |
9.3 |
62.4 |
-25.0 |
537.2 |
2.3 |
|
|
2000/2001 |
363.5 |
35.7 |
250.7 |
21.2 |
71.3 |
14.3 |
685.5 |
27.6 |
|
|
All countries |
1997/98 |
1533.3 |
-1.5 |
491.1 |
19.2 |
124.5 |
10.9 |
2148.8 |
3.3 |
|
1998/99 |
1541.2 |
0.5 |
508.4 |
3.5 |
117.7 |
-5.4 |
2167.3 |
0.9 |
|
|
1999/00 |
1506.5 |
-2.3 |
599.2 |
17.9 |
95.5 |
-18.9 |
2201.2 |
1.6 |
|
|
2000/2001 |
1671.3 |
10.9 |
534.5 |
-10.8 |
104.0 |
8.9 |
2309.8 |
4.9 |
|
(percent)*= Growth rates; ha = Thousands of hectares; Source: Agriculture MinistriesAround 2.5 million hectares of basic grains were sown in the region in the last agricultural cycle. Of that total, 74 percent is devoted to the production of maize, 24 percent to the planting of beans and the remaining 2 percent to rice production. At the country level, Guatemala is the country where this commodity is most planted and consumed, with around 589 800 hectares, representing 35.3 percent of the total planted in the region. Honduras lies in second place, accounting for 27.4 percent of planting areas for this grain (458 400 ha). Nicaragua is third, accounting for 21.7 percent (260 700 ha). El Salvador is fourth, with 260 700 hectares (15.5 percent), and Belize lies in last place, with 14 800 hectares, or 1 percent of the total.
In the beans sector, the biggest planting areas are in Nicaragua, which makes up 46.9 percent of the sector, equivalent to around 250 700 hectares. Guatemala lies in second place, with sowing capacity of 124 600 hectares, equivalent to 23.3 percent. El Salvador is in third place, devoting around 79 900 hectares to the planting of beans, equivalent to 13.9 percent of the total. In fourth place is Honduras, with sowing capacity of around 110 200 hectares, equivalent to 18 percent. Belize, with 4 600 hectares, accounts for 1 percent of the total.
Rice-planting areas are the smallest among the three basic grains and the country with the highest planting capacity is Nicaragua, with 71 300 hectares of the 140 000 hectares planted during the agricultural cycle12. This is equivalent to 68.6 percent of the total. The other countries in which rice is planted are Guatemala, with percentage weightings of 12.8 percent, Belize and Honduras have planting areas equivalent to 7.9 percent and less than 4 percent respectively.
a.2 Trends in production volumes
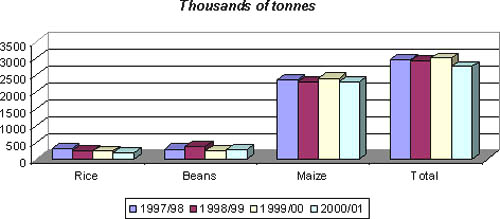
With respect to the production of basic grains, the path of the hurricane through Central America also led to a decline in productive potential during the agricultural cycle that was in progress at the time (1998/99). This was reflected in a decline of 5.6 percent, as illustrated in Table 9 and Chart 7.
Chart 7. Trends in production of basis grains
Of the three basic grains, rice was hardest hit at the regional level, with a fall in production, over the agricultural cycle, of 18.2 percent. This trend was largely maintained during the following agricultural cycle, with production declining once more, by 12.8 percent compared with the agricultural cycle before Mitch (1997/1998).
Honduras sustained the biggest losses in domestic rice production, losing 65.4 percent of forecast production, followed by Belize, with a decline of 43.5 percent, and El Salvador, with a 20.8 percent fall. Guatemala and Nicaragua did not experience declines in production. For the following agricultural cycle (1999/00), however, there was a major fall in production in Nicaragua (21 percent), while Honduras did recover The remaining countries have not managed to stabilize their productive capacity.
Table 9. Trends in production of basic grains - Agricultural cycles 1997/98-1999/00 (in thousands of tonnes)
|
Country |
Agric. cycle |
Golden Rice |
Beans |
Maize |
Total |
||||
|
Ton. |
(%)* |
Ton. |
(%)* |
Ton. |
(%)* |
Ton. |
(%)* |
||
|
Belize |
1997/1998 |
16.8 |
31.1 |
4.2 |
22.1 |
37.4 |
1.3 |
58.4 |
9.8 |
|
1998/1999 |
9.5 |
-43.5 |
3.1 |
-25.0 |
37.7 |
0.7 |
50.3 |
-13.9 |
|
|
1999/2000 |
12.6 |
33.5 |
3.7 |
16.5 |
40.7 |
8.1 |
57.0 |
13.4 |
|
|
2000/2001 |
N/d |
|
N/d |
|
N/d |
|
N/d |
|
|
|
Guatemala |
1997/1998 |
39.1 |
24.3 |
81.9 |
-9.3 |
976.8 |
-11.0 |
1097.8 |
-10.0 |
|
1998/1999 |
39.3 |
0.6 |
81.5 |
-0.5 |
986.5 |
1.0 |
1107.4 |
0.9 |
|
|
1999/2000 |
44.0 |
11.9 |
85.8 |
5.2 |
1004.2 |
1.8 |
1133.9 |
2.4 |
|
|
2000/2001 |
39.3 |
-10.7 |
81.5 |
-5.0 |
986.5 |
-1.8 |
1107.3 |
-2.3 |
|
|
El Salvador |
1997/1998 |
39.0 |
13.0 |
66.6 |
14.4 |
500.5 |
-19.4 |
606.1 |
-15.1 |
|
1998/1999 |
30.9 |
-20.8 |
45.9 |
-31.0 |
555.2 |
10.9 |
632.0 |
8.0 |
|
|
1999/2000 |
31.1 |
0.6 |
65.5 |
42.7 |
650.5 |
17.2 |
747.1 |
18.2 |
|
|
2000/2001 |
28.4 |
-8.7 |
68.3 |
4.3 |
577.5 |
-11.3 |
674.0 |
-9.8 |
|
|
Honduras |
1997/1998 |
50.3 |
-15.8 |
74.5 |
37.5 |
609.5 |
15.0 |
1555.5 |
10.3 |
|
1998/1999 |
13.8 |
-72.6 |
94.2 |
26.4 |
471.2 |
-22.7 |
|
-23.2 |
|
|
1999/2000 |
13.0 |
-74.2 |
73.7 |
-1.0 |
476.1 |
-21.9 |
1208.4 |
1.1 |
|
|
2000/2001 |
12.0 |
-6.5 |
74.8 |
-20.6 |
481.0 |
2.1 |
568.7 |
-1.8 |
|
|
Nicaragua |
1997/1998 |
166.3 |
16.5 |
71.4 |
-4.4 |
263.5 |
-18.2 |
501.2 |
-23.6 |
|
1998/1999 |
171.2 |
2.9 |
148.7 |
108.3 |
299.8 |
13.8 |
619.7 |
23.6 |
|
|
1999/2000 |
135.5 |
-20.9 |
134.2 |
-9.8 |
292.1 |
-2.6 |
561.8 |
-9.3 |
|
|
2000/2001 |
102.0 |
-40.2 |
62.2 |
-58 |
256.5 |
-14.4 |
421.1 |
-32 |
|
|
All Countries |
1997/1998 |
340.2 |
13.1 |
294.4 |
6.1 |
2350.3 |
-8.6 |
2956.2 |
-5.5 |
|
1998/1999 |
278.3 |
-18.2 |
370.3 |
25.8 |
2312.7 |
-1.6 |
3018.3 |
-0.3 |
|
|
1999/2000 |
242.6 |
-12.8 |
359.2 |
-3.0 |
2422.9 |
4.8 |
3018.3 |
2.4 |
|
|
2000/2001 |
183.0 |
22.5 |
286.8 |
-20.0 |
2301.3 |
-5.0 |
2771.1 |
-8.2 |
|
(%)* = Growth rate; Source: Agriculture MinistriesIn beans production, there were significant declines across all countries, with the exception of Honduras and Nicaragua,13 this last one which, in the "apante" (third, minor) season, staged a very significant recovery, due to implementation of an exceptional planting programme during that third and final phase of the agricultural cycle 1998/99. The overall production declined in Belize, El Salvador and, with less importance, Guatemala, however, excluding the aforementioned exceptional harvest in Nicaragua, the damage for the remaining countries in the region would have amounted to a 25 percent fall. The immediate impact of the Hurricane per country was as follows: production in Honduras increased by 26.4 percent. El Salvador and Belize sustained declines of 31 and 25 percent, respectively, and Guatemala registered a very slight decline, of less than 1 percent. Nicaragua achieved a better production than the year prior to the hurricane. (see Table 9).
In the case of maize, the picture was slightly brighter with respect to the fall in production during the cycle in question. This is because it is during the first cycle (May to September) that the majority (70 percent) of the overall crop is harvested. If the crop had been in the field at the time, the damage would have been greater. Despite this, Honduras was the only country among those affected by the Hurricane that sustained a fall (estimated at 22.7 percent) in productive capacity compared with the previous agricultural cycle. During the agricultural cycle marked by Hurricane Mitch, Honduras accounted for 20 percent (471 000 tonnes) of the total production of the countries affected. Under normal conditions, that figure is 26 percent. The first producer in the region is Guatemala, with production of around 1.0 million tonnes. El Salvador is third biggest, with production of 555 200 tonnes. Nicaragua, with production of slightly below 300 000 tonnes, lies in fourth place, while Belize, with a percentage weighting of 1 percent (37 700 tonnes), is fifth.
It should be noted that for the agricultural cycle 1997/98, maize and beans both showed declines in production, compared with the 1996/97 cycle, and the main reason was the presence of El Niño, which brought floods to Guatemala and drought to the rest of the region, which reduced the productive capacity of those grains, with the exception of Honduras, El Salvador and Belize. In the case of maize, the overall decline in production among the countries was 6.8 percent. In beans, production in Honduras was significant during the 1997/98 cycle and, as a result, no major changes were noted in regional production. The remaining countries, however, sustained declines of around 10 percent (see Annex 6). Lastly, there were no major changes in rice production.
According to forecasts by international agencies concerning El Niño, it is very possible that, during the agricultural cycle 2001/02, we shall see the first indications of its return. El Niño is caused by the warming of the waters of the Pacific Ocean. It brings drought to El Salvador, Honduras, Nicaragua and Costa Rica, and intense rains to Guatemala and Belize.
a.3 Impact of Hurricane Mitch on yields
The impact on yields of basic grains is shown in Table 10, which also highlights the major disparities between the different countries with regard to the optimization of productivity. Nicaragua is the country with the lowest yields in the three crops. Its maize yields are four times lower than in Belize and three times lower than in Honduras, and between 70 percent and 90 percent below production levels in El Salvador and Guatemala.
Belize has the highest maize yields (4.26 tonnes/ha), followed by Honduras (2.9 tonnes/ha). In beans even if a big decrease in the production occurred during the agricultural cycle 2000/2001 up to 1.05 mT/ha, the same countries have the highest yields per hectare, with 1.5 and 1 respectively. In golden rice, the most efficient producers are Belize and Honduras, with 3.,7 tonnes/ha, and 3.6 tonnes/ha.
Table 10. Trends in basic-grain yields - Agricultural cycles 1997/98-2000/01 (tonnes per hectare)
|
Country |
Agric. cycle |
Maize |
Beans |
Golden rice |
|||
|
Tonne/ha |
(%)* |
Tonne/ha |
(%)* |
Tonne/ha |
(%)* |
||
|
Belize |
1997/98 |
4.05 |
2.3 |
1.30 |
-12.2 |
4.40 |
12.8 |
|
1998/99 |
4.08 |
0.7 |
1.24 |
-4.6 |
3.70 |
-15.9 |
|
|
1999/00 |
4.26 |
4.4 |
1.47 |
18.5 |
3.70 |
0.0 |
|
|
2000/2001 |
N/d |
|
N/d |
|
N/d |
|
|
|
Guatemala |
1997/98 |
1.66 |
-12.6 |
0.66 |
1.5 |
3.19 |
19.9 |
|
1998/99 |
1.68 |
1.2 |
0.65 |
-1.5 |
2.96 |
-7.2 |
|
|
1999/00 |
1.70 |
1.2 |
0.68 |
4.6 |
3.14 |
6.1 |
|
|
2000/2001 |
1.68 |
-1.2 |
0.65 |
-4,0 |
2.96 |
|
|
|
El Salvador |
1997/98 |
1.60 |
-27.3 |
0.80 |
-11.1 |
2.60 |
-18.8 |
|
1998/99 |
1.90 |
18.8 |
0.60 |
-25.0 |
2.90 |
11.5 |
|
|
1999/00 |
2.00 |
5.3 |
0.80 |
33.3 |
2.80 |
-3 |
|
|
2000/2001 |
2.21 |
10.5 |
0.86 |
7.0 |
3.42 |
22.1 |
|
|
Honduras |
1997/98 |
3.30 |
13.8 |
1.40 |
0.0 |
3.10 |
-15.5 |
|
1998/99 |
2.70 |
-18.2 |
1.10 |
-21.0 |
2.42 |
-21.9 |
|
|
1999/00 |
2.90 |
7.4 |
1.10 |
0.0 |
3.61 |
49.2 |
|
|
2000/2001 |
1.05 |
-63.8 |
0.94 |
-14.0 |
1.16 |
-67.9 |
|
|
Nicaragua |
1997/98 |
0.79 |
-2.5 |
0.37 |
-15.9 |
1.95 |
18.8 |
|
1998/99 |
0.83 |
5.1 |
0.55 |
48.6 |
1.76 |
-7.4 |
|
|
1999/00 |
1.09 |
31.3 |
0.64 |
16.4 |
2.17 |
23.3 |
|
|
2000/2001 |
0.71 |
-34,9 |
0.25 |
-60.0 |
1.44 |
-33.6 |
|
|
Average regional yield |
1997/98 |
1.84 |
-5.9 |
0.81 |
-4.0 |
2.71 |
-2.6 |
|
1998/99 |
1.78 |
-3.3 |
0.73 |
-10.0 |
2.51 |
-7.4 |
|
|
1999/00 |
1.92 |
8.2 |
0.81 |
11.0 |
2.93 |
16.7 |
|
|
2000/2001 |
1.41 |
-26.5 |
0.68 |
-16 |
2.25 |
-23.4 |
|
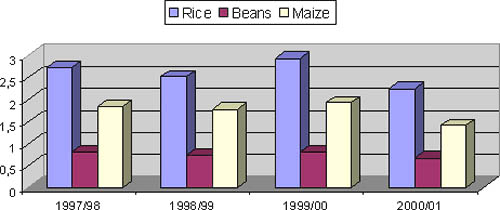
(percent)*= Growth rate; Source: Agriculture MinistriesGeneral trends in grains show that, in the case of maize, only Honduras suffered a decline in tonnes per hectare during the year of Hurricane Mitch. Due to its importance to regional production, however, there was an overall fall in the regional indicator (3,3 percent). The 18 percent decline recorded by Honduras therefore has a major impact. The remaining countries saw average growth average of 6.4 percent, led by El Salvador, with 18.8 percent.
As far as the productive profitability of beans is concerned, the countries involved (with the exception of Nicaragua), suffered a 13.1 percent decline in their yields, with El Salvador and Honduras hardest hit, recording falls of 25 percent and 21.4 percent, respectively. Belize and Guatemala sustained falls of 4.6 percent and 1.5 percent, respectively. During the following year, all countries together increased yields by 13.3 percent, with the exception of Honduras, whose yield was unchanged from the agricultural cycle marked by Hurricane Mitch, as in Nicaragua (see Table N° 10).
The rice sector declined 5.4 percent on average during the year of Hurricane Mitch, but recovered the next year, recording a 6.1 percent average rise (very slightly exceeding the average yield recorded during the year prior to Mitch). With the exception of El Salvador, all countries recorded falls during the year of the hurricane. The greatest impact was recorded in Belize (-15.9 percent), followed by Nicaragua (-7.4 percent), Guatemala (-7.2 percent) and Honduras (-2 percent).
Chart 8. Trends in yields of basic grains tonnes/hectare by agricultural cycle
b. Impact on production of meat, milk and eggs
Hurricane Mitch did not have a major impact in the beef, pork and poultry sectors. Although deaths of cattle and pigs certainly did occur, it did not have an overall negative impact on production. Indeed, there is clearly a growth trend in production for the countries overall (4 percent in 1998 and 2 percent in 1999).
El Salvador was the only country to record declines in beef production, of 1.9 percent in 1998 and 21.3 percent in 1999. Belize experienced a 20 percent fall in production in 1998, and Nicaragua suffered a 12.2 percent fall in production in the same year, although it did regain its previous production levels, slightly exceeding the 1997 figure. It should be noted that in the production of chicken, Nicaragua was the only country to register a decline in its productive capacity, of 1.8 percent, as shown in Table 11, below.
With respect to production of milk and hen's eggs, Table 12 shows that the overall trend in the region is one of growth. Furthermore, although no data are available regarding results for last year in Guatemala, the overall trend is positive, and no significant damage was reported in this productive sector.
Table 11. Trends in meat production - 1997-1999 (millions of Kilograms)
|
Country |
Year |
Beef |
Pork |
Chicken |
Total |
||||
|
M/kg |
(%)* |
M/kg |
(%)* |
M/kg |
(%)* |
M/kg |
(%)* |
||
|
Belize |
1997 |
1.50 |
7.1 |
0.70 |
0.0 |
5.50 |
-27.6 |
7.70 |
-20.6 |
|
1998 |
1.50 |
0.0 |
0.80 |
14.3 |
7.60 |
38.2 |
9.90 |
28.6 |
|
|
1999 |
1.20 |
-20.0 |
0.90 |
12.5 |
8.40 |
10.5 |
10.50 |
6.1 |
|
|
Guatemala |
1997 |
69.20 |
18.9 |
15.00 |
-15.3 |
75.70 |
2.6 |
159.90 |
6.8 |
|
1998 |
72.60 |
4.9 |
17.20 |
14.7 |
77.70 |
2.6 |
167.50 |
4.8 |
|
|
1999 |
68.20 |
-6.1 |
17.30 |
0.6 |
79.30 |
2.1 |
164.80 |
-1.6 |
|
|
El Salvador |
1997 |
34.68 |
29.7 |
149.30 |
15.7 |
56.86 |
7.4 |
240.84 |
15.4 |
|
1998 |
34.02 |
-1.9 |
154.50 |
3.5 |
62.86 |
10.6 |
251.38 |
4.4 |
|
|
1999 |
26.77 |
-21.3 |
156.50 |
1.3 |
69.46 |
10.5 |
252.72 |
0.5 |
|
|
Honduras |
1997 |
133.10 |
4.0 |
15.40 |
4.7 |
50.20 |
2.0 |
198.70 |
3.5 |
|
1998 |
138.30 |
3.9 |
16.10 |
4.5 |
56.90 |
13.3 |
211.30 |
6.3 |
|
|
1999 |
143.80 |
4.0 |
16.70 |
3.7 |
60.10 |
5.6 |
220.60 |
4.4 |
|
|
Nicaragua |
1997 |
51.70 |
6.4 |
5.40 |
8.0 |
29.60 |
-4.8 |
86.70 |
2.4 |
|
1998 |
45.40 |
-12.2 |
5.60 |
3.7 |
32.70 |
10.5 |
83.70 |
-3.5 |
|
|
1999 |
52.10 |
14.8 |
5.70 |
1.8 |
32.10 |
-1.8 |
89.90 |
7.4 |
|
|
All countries |
1997 |
290.18 |
10.4 |
185.80 |
11.2 |
217.86 |
1.5 |
693.84 |
7.6 |
|
1998 |
291.82 |
0.6 |
194.20 |
4.5 |
237.76 |
9.1 |
723.78 |
4.3 |
|
|
1999 |
292.07 |
0.1 |
197.10 |
1.5 |
249.36 |
4.9 |
738.52 |
2.0 |
|
Source: Agriculture MinistriesDespite this, El Salvador recorded a 7 percent decline in its milk-production capacity in the year of Hurricane Mitch. It was able to redress that situation in 1999, recording an increase of 2.3 percent. It was not, however, able to recover the production levels of 1997. In egg production, Belize and Nicaragua recorded declines, during the year after the hurricane, of 17.1 percent and 7.8 percent respectively. Nicaragua also recorded a fall in 1998, of 4.4 percent.
Table 12. Trends in milk and egg production 1997-1999
|
Country |
Year |
Milk |
Eggs |
||
|
million litres |
(%)* |
million dozens |
(%)* |
||
|
Belize
|
1997 |
1.4 |
N/a |
2.6 |
13.0 |
|
1998 |
1.4 |
0.0 |
3.5 |
34.6 |
|
|
1999 |
1.6 |
14.3 |
2.9 |
-17.1 |
|
|
Guatemala
|
1997 |
255.8 |
0.5 |
125.1 |
11.2 |
|
1998 |
257.1 |
0.5 |
130.1 |
4.0 |
|
|
1999 |
N/a |
0.0 |
N/a |
0.0 |
|
|
El Salvador |
1997 |
356.4 |
-4.1 |
83.4 |
2.5 |
|
1998 |
331.5 |
-7.0 |
84.7 |
1.5 |
|
|
1999 |
339.0 |
2.3 |
87.3 |
3.1 |
|
|
Honduras |
1997 |
579.0 |
12.0 |
71.8 |
3.3 |
|
1998 |
674.2 |
16.4 |
72.7 |
1.3 |
|
|
1999 |
707.1 |
4.9 |
76.6 |
5.4 |
|
|
Nicaragua |
1997 |
202.5 |
11.4 |
22.7 |
8.6 |
|
1998 |
212.6 |
5.0 |
21.7 |
-4.4 |
|
|
1999 |
323.3 |
52.1 |
20.0 |
-7.8 |
|
|
Total for all countries |
1997 |
1,395.1 |
5.2 |
305.6 |
6.6 |
|
1998 |
1,476.8 |
5.9 |
312.7 |
2.3 |
|
|
1999 |
1,371.0 |
-7.2 |
186.8 |
-40.3 |
|
N/a= Not Available; Source: Agriculture Ministriesc. Trends in production of wheat flour, sugar and edible oil
In general, throughout the region, the level of wheat bread consumption is high, due to the substitution of foods with a high nutritional value for the bread mostly consumed by low-income sectors. The production of flour depends on the number of people in the country and on whether it is possible to import wheat.14
The country that produces or processes the most wheat is Guatemala, with 38 percent; and El Salvador, in second place, with 21 percent. Honduras processes 20 percent, and increased its production in 1998 and 1999, by 1.7 percent and 4 percent respectively. Nicaragua suffered a fall in production in 1998, but the following year managed to recover its 1997 production levels, processing 17 percent of regional capacity. Overall, production rose 4 percent between 1997 and 1999, as shown in Table 13.
Sugar production, which is aimed primarily at external markets, declined in three of the five countries hardest hit by Hurricane Mitch. The country most affected was Honduras, which in the year following the hurricane saw its production decline by 23 percent. Like Guatemala and El Salvador, however, Belize and Nicaragua maintained virtually the same production level, although, as the above Table illustrates, the overall reduction for all five countries was 3.5 percent in 1998 and 2.6 percent in the following year.
Table 13. Trends in agribusiness production - 1997-1999
|
Country |
Year |
Wheat Flour |
Sugar |
Edible Oil |
|||
|
Tonnes |
(%)* |
Tonnes |
(%)* |
Million litres |
(%)* |
||
|
Belize |
1997 |
N/a |
N/a |
94.51 |
-13.3 |
N/a |
N/a |
|
1998 |
N/a |
N/a |
118.11 |
25.0 |
N/a |
N/a |
|
|
1999 |
N/a |
N/a |
116.07 |
-1.7 |
N/a |
N/a |
|
|
Guatemala |
1997 |
N/a |
N/a |
1 731.16 |
-2.6 |
N/a |
N/a |
|
1998 |
N/a |
N/a |
1 529.58 |
-11.6 |
N/a |
N/a |
|
|
1999 |
N/a |
N/a |
N/a |
N/a |
N/a |
N/a |
|
|
El Salvador |
1997 |
N/a |
N/a |
393.13 |
28.8 |
N/a |
N/a |
|
1998 |
N/a |
N/a |
467.11 |
18.8 |
N/a |
N/a |
|
|
1999 |
N/a |
N/a |
450.35 |
-3.6 |
N/a |
N/a |
|
|
Honduras |
1997 |
102.60 |
4.2 |
240.90 |
2.4 |
59.55 |
18.8 |
|
1998 |
104.30 |
1.7 |
246.90 |
2.5 |
60.26 |
1.2 |
|
|
1999 |
108.50 |
4.0 |
189.80 |
-23.1 |
58.54 |
-2.9 |
|
|
Nicaragua |
1997 |
68.00 |
20.4 |
347.80 |
13.6 |
25.80 |
-23.1 |
|
1998 |
65.30 |
-4.0 |
348.60 |
0.2 |
22.70 |
-12.0 |
|
|
1999 |
68.00 |
4.1 |
353.30 |
1.3 |
40.00 |
76.2 |
|
|
Total |
1997 |
170.60 |
10.1 |
2 807.50 |
2.7 |
85.35 |
1.9 |
|
1998 |
169.60 |
-0.6 |
2 710.31 |
-3.5 |
82.96 |
-2.8 |
|
|
1999 |
176.50 |
4.1 |
2 639.10 |
-2.6 |
98.54 |
18.8 |
|
N/a= Not Available; Source: Agriculture MinistriesProduction of edible oil declined by 2.9 percent in Honduras, where African palm plantations were affected by the floods provoked by the hurricane. Nicaragua, however, recorded a significant (76 percent) production increase. Production in the remaining countries of the region remained stable, because a major part of the totals reflects production of semi-refined oil imported from the United States and Europe.
a. Import trends
Imports of the 11 foods in the food basket have remained strong over the years. During the 1990s, there was a marked dependence on imports of products that are essential to the diet of the people of Central America. Cereals have always been the major focus and basic grains have always been the most important cereals for the region's poor communities.
Over the past six years (see Annex 11) imports of cereals have been above 8 million tonnes. The most heavily imported grain is maize, which accounts for 42 percent (3.4 million tonnes) of the total. Wheat imports are close behind, at 3.0 million tonnes. This figure does not include imports by Guatemala over the last three years, which are equivalent to around 600 000 tonnes. Belize is also a strong importer of wheat, but does not keep current records of import totals for this crop, which plays a major role in the diet of working-class sectors of the country.
Rice is the third-biggest imported crop, at 1.0 million tonnes, with imports of beans standing at 581 000 tonnes.
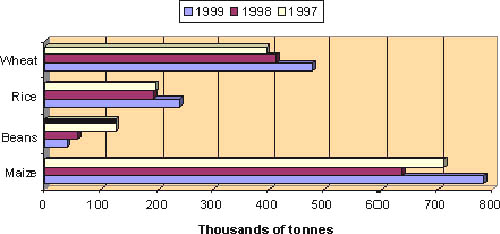
Imports of basic grains reached their highest levels during the year after Mitch, as indicated in Table 14. Whereas the trend was for declines in the year of the hurricane, in the year 1999, imports of maize were 23 percent higher than the previous year. Rice imports grew 25 percent between 1998 and 1999, while wheat imports grew by 16 percent over the same period. Again, this does not include the around 600 000 tonnes imported by Guatemala. If this were included, growth in wheat would be 200 percent for the period. Imports of beans did not rise. Indeed, domestic production levels in all countries of the region helped dampen imports of this crop.
Table 14. Trends in imports of cereals 1997-1999, in thousands of tonnes
|
Country |
Year |
Maize |
Beans |
Rice |
Flour/wheat |
|
Belize |
1997 |
35.00 |
61.40 |
3.67 |
N/a |
|
1998 |
26.20 |
39.80 |
7.64 |
N/a |
|
|
1999 |
28.10 |
12.10 |
11.00 |
N/a |
|
|
Guatemala |
1997 |
247.70 |
0.10 |
26.30 |
N/a |
|
1998 |
259.80 |
0.10 |
3.20 |
N/a |
|
|
1999 |
270.50 |
0.00 |
24.60 |
N/a |
|
|
El Salvador |
1997 |
326.02 |
63.24 |
34.28 |
173.10 |
|
1998 |
259.02 |
7.21 |
46.14 |
217.10 |
|
|
1999 |
361.29 |
18.06 |
82.08 |
214.00 |
|
|
Honduras |
1997 |
100.20 |
0.60 |
50.10 |
142.10 |
|
1998 |
86.70 |
2.00 |
71.10 |
134.10 |
|
|
1999 |
114.00 |
2.00 |
81.60 |
226.80 |
|
|
Nicaragua |
1997 |
1.40 |
1.80 |
79.50 |
79.50 |
|
1998 |
4.00 |
9.80 |
61.80 |
61.80 |
|
|
1999 |
3.40 |
8.00 |
38.40 |
38.40 |
|
|
All countries |
1997 |
710.52 |
127.14 |
193.85 |
394.70 |
|
1998 |
636.72 |
58.91 |
189.88 |
413.00 |
|
|
1999 |
783.65 |
40.16 |
237.68 |
479.20 |
N/a= Not Available; Source: Agriculture Ministries.The countries with the highest levels of maize imports are El Salvador and Guatemala, which recorded total volumes of 946 000 tonnes and 777 000 tonnes, respectively, over the three years in question (1997-1999). This amounts to around 1.7 million tonnes, or 81 percent of total volumes over the period. Honduras imported 14 percent over the same three-year period. The remaining six percent of imports were recorded by Belize and by Nicaragua. The level of maize imports by Nicaragua indicates that it is aiming to achieve self-sufficiency through domestic production.
In beans, Belize and El Salvador are the biggest importers, accounting for 50 percent and 39 percent, respectively, of total imports for the past three years. The remaining 11 percent is shared between Nicaragua, Honduras and Guatemala, respectively.
Levels of rice imports are slightly more uniform across all countries in the region. Honduras, however, is the biggest importer, with 33 percent of the total over the last three years, followed by Nicaragua (29 percent), El Salvador, with 26 percent; Guatemala, nine percent; and Belize the remaining three percent. It should be stressed that imports of this product have been rising in general, due to the high costs of domestic production in the region and growing competition from sales representatives of industrialized nations and Asia, whose costs and yields are significantly higher than in Central America. There is also a tendency for countries in the region to spend more on imports than on the promotion of domestic production, thereby placing many small producers in a critical condition, without the opportunity to diversify their production over the short term.
Chart 9. Trends in cereal import
Many of these import totals also reflect a trade strategy implemented by brokers of domestic production, who use protective mechanisms without taking into account domestic stocks, which are also heavily influenced by the unfair trading practices employed by sales representatives of the main producing areas of the United States.
In the wheat sector, the country that depends most heavily on imports is Guatemala, followed by El Salvador and Honduras. Together, these three countries account for 90 percent of regional imports, with Nicaragua and Belize accounting for the remaining 10 percent.
In monetary terms, imports of these four foods are equivalent to US$642.3 million over the last three years. Of that total, maize accounts for US$213.1 million dollars; rice US$149.1 million; wheat, around US$144.5 million; and beans, US$135.7 million. The total value of imports is equivalent to a little less than three percent of total exports from the region over the same period. In view of its significance, however, in terms of unrealized investment in the promotion of domestic production of basic grains, it does represent a way to ensure capacity to export to nearby markets.
The other subgroup of imported foods comprises edible oil and products of animal origin (chicken, milk and eggs). Note that the region does not import sugar, beef or pork, and pork is moved in such small quantities that it is not reflected in detail in import figures.
Table 14-B (for more details, see also Annex 11-B) shows the results of imports in this subgroup. The totals for edible oil are proportionately very high, since, with the exception of Honduras, countries in the region do not have the capacity to produce 100 percent of their needs. Semi-refined oil is therefore imported for domestic processing. Annual imports have been around 900 million litres since Mitch, with El Salvador the biggest importer (83 percent of the total for 1999) and, to a lesser degree, Belize and Nicaragua.
Chicken imports are not significant, since the regional poultry industry has in-built capacity to meet domestic demand. This is the same for the egg industry, which in 1999 did not record any imports, despite the effects of the hurricane. As a product for basic consumption, powdered milk is imported for reconstitution. Imports recovered sharply 1998, due to problems with domestic communications routes, which made it impossible to transport the milk from the production areas to milk-processing sites for pasteurisation. In 1999, however, imports fell sharply, to the equivalent of 58.5 million litres. Nicaragua, El Salvador, Honduras and Belize, respectively, are the biggest importers of powdered milk for reconstitution.
Table 14-B. Trends in food imports 1997-1999
|
Country |
Year |
Oil (1) |
Chicken (2) |
Milk (1) |
Eggs (3) |
|
Belize |
1997 |
109.50 |
0.50 |
5.28 |
0.00 |
|
1998 |
99.00 |
0.70 |
9.38 |
0.00 |
|
|
1999 |
131.00 |
0.80 |
5.77 |
0.00 |
|
|
Guatemala |
1997 |
49.70 |
12.90 |
26.10 |
26.10 |
|
1998 |
51.70 |
15.10 |
28.40 |
28.40 |
|
|
1999 |
N/a |
N/a |
N/a |
N/a |
|
|
El Salvador |
1997 |
75.67 |
0.00 |
6.95 |
0.00 |
|
1998 |
777.87 |
0.00 |
17.01 |
0.00 |
|
|
1999 |
769.60 |
0.00 |
18.53 |
0.00 |
|
|
Honduras |
1997 |
0.90 |
4.00 |
9.40 |
0.00 |
|
1998 |
1.40 |
4.30 |
12.20 |
0.00 |
|
|
1999 |
3.00 |
3.60 |
13.00 |
0.00 |
|
|
Nicaragua |
1997 |
40.90 |
1.10 |
39.40 |
0.00 |
|
1998 |
47.70 |
1.90 |
69.70 |
0.00 |
|
|
1999 |
23.00 |
0.10 |
21.20 |
0.00 |
|
|
All countries |
1997 |
276.67 |
18.50 |
87.14 |
26.10 |
|
1998 |
977.67 |
22.00 |
136.69 |
28.40 |
|
|
1999 |
926.60 |
4.50 |
58.51 |
0.00 |
(1) millions of litres; (2) millions of kilos; (3) millions of dozens; N/a: Not AvailableThe implementation of livestock-development programmes, designed to improve the quality of dairy cattle in Central American countries, is focused only on major producers. The persistent weaknesses among small and medium-sized producers make it impossible to foresee a recovery in this productive sector over the medium term. As in the cereals sector, everything appears to indicate that the strategy employed is to concentrate on promoting imports rather than on domestic production. Note, however, that even big producers have recently been experiencing problems with costs, liquidity and productive profitability, due to competition from imports.
Source: Agriculture Ministries
b. Trends in food exports
Products in the food basket are not habitually or systematically exported by countries in the region. Of the products included in the list (see Annex 12), sugar occupies first place. Guatemala is the region's biggest sugar exporter, with 76 percent of export capacity. Maize is the second-biggest export, with the main maize exporters being Guatemala and Nicaragua. Beans are exported mainly by Nicaragua (79 percent); while edible oil is exported primarily by Honduras (88 percent). El Salvador is the sole exporter of eggs and thus has an impact on regional markets. Nicaragua is the principal exporter of beef, accounting for 93 percent of exports over the past year.
Among the remaining products, export levels are insignificant, and are generally sold in the regional market. The region does not exploit its potential as much as it could. Incentives to improve and strengthen domestic production continue to decline. This also includes intra-regional trade, since exports and imports of basic foods between the countries in the region are becoming increasingly rare. The exceptions are industrialized products and those mentioned above. Exports are focused on non-traditional products and food imports, although this strategy includes only a privileged group of producers. This is a disadvantage for small and medium-sized producers of basic foods for domestic consumption.
In this context, the greatest disadvantages are to be found in El Salvador, Guatemala, Nicaragua and Honduras, respectively. Belize is an importer of foods for domestic consumption. Most of those foods come from markets outside the region, as Central America's exporters pay very little attention to this small country. In fact, intra-regional trade to satisfy domestic demand for the basic foods in the food basket might be achieved through a strategy under which production agreements or contracts are established between countries, providing mutual benefit to exporters and producers. Mechanisms of this kind would have the effect of reducing the pressure on poor rural areas of countries in the region and also lead to better opportunities in alternative, high-import markets, such as Mexico and the Caribbean.
In conclusion, it may be stated that the availability of foods in the countries affected by Hurricane Mitch has deteriorated, since domestic production suffered as a result of food imports generated immediately after the disaster. In some countries, foods were imported even though local production was available in the farms and the stores. Added to this, there was the impact of donations made by humanitarian organizations to urban and rural populations suffering as a result of the hurricane.
The provision of technical and financial assistance to improve domestic production was inadequate (except during the initial aftermath). Worse, still, there is a tendency to reduce planting areas for certain crops, such as rice and maize, as well as a decline in agricultural extension services and an inability to incorporate new varieties of seeds that are already proven in the countries of the region and which are very hard for small producers to access. In the medium term, this might bring tragic consequences and produce a considerable amount of migration to the cities and abroad, if steps are not taken to restore productivity - all the more so, as rural poverty is expanding at an alarming rate in all the countries affected.
The only strategies for reincorporating the productive capacity of the food sector have been supplied - albeit to a limited degree - by non-governmental organizations, international cooperation agencies and, to a lesser degree, by State agencies. This response is inadequate, however, and requires the implementation of a national programme in each affected country, since Hurricane Mitch had the effect of accentuating the natural decline of this productive sector. Even as the number of farmers declines steadily with each passing day, so does the number of those searching for work in the streets of the region's capital cities increase.
![]()
![]()
![]()