![]()
![]()
![]()
1. Impact of Hurricane Mitch on regional markets
2. Food balances
3. Analysis of farm credit
4. Trends in prices of basic grains
The biggest impact on regional markets, during the period immediately after the hurricane, was the destruction of the transport infrastructure, of roads, tracks and bridges. The total extent of the damage was equivalent to 27 754 kilometres of roads and tracks, and 156 bridges. As a result, flows of cargo and people to those markets were interrupted, and the cost of urgent items rose temporarily during the period immediately after the hurricane.
There was no physical damage to installations in general. As far as international road, sea and air trade was concerned, the effects were chaotic for the first month after the hurricane, and eventually returned to normality at the beginning of 1999. Indirectly, markets were affected by the destruction of electrical systems and networks, as well as damage to drinking water systems.
From a structural viewpoint, food markets suffered restrictions due to the destruction of the infrastructure. It was apparent, however, that most countries had the capacity to implement immediate actions, even by supplying some needs through local production, although in practice, there were very few ways in which this type of action could be co-ordinated. Within the region, it was possible to transport emergency production of basic grains in Nicaragua to markets in El Salvador and Honduras, due to pre-existing trade links with those countries.
Trading in foods outside the region is almost non-existent, and it appears to be regarded as an outmoded productive activity. Official figures from all countries in the region, as well as from neighbouring countries, indicate that they will all become importers of cereals and processed foods in the immediate future. It thus appears that the production of food is not regarded as a strategic way to resolve problems of diet and malnutrition, nor as an alternative form of national income or a way to create jobs and expand markets.
The countries affected by the hurricane do not maintain food balances that might provide an indication of the status of national inventories and the rate of consumption relative to the availability of basic foods. As a result, it is not possible to gain a clearer sense of how to formulate a national import policy or a policy for the promotion of domestic production, or even to gain some idea of how vulnerable the population may be to cyclonic events or other types of disaster. As a result, when disaster strikes, any possible planning of food imports or donations is based on emergency situations, without their being any real awareness of available domestic capacity.
Agriculture Ministries in the region - with the exception of Nicaragua's, which recorded balances up to the year 1999 - do not have official departments charged with this task, despite the fact that they have received instruction and training in such matters from FAO and, more recently, from the United States Department of Agriculture.15
During the field visits made by the consultant, it became apparent that it would be necessary to provide follow-up in this area, since it was quite clear that relying on improvisation in the area of food affects all countries in the region. There is an effort currently underway to this effect in Guatemala, in the form of a draft policy on Food Security. At this point, however, there are no monitoring operations and no calculation of balances. Even in countries where some information is available, such information is generally very limited. Nicaragua has introduced its National Food Security and Nutrition Policy, but it lacks a plan of action for its due execution.
It proved extremely difficult to obtain information about the national balances of each country, and indeed for the 11 products in the food basket. Furthermore, it was possible to obtain only partial information regarding basic grains. For the people interviewed during the collection of country data, the food balance proved to be unknown as a working tool.
Balances for basic grains (see Annex 16) show that the countries affected consume around 1.8 million tonnes of maize, 700 000 tonnes of beans and around 406 000 tonnes of rice per annum. However, if one looks at the total utilization of products, including losses, use of seeds and utilization for the manufacture of balanced foods, the results are as follows: In maize, total utilization is 2.4 million tonnes; in beans, 1.2 million tonnes; and in rice, around 456 500 tonnes. This amounts to overall annual consumption of 4.1 million tonnes for these three products.
As for the remaining eight products in the food basket, it was not possible to determine precise intake data. This situation should have been rectified, especially after Hurricane Mitch, to help toward national food-security planning, based on national market balances. Nor is any use made of the food-balances method to determine the nutritional status of the population at the end of each year or to help identify alternative forms of food consumption. In some cases, the method is even unknown, especially in those countries that have recently elected new national governments.
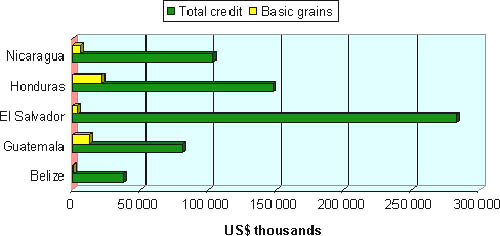
Central America is known as a region with a high level of basic-grains consumption. Their production, however, must take place within an unfavourable context and without the necessary funding. Indeed, the region depends on imports as a supplement to domestic consumption. This situation is illustrated by Table 15, which shows that scarcely 7.9 percent of the average total funding for the agriculture sector is spent on the production of maize, beans and rice.
Among the countries affected by Hurricane Mitch, Belize and El Salvador provide the least funding for this key area of production, intended for domestic consumption. The two countries allocate only 1.2 percent and 1.3 percent of financial resources, respectively. Guatemala and Honduras have the highest production rates among all countries in the region with respect to production of basic grains, allocating 15.7 percent and 15.4 percent, respectively, to this activity. Nicaragua is in a relatively low position in this context (5.7 percent), and this will do little to promote the considerable potential the country has to create high-production mechanised farmland in its Pacific plains, with their fertile, volcanic soils. Nor will it help to develop such production in the country's broad, intra-mountain valleys, where small producers are feeling the impact of the lack of funding (as indeed are producers from the other countries in the region, whose problems are very similar).
Table 15. Trends in farm credits in countries affected by Hurricane Mitch
|
Country |
Total farm credit* US$ thousands |
Basic grains |
||
|
US$ thousands |
% |
Ha thousands financed |
||
|
Belize |
37638.2 |
447.3 |
1.2 |
N/a |
|
Guatemala |
81130.4 |
12720.0 |
15.7 |
708.2 |
|
El Salvador |
282681.7 |
3544.2 |
1.3 |
2.9 |
|
Honduras |
147183.3 |
21866.7 |
15.4 |
63.4 |
|
Nicaragua |
103727.1 |
5864.7 |
5.7 |
20.1 |
|
Average |
130472.0 |
8888.5 |
7.9 |
794.6 |
* Average of last 6 years; N/a= Not Available; Source: Central Banks.Guatemala has the largest funded area, at around 708 200 hectares on average over the last six years (see also Annex 18). This makes Guatemala the region's main producer. Honduras and Nicaragua have much smaller funded areas, which are out of keeping with the capacities that exist the countries of Central America as a whole, where the potential land is estimated to be around 3.5 million hectares. This means that only 23 percent of that potential is managed with credits, with the rest of the funding being allocated to traditional export crops, such as coffee.
Chart 10. Credit for basic as a proportion of total farm credits
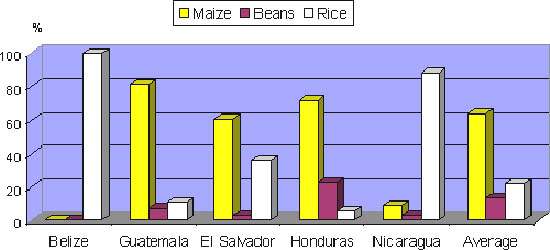
One significant aspect of this problem is the structure of the relatively small amount of funding provided for basic grains. Maize accounts for 64 percent of that funding, while rice accounts for 22 percent, and beans (the largest source of protein for poor population sectors), receive 14 percent, as shown in Table 16.
Table 16. Structure of funding for production of basic grains in countries affected by Hurricane Mitch*
* Average for last 6 years;
|
Country |
Total % |
Maize |
Beans |
Rice |
|
100 |
0.0 |
0.0 |
100.0 |
|
100 |
81.8 |
7.2 |
11.0 |
|
100 |
60.8 |
2.9 |
36.3 |
|
100 |
71.6 |
22.5 |
5.9 |
|
100 |
9.1 |
2.5 |
88.4 |
|
Regional average |
100 |
64.0 |
14.0 |
22.0 |
Source: Central BanksThe most significant factor is that a country such as Nicaragua, whose people derive 66 percent of their calorie intake from maize and beans, should allocate just 11.6 percent to both grains, whereas rice receives 88.4 percent of all possible funding. In the remaining countries, people's diets are based on a high degree of maize consumption, in the form of tortillas, thus maintaining a direct relationship with the funding accorded to that crop. Belize allocates all funding to rice-production areas, with all the other grains being seen as subsistence crops.
The distinctive feature of basic-grains production is that it is the productive mainstay and the source of income for one-third of the region's population, which is comprised of small farmers and indigenous owners of less than 3 hectares for their annual crops. These people have no way of purchasing the technological equipment, the more resilient and higher-yielding genetic materials, the technical assistance, or the marketing, etc, that might enable them to improve their profits and thus participate in the globalization process.
Chart 11. Basic grains funding by country
In addition to the above, the tendency in all the affected countries is to pour financial resources into external markets, leading to a notably drastic reduction, within all the affected countries, in technical-assistance programmes, which are designed to assist with certain technology-transfer operations that might facilitate other technological methods for improving both production and the living standards of the farming community and of the rural sector in general.
A major example of an alternative technological measure is presently being implemented in Honduras, in the form of FAO's Southern Lempira project. This project involves specific actions designed to introduce new crops, preserve soils and introduce organic fertilisation methods. This project deserves serious consideration as a potential model - which might be replicated elsewhere in the region - of how joint effort (without the influence of traditional food aid operations and, above all, without taking on debt) can achieve profitable harvests, which can improve the standard of living of growers, in harmony with their environment.
It is important to note that most of the funding referred to in the aforementioned indicators is that which has been provided by the traditional funding sector. It does not include unconventional rural funding or funding provided by non-governmental organizations in the form of technical assistance, input-supply and training. The total amounts allocated to those activities might well exceed the figures for the formal banking system. It was not possible, however, to obtain a global figure to confirm this, as a great deal of energy and institutional skill apparently goes into hiding the significant expenditure on the bureaucracy of such institutions.
After Mitch, formal funding sources for the production of basic grains declined. It is notable in all countries that funding sources for these crops are very limited and scarce. The little funding that is made available comes from cooperative sources and non-governmental organizations, as described below. This means that the hurricane accentuated the crisis in this productive sector, especially among cereals, which naturally produces a deterioration in living standards within rural households. This does not mean, however, that there were no resources and funding sources with which to restore productive sectors. Other agricultural sectors, such as sugarcane, bananas, coffee and traditional export crops, grown by big producers, absorbed nearly all the available credit. The reason for this bias was the availability of bank guarantees. Small producers cannot compete in this sort of situation.
Indeed, this was the common denominator in all countries, and some of these small producers, who did not have the opportunity to access funding sources, sold their labour in these agricultural sectors in order to survive. If they were fortunate, they received food aid from the humanitarian organizations. Many of them, however, were not lucky enough to find a temporary job.
In general, in all countries of the region, including those least affected, suffered temporary rises in the prices of basic grains, and in most towns in rural areas, prices had not been tracked before the disaster struck. In fact, in countries such as Honduras and Nicaragua, upward price movements were observed during the first 10 days after Hurricane Mitch, but prices began returning to normal levels thereafter, once communications channels had been reopened.
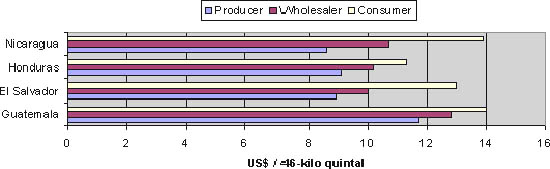
Table 17 shows price trends over the last six years, demonstrating that in the post-Mitch period, increases have been recorded especially in beans and rice. This was because dry beans and rice harvests happened to be still in the field at the time of the hurricane. This was not the case with maize, which demonstrates a declining trend in average prices paid per 46-quintal kilo. The country that pays the highest prices at the different stages of the Producer ® Wholesaler ® Consumer chain is Guatemala, where prices have tended to move in a cyclical fashion, but at a much higher level than in the rest of the region. The margins between these economic actors in the case of maize translate into a relative value of 20 percent for the consumer, while in beans, that percentage is 30 percent higher, and in rice, the cost of intermediation accounts for 54 percent.
In the case of El Salvador, the margins between the price paid to the grower and the price paid by the consumer are 46 percent for maize; 39 percent for beans and 3.5 times for rice. For Honduras the same margins are: for maize, 24 percent; for beans, 40 percent; and for rice, 3.2 times the average price paid to the grower. Nicaragua has the biggest margins between prices for all grains, at 61 percent in the case of maize, 43 percent for beans and 62 percent for rice. It should be noted, however, that compared with the other countries in the region, these prices are the lowest.
Table 17. Trends in average prices paid for basic grains (in dollars/quintal16)
|
Country |
Year |
Maize |
Beans |
Rice |
||||||
|
Producer |
Wholesaler |
Consumer |
Producer |
Wholesaler |
Consumer |
Producer |
Wholesaler |
Consumer |
||
|
Belize |
|
N/a |
N/a |
N/a |
N/a |
N/a |
N/a |
N/a |
N/a |
N/a |
|
Guatemala |
1994 |
8.8 |
10.9 |
11.0 |
25.7 |
32.1 |
38.1 |
26.7 |
26.2 |
38.8 |
|
1995 |
8.1 |
8.5 |
9.6 |
25.1 |
26.5 |
32.7 |
21.9 |
25.3 |
33.5 |
|
|
1996 |
12.9 |
13.6 |
15.3 |
40.3 |
41.6 |
50.5 |
21.0 |
24.2 |
32.3 |
|
|
1997 |
11.8 |
13.3 |
13.9 |
23.0 |
23.7 |
29.0 |
23.4 |
27.0 |
39.1 |
|
|
1998 |
16.4 |
17.2 |
19.3 |
33.9 |
39.0 |
42.6 |
24.8 |
28.6 |
38.2 |
|
|
1999 |
12.4 |
13.0 |
14.7 |
28.6 |
29.5 |
35.6 |
24.3 |
28.1 |
36.9 |
|
|
Average |
11.7 |
12.8 |
14.0 |
29.4 |
32.1 |
38.1 |
23.7 |
26.6 |
36.5 |
|
|
El Salvador |
1994 |
N/a |
N/a |
N/a |
N/a |
N/a |
N/a |
N/a |
N/a |
N/a |
|
1995 |
N/a |
N/a |
N/a |
N/a |
N/a |
N/a |
N/a |
N/a |
N/a |
|
|
1996 |
N/a |
N/a |
N/a |
N/a |
N/a |
N/a |
N/a |
N/a |
N/a |
|
|
1997 |
N/a |
N/a |
N/a |
N/a |
N/a |
N/a |
N/a |
N/a |
N/a |
|
|
1998 |
9.9 |
11.2 |
14.0 |
35.8 |
42.9 |
52.0 |
9.4 |
13.2 |
34.0 |
|
|
1999 |
7.9 |
8.8 |
12.0 |
40.0 |
45.0 |
53.0 |
8.5 |
N/a |
34.0 |
|
|
Average |
8.9 |
10.0 |
13.0 |
37.9 |
43.9 |
52.5 |
8.9 |
13.2 |
34.0 |
|
|
Honduras |
1994 |
9.6 |
10.8 |
11.8 |
27.1 |
29.1 |
32.1 |
13.2 |
23.4 |
25.9 |
|
1995 |
7.9 |
8.9 |
10.1 |
19.0 |
21.1 |
23.2 |
13.6 |
24.6 |
26.7 |
|
|
1996 |
8.1 |
12.1 |
13.2 |
24.6 |
50.6 |
55.3 |
13.2 |
27.8 |
30.4 |
|
|
1997 |
11.3 |
12.0 |
12.9 |
42.5 |
44.1 |
49.3 |
15.2 |
28.3 |
30.8 |
|
|
1998 |
8.9 |
9.3 |
10.2 |
28.4 |
34.8 |
40.5 |
N/a |
30.0 |
32.1 |
|
|
1999 |
8.7 |
8.2 |
9.4 |
31.4 |
37.5 |
42.6 |
N/a |
27.1 |
30.1 |
|
|
Average |
9.1 |
10.2 |
11.3 |
28.8 |
36.2 |
40.5 |
13.8 |
26.9 |
29.3 |
|
|
Nicaragua |
1994 |
9.3 |
11.7 |
16.5 |
25.1 |
30.1 |
35.4 |
10.1 |
22.6 |
23.8 |
|
1995 |
7.4 |
8.9 |
8.0 |
18.6 |
23.5 |
28.5 |
9.8 |
22.7 |
26.1 |
|
|
1996 |
10.7 |
13.3 |
17.4 |
41.0 |
46.7 |
55.6 |
11.0 |
23.9 |
28.5 |
|
|
1997 |
9.2 |
10.9 |
15.7 |
39.1 |
45.6 |
57.8 |
10.8 |
23.4 |
28.8 |
|
|
1998 |
8.1 |
10.5 |
13.9 |
36.7 |
44.5 |
52.5 |
10.2 |
22.1 |
28.2 |
|
|
1999 |
6.9 |
8.8 |
11.9 |
31.6 |
40.5 |
45.6 |
9.3 |
21.2 |
24.8 |
|
|
Average |
8.6 |
10.7 |
13.9 |
32.0 |
38.5 |
45.9 |
10.2 |
22.7 |
26.7 |
|
N/a= Not available; Source: Ministries of Agriculture; CORECA SecretariatCompared with the international prices governed by the Gulf of Mexico, prices in Central America, which refer to the price paid to the producer, set the value of maize at US$190/tonne, beans, at US$635/tonne; and rice, at US$196/tonne. The values at the Gulf price are US$95/tonne, US$ 490/tonne and US$187/tonne, respectively, for the same products.
Chart 12. Central America: average prices paid for basic grains 1995-1999
In conclusion, domestic prices in each country have followed the dictates of supply and demand, and it would seem that Hurricane Mitch did not influence their behaviour to a decisive degree. The various factors mentioned above have had a major impact, however. Imports have played a fundamental role which, even if it has not harmed consumers directly, certainly has had the effect of reducing the incomes of farm workers.
![]()
![]()
![]()