![]()
![]()
![]()
Production Development Corporation of Chile (CORFO)
Development Division
INTRODUCTION
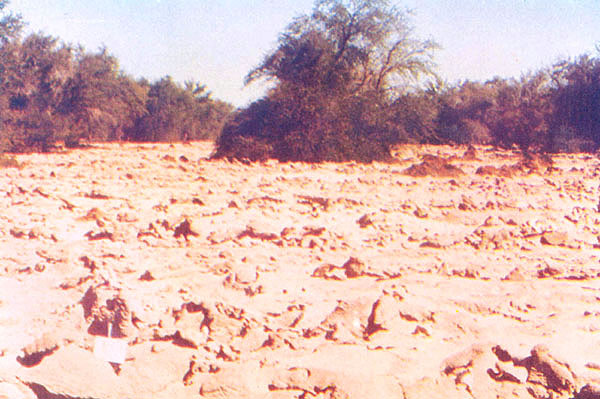
Sheep and goat herds at the Tamarugal Pampa feed basically on fruit, leaves and browse from local tamarugo (Prosopis tamarugo) and algarrobo (Prosopis alba).
From the outset of the research program in the area by the Corporación de Fomento de la Producción (11/1/03), a series of studies aimed at establishing as accurately as possible the nutritive value of fodder from this species was undertaken. However, the data collected do not warrant a definite assessment of the potential that this species might have for sheep and goat rearing in the area.
Chemical analyses of Refresco Farm tamarugo and algarrobo fruit and leaves were carried out to ascertain the nutritive value of the fodder. In vivo digestibility was established by chromic oxide technique at the Universidad Austral. SACOR (Agricultural Society of CORFO, Ltd.) staff carried out this same analysis in a direct fashion. With the data obtained, the nutritional contribution of the forest was estimated, and complemented by a study of feed selection by goats.
It was deemed relevant to add the influence exerted by tamarugo and algarrobo fodder on the metabolic profiles of sheep and goats during their various physiological periods: breeding, pregnancy and lactation.
The research on which this report is based was carried out mainly by Universidad Austral de Chile professionals and SACOR personnel, under a request by CORFO, within the framework of its “Desert Regions Research Program”. The aim is to improve minor ruminant herd raising at such a peculiar area as the Tamarugal Pampa, I Region of Chile.
1. NUTRITIONAL ASSESSMENT OF TAMARUGO AND ALGARROBO
Considering that feeding is one of the most decisive factors in productivity of domestic animals, as regards their wool, meat or milk output, or for the quality of their reproductive aspects, such as normal offspring, number of offspring, delivering ease, etc., it is mandatory to establish as accurately as possible what happens to the animal with the feed it ingests. In this regard, it is relevant to establish feed acceptance by the animal, chemical composition, degree of utilization or absorption at digestive system level and the way the various nutritive components are utilized by the organism at the different stages of an animal's life.
The acceptance of a particular type of feed indicates the amount of it which should be included in the rations. The chemical composition reflects the relative share of each of the nutritive substances making up the feed. The degree of utilization by the digestive system constitutes the digestibility, with which the value of the feed can be ascertained more accurately, for, while the chemical composition indicates whether the feed is rich in protein, energy or minerals, digestibility shows the proportion of these substances going for increased animal production. The way the nutritive substances are absorbed or metabolized by the organism, together with the metabolic balance or imbalance, can be ascertained by metabolic profiles.
With all these data, better administration of the feed can be accomplished, using adequate amounts for the various productive processes in the animal's life.
Among the areas in Chile with livestock raising potential on which very little information is available on feed utilization and assessment, is the Tamarugal Pampa and the High Andean Plateau at Region I in Northern Chile. It is therefore important to know the nutritional significance of the food consumed by the herds, such as those produced by tamarugo and algarrobo.
With these considerations in mind, and with the possibilities inherent to livestock raising at the Tamarugal Pampa, this research study was designed to establish the nutritive value of tamarugo (Prosopis tamarugo) and algarrobo (Prosopis alba) fruit and leaves, the two most important sources of feed for livestock raised at this area. The nutritive values, as indicated by nutrient chemical composition and digestibility, were complemented by the determination of blood metabolites as indicators of metabolic processes at breeding, gestation and beginning and end of lactation of sheep and goat herds. The nutritional assessment of this fodder will make it possible to provide recommendations about the need of complementing livestock rations during their various physiological periods.
The nutritional assessment in sheep and goat herds included aspects related to the chemical composition and digestibility of fruit and leaf fodder from tamarugo and algarrobo, and with the metabolic conditions of sheep and goats, as established by the amount of some blood metabolites.
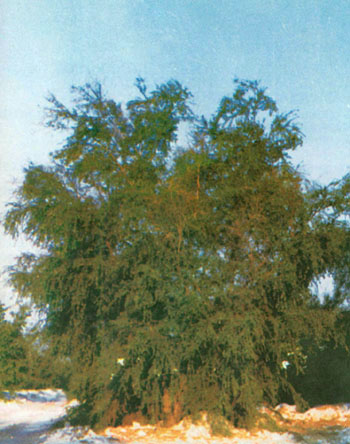 | Tamarugo and algarrobo trees at the Refresco Farm, Tamarugal Pampa. |
 | |
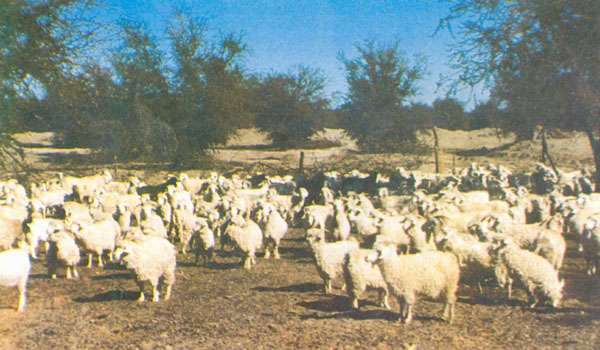
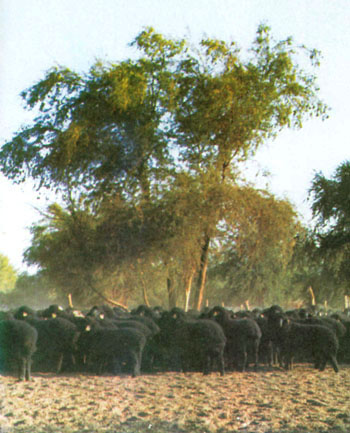 | Sheep flock with adult tamarugo in the background. |
The Refresco Farm staff lent permanent support to this study.
1.1 Chemical Composition
Chemical analyses of the feed samples were performed at the Animal Nutrition Laboratory of the Universidad Austral. The samples corresponding to tamarugo and algarrobo fruit and leaves were collected by SACOR personnel, from a year's output of tamarugo and algarrobo. Average samples were prepared, representative of the fodder quality produced at the Refresco Farm.
A complete chemical analysis was performed to obtain a thorough assessment of the nutritive quality of tamarugo and algarrobo, including both organic and inorganic nutrients. The results went into fine detail, making it possible to accurately ascertain the limitations of these products for sheep and goat raising.
Table 1 includes the chemical composition expressed on the basis of dry matter content of the feed in its natural state, with the exception of gross energy, which is expressed on a dry basis.
From the chemical analysis, it can be established that the fodders studied may be classified as “roughage”, whose high fiber content, particularly in fruit, suggests that they be adequately complemented with other fodder to constitute a balanced diet for sheep and goat herds during the more demanding periods (end of pregnancy and beginning of lactation).
The sharp mineral imbalance —with a deficit in certain cases, as phosphorus, calcium and sodium—, and excess in others, is remarkable.
The comparison between tamarugo and algarrobo shows the latter's fruit and leaves to be nutritionally superior, especially as regards energy contribution.
TABLE 1
Chemical Composition of Tamarugo and Algarrobo Fodder
| Components | Tamarugo | Algarrobo | ||
|---|---|---|---|---|
| Fruit | Leaves | Fruit | Leaves | |
| Dry Matter, % | 91.6 | 90.3 | 94.6 | 90.7 |
| Organic Matter, % | 87.8 | 80.5 | 91.2 | 80.8 |
| Total Protein, % | 10.5 | 10.9 | 7.6 | 13.5 |
| Crude Fibre, % | 29.7 | 15.2 | 26.0 | 19.9 |
| Ether Extract, % | 0.46 | 1.46 | 1.10 | 1.40 |
| Ash, % | 3.80 | 9.8 | 3.40 | 9.90 |
| Nitrogen free extract, % | 47.1 | 52.9 | 56.5 | 46.0 |
| Gross Energy, Kcal/kg.DM | 4,410 | 4,390 | 4,310 | 4,460 |
| Cell Wall, % | 54.4 | 31.2 | 32.7 | 34.1 |
| Acid Detergent Fibre, % | 46.8 | 24.8 | 27.1 | 28.3 |
| Hemicellulose, % | 7.6 | 6.4 | 5.6 | 5.8 |
| Cellulose, % | 27.9 | 14.0 | 20.0 | 13.4 |
| Phosphorus, % | 0.05 | 0.03 | 0.02 | 0.05 |
| Calcium, % | 0.18 | 1.39 | 0.17 | 1.27 |
| Magnesium, % | 2.1 | 5.8 | 1.2 | 4.8 |
| Sodium, % | 0.08 | 0.27 | 0.05 | 0.18 |
| Potassium, % | 1.98 | 2.31 | 1.15 | 2.02 |
| Copper, p.p.m. | 30 | 70 | 30 | 45 |
| Iron, p.p.m. | 150 | 600 | 150 | 600 |
| Cobalt, p.p.m. | 50 | 50 | Not detected | 50 |
| Manganese, p.p.m. | 50 | 300 | 45 | 200 |
Table 2 compares tamarugo and algarrobo fruit and leaf nutritional contributions with those of other commonly used sheep fodder.
TABLE 2
Nutritional Value of Various Feeds
| DM % | TP % | CF % | DE Mc/kg | Ca % | P % | |
|---|---|---|---|---|---|---|
| Tamarugo fruit | 91.6 | 10.5 | 29.7 | 1.64 | 0.18 | 0.05 |
| Tamarugo leaves | 90.3 | 10.9 | 15.2 | 1.86 | 1.39 | 0.03 |
| Algarrobo fruit | 94.6 | 7.6 | 26.0 | 3.07 | 9.17 | 0.02 |
| Algarrobo leaves | 90.7 | 13.5 | 19.9 | 2.70 | 1.27 | 0.05 |
| Wheat bran | 86.7 | 12.8 | 9.8 | 2.83 | 0.20 | 0.81 |
| Barley grain | 89.3 | 10.4 | 10.5 | 3.18 | 0.11 | 0.31 |
| Oat grain | 89.5 | 8.9 | 5.4 | 3.45 | 0.07 | 0.27 |
| Corn grain | 89.5 | 8.4 | 1.9 | 3.73 | 0.05 | 0.34 |
| Alfalfa hay | 89.8 | 13.8 | 24.6 | 2.16 | 1.52 | 0.21 |
| Alfalfa pellet | 89.5 | 16.3 | 19.1 | 2.29 | 1.82 | 0.29 |
| Pink clover hay | 90.2 | 10.6 | 25.1 | 2.20 | 1.88 | 0.12 |
| Oat stubble | 90.9 | 2.6 | 42.2 | 1.59 | 0.24 | 0.09 |
DM = Dry Matter;
TP = Total Protein;
CF = Crude Fiber;
DE Mc/kg = Digestible Energy, megacalories per kg;
Ca = Calcium;
P = Phosphorus
Table 2 shows a comparison between the nutritive value of tamarugo and algarrobo fruit and leaves with respect to other bulk or concentrated fodder. As regards energy contribution, tamarugo ranks similar to cereal stubble, which entails as well low total consumption. Algarrobo fruit and leaves are higher in energy content, comparable to a mid quality hay.
Protein contribution is intermediate, in general, very similar to clover hay, oat grain and wheat bran.
As regards the calcium/phosphorus ratio, the more relevant aspect is that the content of these two elements does not meet the needs of either sheep or goats. This situation must be corrected by an adequate mineral supplement, reinforced in phosphorus. The remaining feeds in Table 2 also show defficiencies, but none as markedly as in the case of tamarugo and algarrobo fruit.
1.2 Digestibility and Consumption
Digestibility coefficients for different organic nutrients, and the energy contained in the analyzed fodder were established for sheep and goats. The animals were kept in individual pens during the trial period. The tracer technique was employed, already tested in research conducted by the Universidad Austral. Chromic oxide, used as tracer, was administered in especially prepared wafers, divided into two equal portions given at feeding time to the animals. All analyses necessary for the computation of digestibility coefficients were performed at the laboratories of the Universidad Austral, in Valdivia. Findings on digestibility, digestible nutrients and feed consumption by sheep and goats are presented in Tables 3, 4 and 5.
TABLE 3
Nutrient Digestibility Coefficients
for Tamarugo and Algarrobo in Sheep and Goats
(%)
| DM | OM | TP | EE | CF | CW | NNE | E | |
|---|---|---|---|---|---|---|---|---|
| TAMARUGO | ||||||||
| Fruit sheep | 42.4 | 41.8 | 36.3 | 56.9 | 30.3 | 27.2 | 49.3 | 37.3 |
| Fruit goats | 68.0 | 70.3 | 58.3 | 53.3 | 70.8 | 64.6 | 75.7 | 68.1 |
| Leaves sheep | 41.4 | 39.5 | 40.1 | 41.7 | 32.5 | 31.7 | 62.6 | 42.4 |
| Leaves goats | 49.9 | 53.7 | 40.8 | 45.1 | 36.9 | 29.2 | 64.0 | 50.0 |
| ALGARROBO | ||||||||
| Fruit sheep | 72.1 | 73.1 | 60.3 | 50.8 | 54.4 | 51.2 | 83.1 | 71.2 |
| Fruit goats | 62.6 | 63.1 | 39.9 | 34.3 | 36.9 | 31.8 | 80.2 | 58.5 |
| Leaves sheep | 62.0 | 63.6 | 48.5 | 47.0 | 46.6 | 39.4 | 75.3 | 60.6 |
| Leaves goats | 56.0 | 58.1 | 24.6 | 33.6 | 47.6 | 41.6 | 71.4 | 54.5 |
DM = Dry Matter
EE = Ether Extract
NNE = Nitrogen Free Extract
OM = Organic Matter
CF = Crude Fibre
E = Energy
TP = Total Protein
CW = Cell Wall
A different degree of utilization of tamarugo fruit between sheep and goats has been detected. Goats digest better the rougher fodders, while the better quality ones are more digestible for sheep.
The degree of fodder utilization by sheep increases remarkably with improved feed quality, as in the case of algarrobo compared to tamarugo.
TABLE 4
Main Digestible Nutrients and Metabolizable Energy
from Tamarugo and Algarrobo
| DOM% | DP% | DE Mc/kg | ME Mc/kg | |
|---|---|---|---|---|
| TAMARUGO | ||||
| Fruit sheep | 36.7 | 3.8 | 1.64 | 1.33 |
| Fruit goats | 61.3 | 6.3 | 3.00 | 2.42 |
| Leaves sheep | 31.8 | 4.4 | 1.86 | 1.51 |
| Leaves goats | 43.2 | 4.4 | 2.19 | 1.78 |
| ALGARROBO | ||||
| Fruit sheep | 66.7 | 4.6 | 3.07 | 2.48 |
| Fruit goats | 57.5 | 3.0 | 2.52 | 2.04 |
| Leaves sheep | 51.4 | 6.5 | 2.70 | 2.18 |
| Leaves goats | 46.9 | 3.3 | 2.43 | 1.96 |
DOM = Digestible Organic Matter
DE = Digestible Energy
Mc/kg = Megacalories per Kilogram
DP = Digestible Protein
ME = Metabolizable Energy
The comparison of all four types of fodder among animal species shows tamarugo —either as fruit or leaves— to be a much superior feed for goats, but with severe limitations for sheep.
Algarrobo, in turn, ranks above tamarugo, from a nutritive point of view, for both sheep and goats.
TABLE 5
Feed intake (g/day) of animals
under digestibility tests
(expressed as 100% D.M.)
| Species | Tamarugo | Algarrobo | ||
|---|---|---|---|---|
| Fruit | Leaves | Fruit | Leaves | |
| Sheep | ||||
1 | 1,216 | 592 | 588 | 240 |
2 | 1,461 | 491 | 787 | 259 |
mean | 1,339 | 542 | 688 | 250 |
| Goats | ||||
1 | 2,537 | 592 | 1,384 | 211 |
2 | 2,513 | 1,049 | 872 | 254 |
mean | 2,525 | 821 | 1,128 | 233 |
Leaf consumption is notoriously lower, in spite of its greater nutritive value, in comparison with that of fruit.
Palatability favors fruit clearly, especially that of tamarugo, which offsets partly its severe nutritional deficiencies. Palatability, as a consumption regulation mechanism, seems to rank higher than digestibility and crude fiber levels.
1.3 Discussion on Feed Assessment
The findings of the chemical analysis of tamarugo and algarrobo confirm, in general, the data furnished by various authors.
As regards organic nutrients, the high cell wall content is striking, particularly in the case of tamarugo. The comparison of cell wall content between tamarugo and algarrobo fruit against that for their respective leaves, evidences a marked advantage for tamarugo fruit. However, cellulose content in the fruit of each is significantly higher than for the corresponding leaves.
Total protein content, with the exception of algarrobo fruit, appears to be sufficient for sheep and goats at any physiological stage. However, actual protein availability is reduced by the low digestibility observed for fodder from both species.
Mineral contribution, compared against the actual requirements of sheep and goats, evidences a severe deficit of phosphorus in all feeds considered; a minor deficit in calcium in tamarugo and algarrobo fruit, a considerable imbalance in the calcium/phosphorus ratio, an excess in magnesium, especially in leaves; a sodium deficit in fruit and a dangerous excess of copper.
The above data evidences that none of the fodders studied is adequate as the only feed for sheep and goats, thus making it necessary to consider a balancing supplement. The study of the utilization of the various nutrients shows, in general, low digestibility, and it is interesting to note that the degree of fodder utilization is different between sheep and goats. Tamarugo fruit, the coarser feed, is digested better by goats, while less coarse fodder, as algarrobo fruit, is digested better by sheep. This must be kept in mind when designing diets for these livestock species, especially when considering the effect of digestibility on voluntary feed intake, which, as regards fruit, was clearly higher for goats.
Considering the importance of other ruminants as source of animal protein and other products in this region, as, for instance, the domestic cameloids, it is mandatory to establish the degree of fodder utilization and conversion for these species. To that end, the technique which made it possible to establish digestibility for goats and sheep at Refresco Farm offers a good alternative. The assumption that llamas, alpacas and guarizos digest these fodders very well could be tested.
1.4 Tamarugo Fodder Selectivity by Goats
It is relevant to establish the composition of animal rations, particularly in the case of the Tamarugal Pampa, where feed availability depends solely on tamarugo and algarrobo. Livestock select fruit, litter and dry twigs, and/or browse tender shoots to meet their nourishing demands. The proportion of each component consumed by the animals will indicate, ultimately, whether their needs will be met.
With this purpose, a trial aimed at establishing selectivity of tamarugo fodder by goats was established, and, therefrom, once the corresponding digestibilities had been ascertained, the nutritional contribution offered by the environment to the goat raising system at that location was estimated.
Ten one-year-old male goats were used for the trial, with an average weight of 46 kg. The animals were subjected to an acclimatization period before making the measurements, so as to lend higher reliability to the trial findings.
During the trial, the animals —confined to individual pens— were given a ration containing tamarugo fruit and dry and green leaves, as browse equivalent, clipped 12 hours before being given for consumption.
The findings of this trial are shown in Table 6 below:
TABLE 6
Daily consumption of tamarugo fruit and dry and green leaves by goats
| Ingredient | Green basis | Dry matter basis | ||
|---|---|---|---|---|
| kg | % | kg | % | |
| Green leaves | 1.05 | 44.3 | 0.453 | 27.1 |
| Dry leaves | 0.08 | 3.3 | 0.071 | 4.2 |
| Fruit | 1.24 | 52.4 | 1.15 | 68.7 |
TOTAL | 2.37 | 100.00 | 1.674 | 100.00 |
The greatest consumption corresponds to tamarugo fruit, with values ranging from 52.4% to 68.7% of the intake, considering both green and dry matter basis, respectively. If green leaves are added as an indicator of browsing, the estimate is that over 95% of the diet of goats kept in a tamarugo forest is made up by fruit and browse.
These statements should be confirmed by field studies in the future, as they would make it possible to establish combined or alternate goat-sheep grazing, enabling a better utilization of the resource.
The components used in the trial were subjected to a digestibility test in order to make a better nutritional assessment, the findings of which are presented in Table 7 below:
TABLE 7
Tamarugo fodder crude and digestible protein and energy content
| CP % | Digestibility % | DP % | GE Mc/kg | Digestibility % | DE Mc/kg | |
|---|---|---|---|---|---|---|
| Fruit | 11.6 | 48.0 | 5.6 | 4.64 | 45.1 | 2.09 |
| Green leaves | 18.7 | 38.1 | 7.1 | 4.92 | 44.6 | 2.20 |
| Dry leaves | 10.9 | 15.6 | 1.7 | 4.01 | 39.0 | 1.57 |
CP = Crude protein
GE = Gross energy
Mc/kg = Megacalories per kg
DE = Digestible energy
DP = Digestible protein
The values obtained are somewhat inferior to those reported previously. Nevertheless, their variation may be regarded as normal. It must be pointed out, however, that the computing methods were different in each case, as the chrome oxide method was used in only one of them.
Furthermore, it must be kept in mind that dry leaf digestibility was determined by difference with respect to the other components of the ration, on account of the fact that its low consumption by the animals might lead to wrong results, as it could provoke the utilization of endogenous protein.
In general terms, the values for digestibility of the different components of the tamarugo forest may be rated as medium to low, which lends additional support to the idea of supplementing the rations during the more demanding periods in the animal physiology: last third of pregnancy and lactation.
1.5 Nutritional Contribution of the Forest
Basing on the selectivity evidenced by the goats and by the digestibility of each component, it is possible to make a theoretical approximation to whether the tamarugo forest can meet the feeding needs of goats during their various physiological periods.
To this end, the recommendations made by the University of Texas for the requirements of Angora goats are taken into consideration (Appendix 5), as this is the predominating race in the trial flock.
Table 8 shows the contribution of fodder from the forest in terms of surplus or deficit of the indicated consumption levels as derived from the selectivity trial.
TABLE 8
Nutritional contribution of the forest
| Class and weight (kg) | Dry matter consumption (kg) | D.E. (Kcal) | Deficit or excess (Kcal) | Digestible protein (gr) | Deficit or excess | ||
|---|---|---|---|---|---|---|---|
| Maintenance and dry goats | |||||||
| 22.5 | 1.2 | 2527 | + | 27 | 72.9 | - | 13.9 |
| 27.2 | 1.3 | 2744 | - | 56 | 78.8 | + | 1.8 |
| 36.3 | 1.5 | 3177.1 | - | 123 | 91.1 | + | 14.1 |
| 45.4 | 1.7 | 3600 | - | 100 | 103.4 | + | 17.4 |
| Pregnancy (last 8 weeks) | |||||||
| 22.5 | 1.6 | 3141 | - | 659 | 97.8 | + | 6.8 |
| 27.2 | 1.7 | 3660 | - | 399.7 | 103.4 | + | 8.4 |
| 36.3 | 2.0 | 4226.4 | - | 233.6 | 125.6 | + | 16.6 |
| 45.4 | 2.1 | 4430.0 | - | 470 | 127.3 | + | 9.3 |
| Lactation (16 weeks) | |||||||
| 22.5 | 1.7 | 3600.3 | - | 499.7 | 103.4 | - | 0.6 |
| 27.2 | 1.8 | 3823 | - | 577 | 109.5 | - | 4.5 |
| 36.3 | 1.9 | 4025 | - | 775 | 115.6 | - | 7.4 |
| 45.5 | 2.0 | 4226 | - | 1074 | 125.6 | - | 10.4 |
| Kid growth and production | |||||||
| 9 | 0.8 | 1679.5 | - | 720.5 | 48.2 | - | 24.4 |
| 18 | 1.1 | 2329 | - | 771.0 | 73.0 | - | 8.7 |
| 27.2 | 1.4 | 2964 | - | 736.0 | 85.1 | - | 5.7 |
| 36.3 | 1.5 | 3177 | - | 623.0 | 91.1 | + | 4.8 |
An energy deficit is evident in the nourishment obtained from the forest, which becomes more marked at the end of pregnancy and during lactation, and during the growing stage of the kids. Protein deficits are smaller and less important. This justifies supplementing the animals during the last third of pregnancy and during lactation at the Refresco Farm. This management practice has already been incorporated into the goat production system: a supplement of approximately 300 g of wheat and alfalfa bran concentrate is given to the animals during the last third of pregnancy, contributing with 46.0 g of digestible protein and 918 kcal of digestible energy. The supplement is increased to 400 g daily during lactation.
These amounts are sufficient to make up for the energy deficit in fodder from the forest for goats with live weights of 27 kg and up in the last third of pregnancy. The contribution made by the supplement makes up for all energy deficits during lactation in goats of any weight.
2. METABOLIC PROFILES
2.1 General
The nutritional substances ingested by an animal —absorbed or introduced into the organism— suffer a series of more or less deep transformations through physical, physico-chemical and chemical phenomena resulting from the cellular activity, which ultimately insure the permanence of the structures and the composition of the cells essential for life. The animal organism has regulating mechanisms which enable it to maintain its conditions within normal ranges, thus keeping the concentrations of certain metabolites or nutrients constant, particularly in the blood.
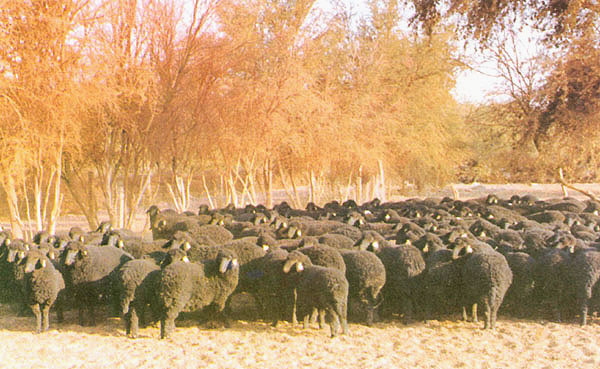
Flock of Karakul crossbreed sheep.
Angora goat herd.
When an animal is altered by sickness or by deficit or excess of nutritional substances, it eliminates those metabolites that are not necessary, keeping the more useful ones. The organism is able to even release elements from its reserves or structures to maintain the vital functions. All these elements are present in the blood, so that the analysis of blood samples in a laboratory and subsequent comparison of the findings with normal blood data —taking into account the amounts ingested— reveal the metabolic condition of the animals. For instance, if the blood analysis reveals an increase in urea levels, two possible anomalies may be present:
If protein consumption is excessive, that will be the reason. If, on the contrary, protein consumption is adequate or below requirements, the increase in blood urea indicates a metabolic alteration in the tissues. In general terms, the difference in metabolite concentration, as shown for instance in the tables detailing the results below, with respect to normal levels, provides a basis for explaining biochemical or nutritional alterations. The alterations in blood glucose levels indicate a disorder in the energy metabolism; the alterations in urea concentrations, hemaglobulin, protein, albumin and globulin reveal poor proteic metabolism, and the alterations in blood mineral content indicate a disorder in the metabolism of these elements.
Considering that the determination of blood elements is a good help in the interpretation of normality or abnormality in the functioning of the animal organism, it was deemed relevant —for the case in point— to complement the nutritional assessment of fodder from tamarugo and algarrobo with the analysis of the blood components or metabolic profiles for different stages of the productive cycle of sheep and goat flocks.
The metabolic profiles were designed and described by Payne et al. in England in 1970, to evaluate the balance between nutrient intake and metabolism. The test consists of measuring the concentrations of some blood biochemical constants in groups of animals in a flock and compare them with values considered normal for a population.
The more common biochemical constants used for the study of the metabolic condition are: hemoglobin, clustered corpuscle volume, glucose, urea, cetonic bodies, total protein, albumin, globulin, calcium, inorganic phosphorus, magnesium, sodium and potassium. Thus, for example, glucose represents the energy metabolism; urea, hemoglobin, total protein, albumin and globulin represent the protein metabolism, and Ca, P, Mg, Na and K represent the major mineral elements.
The concentration of these parameters in the blood is regulated by the balance of the nutrient intake and its output through the milk, fetus, urine, feces, cutaneous losses, etc. In general terms, the lower concentration of these elements in the blood is interpreted as suggesting that the metabolite precursor in the diet is inadequate; likewise, a higher concentration may be interpreted as an exaggerated contribution.
The metabolic profile test was designed as an aid in the approach to the clinical problems of the flocks, as it enables to make a presymptomatic diagnosis of metabolic alterations and an assessment of the nutritional condition of the flock, as indicated by Payne et al. (1970), Rowlands & Pocock (1976), Adams et al. (1978).
Therefore, the metabolic profiles constitute a major aid in finding out the reasons for metabolic alterations in a flock, or when risks want to be established even before any abnormality is observed, so as to prevent future inconveniences.
It must be kept in mind, however, that the findings of the metabolic profile test have no value by themselves. To correctly diagnose the nutritional condition of a flock, the degree of utilization of the feed, the general condition of the animals, their productive behaviour and the management under which they have been raised must be confronted with the data from the analysis of the feed.
2.2 Findings of the Metabolic Condition Analysis of Sheep and Goats at the Tamarugal Pampa
To assess the nutritional condition of sheep and goat flocks, metabolic profile tests were performed at the Clinical Laboratory of the Southern University of Chile. The nutritional condition was studied for different physiological stages, such as breeding, pregnancy, and beginning and end of lactation. Samples were taken from female sheep and goats of different ages and races for each period. The results are shown below.
The findings of the metabolic profiles for sheep and goats during breeding, pregnancy, and beginning and end of lactation are detailed in Appendices 1 and 2.
The metabolic profiles of each flock are presented in Tables 9 and 10, to illustrate the fact that the greatest variations in the blood levels of some of the nutrients were observed between the different physiological stages, and on account of the close relationship between these levels and the nutritional condition of sheep and goats.
TABLE 9
Metabolic profiles for sheep in different physiological periods. Mean
values for breeding, pregnancy, lactation and end of lactation
| Parameters | Physiological period | |||||||
|---|---|---|---|---|---|---|---|---|
| breeding | gestation | lactation | end of lactation | |||||
| Hemoglobin, g/dl | 13.10±1.43 | 12.31±1.13 | 11.21±1.23 | 10.43±2.08 | ||||
| Corpuscle volume, % | 32.00±3.00 | 35.00±4.00 | 31.00±4.00 | 28.00±4.00 | ||||
| Glucose, m mol/l | 2.53±0.49 | 2.24±0.48 | 2.26±0.21 | 2.91±0.41 | ||||
| Urea, m mol/l | 4.39±0.54 | 5.26±0.52 | 5.67±0.40 | 2.59±0.70 | ||||
| Cetonic bodies | Normal | Normal | Normal | Normal | ||||
| Protein, g/l | 76.11±4.25 | 62.10±6.16 | 60.90±3.49 | 74.15±5.13 | ||||
| Albumin, g/l | 30.25±2.83 | 31.10±2.22 | 19.45±1.57 | 26.30±2.50 | ||||
| Globulin, g/l | 44.81±2.88 | 31.50±5.54 | 41.45±3.02 | 47.85±1.82 | ||||
| Calcium, m mol/l | 2.89±0.13 | 2.49±0.13 | 2.77±0.15 | 3.14±0.13 | ||||
| Phosphorus, m mol/l | 1.34±0.16 | 1.57±0.47 | 1.19±0.21 | 1.37±0.24 | ||||
| Magnesium, m mol/l | 0.92±0.08 | 1.00±0.07 | 1.20±0.08 | 1.02±0.07 | ||||
| Sodium, m mol/l | 150.53±3.36 | 144.59±8.84 | 150.15±5.41 | 155.50±6.57 | ||||
| Potassium, m mol/l | 6.84±0.50 | 7.11±0.70 | 6.84±0.56 | 6.49±0.54 | ||||
TABLE 10
Metabolic profiles of goats in different physiological periods. Mean
values for breeding, pregnancy, lactation and end of lactation
| Parameters | Physiological Period | |||||||
|---|---|---|---|---|---|---|---|---|
| Breeding | Pregnancy | Lactation | End of lactation | |||||
| Hemoglobin, g/dl | 12.71±0.79 | 11.70±1.17 | 9.29±1.69 | 11.69±1.21 | ||||
| Corpuscle volume, % | 35.00±3.00 | 34.00±3.00 | 25.00±5.00 | 31.00±2.00 | ||||
| Glucose, m mol/l | 2.95±0.46 | 3.03±0.33 | 2.66±0.21 | 3.78±0.59 | ||||
| Urea, m mol/l | 4.02±0.82 | 4.90±0.96 | 4.95±1.00 | 3.01±1.03 | ||||
| Cetonic bodies | Normal | Normal | Normal | Normal | ||||
| Protein, g/l | 78.25±6.68 | 60.95±3.02 | 60.60±4.25 | 80.95±6.41 | ||||
| Albumin, g/l | 33.40±1.90 | 31.45±2.06 | 22.40±1.54 | 33.81±2.42 | ||||
| Globulin, g/l | 42.94±4.79 | 29.50±3.40 | 38.20±4.30 | 47.14±3.19 | ||||
| Calcium, m mol/l | 2.78±0.17 | 2.48±0.21 | 2.53±0.28 | 3.01±0.23 | ||||
| Phosphorus, m mol/l | 1.21±0.18 | 1.53±0.78 | 2.00±0.65 | 1.31±0.20 | ||||
| Magnesium, m mol/l | 0.97±0.07 | 0.96±0.11 | 1.16±0.09 | 1.06±0.06 | ||||
| Sodium, m mol/l | 151.00±5.48 | 143.00±6.72 | 156.20±8.38 | 155.05±4.27 | ||||
| Potassium, m mol/l | 7.18±0.78 | 7.52±1.22 | 7.17±0.91 | 7.83±1.20 | ||||
The metabolic profiles are, in general, within ranges rated as normal by foreign literature and corroborated by national studies. Nevertheless, it is noteworthy that some of the elements are in the lower end of the range, or even slightly below. Table 11 shows a compilation of metabolic profile values for adult sheep obtained from foreign literature and national tests, made by Del Valle (1982) at the Southern University of Chile, which may serve as comparative values. There are no values for goats, but, basing on the findings of this study, it may be inferred that the values shown for sheep are comparable for both species.
The low values observed for glucose in sheep indicate a defficiency in the rations, particularly during pregnancy and lactation. This must be corrected with adequate and timely supplements.
The glucose deficit is less notorious in goats, as these animals can make better use of coarse feed, and have better consumption capabilities. Despite this fact, a supplementary ration must also be considered for these flocks, particularly during lactation.
The high calcium levels, especially at the end of lactation, can be explained by the marked imbalance in the calcium/phosphorus ratio of the rations, which suggests that a mineral supplement should be considered, with a high level of phosphorus and a relatively lower level of calcium.
The excess of potassium in the blood of both species is attributed to the high content of this element in algarrobo and tamarugo fodder, exceeding the normal requirements of both ruminants. However, this cannot be considered as reaching a toxic level, thanks to the high capacity of the organism for eliminating potassium.
TABLE 11
Metabolic profile values for adult sheep, obtained from foreign literature
and from research conducted by the Southern University of
Chile
| METABOLITE | Foreign literature | SOUTHERN UNIV. RESEARCH | ||||
|---|---|---|---|---|---|---|
| PRE-BIRTH | POST-BIRTH | |||||
| Hb, g/100 ml | 8 | – | 16 | 10.8 | 10.3 | |
| C.C.V. % | 27 | – | 45 | 30.4 | 29.3 | |
| Glucose, mmol/l | 2.8 | – | 3.9 | 3.3 | 4.2 | |
| Urea, mmol/l | 2.5 | – | 8.3 | 3.9 | 3.8 | |
| Cetonic bodies | — | — | — | |||
| Total Prot., g/l | 48.3 | – | 67.3 | — | — | |
| Album., g/l | 14.7 | – | 46.8 | 23.3 | 20.7 | |
| Globulin, g/l | 14.7 | – | 50.7 | — | — | |
| Ca, mmol/l | 2.3 | – | 2.7 | 2.3 | 2.5 | |
| P, mmol/l | 1.16 | – | 2.38 | 1.5 | 1.9 | |
| Mg, mmol/l | 0.95 | – | 1.22 | 0.98 | 0.88 | |
| Na, mmol/l | 142 | – | 152 | 150 | 152.9 | |
| K, mmol/l | 4.5 | – | 5.6 | 5.9 | 5.8 | |
2.3 Comments on Metabolic Profiles
The metabolic profiles of sheep, lambs, goats and kids, sampled at four physiological periods along the year, do not show —in general— deviations with respect to the normal values described for this type of animals. This conclusion derives from the comparison of the mean values, presented in the corresponding tables, with the values rated as normal, except for the glucose reading, which shows a deficit, and those of calcium and potassium, which show excesses in certain periods.
It is noteworthy that, despite the high levels detected for some mineral elements —particularly copper and manganese— in the various feeds available to sheep and goats (tamarugo and algarrobo fruit and leaves), these excesses are not reflected in the blood. This is explained by the remarkable capacity of this small ruminants for regulating mineral metabolism.
The normal levels observed for most of the blood elements tested indicate that the rations given to sheep and goats were adequate for their physiological needs, which was confirmed in the field by the satisfactory condition of the flocks throughout the whole year.
However, if the nutritional contribution of the fodder from tamarugo and algarrobo is compared with the requirements of the species and type of animals studied, some marked protein and energy deficits may be observed in certain seasons of the year, due primarily to their low digestibiity. The normal levels registered for the energy metabolism indicators (glucose, cetonic bodies) and protein metabolism (urea, protein, albumin) may be accounted for solely by the supplements given to the animals during those seasons. In the case of goats, green foliage browsing largely contributes to balance the diet.
Despite the fact that the blood values, in general, are within the normal ranges, some variations may be observed among the physiological periods in both species studied. In this respect, it is worth mentioning that the albumin values are strongly reduced in the lactation period, a fact which should be considered when formulating the supplementary ration for that period. The coincidental increase in urea would be accounted for by the catabolization of the animal's own protein, derived from the higher requirements thereof during the lactation period. It may be concluded that it is convenient to reinforce the contribution made by the diet during that period in order to prevent future disorders.
As to the energy metabolism, the critical period once more coincides with the lactation period, although the comparison with the other periods shows that the decrease in glucose levels in the blood is only slight.
The sharp increase in the phosphorus levels during the lactation period is striking, a process already started during the pregnancy. This increase coincides with an insufficient contribution of phosphorus from the diet, so that the organism offsets this defficiency by mobilizing, primarily, its bone reserves. This, added to the rise in phosphorus demand during lactation, is worsened by the extremely low phosphorus levels detected in both fruit and leaves of tamarugo and algarrobo. Last, the problem is further increased by the inadequate calcium-phosphorus ratio of the diet.
Together with improving the protein and energy levels of the feed supplements, the calcium-phosphorus ratio of the diet should be corrected, reinforcing the availability of the latter element.
3. RECOMMENDATIONS ON ANIMAL FEEDING
The following conclusions may be derived from the field observations, the nutritional analyses made and the reports on sheep and goat feeding filed by CORFO:
3.1 Goat feed consists exclusively of tamarugo fruit and leaves. Although goats can make thorough use of this resource and ingest it in adequate amounts, a 400-g daily alfalfa hay supplement per animal is suggested during the last 45 days of pregnancy and the first 45 days of lactation, in order to improve the condition of the goats and their offspring, and their fertility rates.
Male goats must be supplemented with 0.5 kg of alfalfa hay per day 15 days prior to and during the breeding period, as a general management measure.
3.2 Sheep are given a supplement which may be reformulated for economic and practical management reasons. The current supplement —given the condition of the forest— is considered high, making it necessary to reformulate both the supplement mix and the duration of the supplemented period. It is suggested to include only alfalfa hay, giving it whole at a rate of 0.4 kg per sheep per day, 45 days prior to lambing and 55 days after lambing, discarding the wheat bran. Eventual supplements given to the lambs should only include alfalfa hay.
3.3 Both sheep and goats should be given the following mineral mix:
Hostaphos-Hoechst mineral mix + disodium phosphate (Na2HPO4) in equal proportions (50% and 50%).
The placing of salt troughs in the pens is also recommended.
REFERENCES
ADAMS R.S., W.C. STOUT, KRADEL C.D., GUSS S.B., MORER B.C., YUNG G.A. Use and limitations of profiles assessing health or nutritional status of dairy herds. J. Dairy Sci. 61:1671 – 1679, 1978.
BLAXTER G.L. Metabolismo energético de los rumiantes. Madrid. Acribia. 1964.
DEL VALLE J.G. Promedios y variaciones de valores sanguíneos durante los períodos de gestación y lactancia, en dos planteles ovinos. Thesis. Valdivia. Univ. Austral de Chile. Fac. Ciencias Vet. 1982.
JONES G.M., LARSEN R.E., JAVED A.H., DONEFER E., GAUDREAU J.M. Voluntary intake and nutrient digestibility of forages by goats and sheep. J. Anim. Sci. 34:830 – 838. 1972.
Mc DOWELL, L. R., CONRAD J.H.. Latin American Symposium on Grazing Ruminant Mineral Nutrition Research. University of Florida, Gainesville. 1978.
PAYNE J.M., DEW S.M., MANSTON R., FAULKS M. The use of metabolic profile test in dairy herds. Vet. Rec. 87:150 – 158. 1970.
ROWLANDS O.J., POCOCK R.M. Statistical basis of the Compton metabolic profile test. Vet. Rec. 98:333 – 338. 1976.
APPENDIX 1
SHEEP METABOLIC PROFILES
Metabolic profiles of female sheep (adults and lambs) during the breeding period. Average values of various blood metabolites (March).
| Parameters | Adults | Lambs | ||||||
|---|---|---|---|---|---|---|---|---|
| Crossbreed | Karakul | Crossbreed | Karakul | |||||
| Hemoglobin, g/dl | 12.81±1.35 | 13.15±0.53 | 13.83±2.38 | 12.62±0.94 | ||||
| Corpuscle volume, % | 32.00±3.00 | 32.00±1.00 | 33.00±5.00 | 32.00±3.00 | ||||
| Glucose, m mol/l | 2.63±0.51 | 2.39±0.54 | 2.50±0.41 | 2.59±0.61 | ||||
| Urea, m mol/l | 4.32±0.48 | 4.58±0.42 | 4.46±0.64 | 4.20±0.71 | ||||
| Cetonic bodies | Normal | Normal | Normal | Normal | ||||
| Protein, g/l | 78.00±4.74 | 77.75±2.99 | 76.20±2.39 | 72.80±5.07 | ||||
| Albumin, g/l | 28.20±2.86 | 31.20±2.17 | 31.20±1.64 | 30.40±3.85 | ||||
| Globulin, g/l | 49.80±0.18 | 46.55±3.10 | 45.00±2.55 | 42.40±2.07 | ||||
| Calcium, m mol/l | 2.89±0.18 | 2.87±0.07 | 2.89±0.18 | 2.93±0.09 | ||||
| Phosphorus, m mol/l | 1.43±0.04 | 1.31±0.14 | 1.46±0.17 | 1.17±0.08 | ||||
| Magnesium, m mol/l | 0.89±0.04 | 0.87±0.08 | 0.97±0.10 | 0.94±0.09 | ||||
| Sodium, m mol/l | 154.40±1.14 | 150.00±3.74 | 149.40±1.95 | 147.75±2.06 | ||||
| Potassium, m mol/l | 6.86±0.34 | 7.00±0.73 | 6.64±0.51 | 6.90±0.00 | ||||
Metabolic profiles of female sheep (adults and lambs) during pregnancy. Average value of various blood metabolites (July).
| Parameters | Adults | Lambs | ||||||
|---|---|---|---|---|---|---|---|---|
| Crossbreed | Karakul | Crossbreed | Karakul | |||||
| Hemoglobin, g/dl | 12.40±1.17 | 12.60±1.50 | 12.44±1.20 | 11.80±0.76 | ||||
| Corpuscle volume, % | 36.00±3.00 | 35.00±4.00 | 35.00±4.00 | 35.00±5.00 | ||||
| Glucose, m mol/l | 2.44±0.49 | 1.91±1.25 | 2.27±0.65 | 2.32±0.41 | ||||
| Urea, m mol/l | 5.38±0.56 | 4.84±0.74 | 5.35±0.16 | 5.41±0.59 | ||||
| Cetonic bodies | Normal | Normal | Normal | Normal | ||||
| Protein, g/l | 60.60±5.77 | 63.00±5.15 | 62.40±8.44 | 62.40±6.69 | ||||
| Albumin, g/l | 31.80±1.64 | 31.40±3.36 | 31.20±2.17 | 30.00±1.58 | ||||
| Globulin, g/l | 28.80±6.22 | 33.60±2.70 | 31.20±7.05 | 32.40±5.86 | ||||
| Calcium, m mol/l | 2.48±0.14 | 2.45±0.10 | 2.54±0.17 | 2.51±0.13 | ||||
| Phosphorus, m mol/l | 1.93±0.67 | 1.27±0.13 | 1.60±0.44 | 1.48±0.28 | ||||
| Magnesium, m mol/l | 1.02±0.05 | 1.00±0.06 | 1.03±0.09 | 0.96±0.07 | ||||
| Sodium, m mol/l | 152.75±8.06 | 140.40±9.32 | 143.67±1.53 | 142.80±9.09 | ||||
| Potassium, m mol/l | 7.28±0.74 | 5.90±0.60 | 7.10±0.68 | 7.30±0.53 | ||||
Metabolic profiles of female sheep (adults and lambs) during the lactation period. Average values for various blood metabolites (early November).
| Parameters | Adults | Lambs | ||||||
|---|---|---|---|---|---|---|---|---|
| Crossbreed | Karakul | Crossbreed | Karakul | |||||
| Hemoglobin, g/dl | 11.74±1.04 | 11.17±1.74 | 11.03±1.27 | 10.91±0.98 | ||||
| Corpuscle volume, % | 32.00±3.00 | 31.00±5.00 | 30.00±4.00 | 30.00±4.00 | ||||
| Glucose, m mol/l | 2.26±0.19 | 2.45±0.23 | 2.20±0.19 | 2.12±0.15 | ||||
| Urea, m mol/l | 5.89±0.20 | 5.65±0.19 | 5.04±0.36 | 5.82±0.44 | ||||
| Cetonic bodies | Normal | Normal | Normal | Normal | ||||
| Protein, g/l | 63.60±3.51 | 59.80±3.56 | 61.00±4.00 | 59.20±1.64 | ||||
| Albumin, g/l | 21.00±1.58 | 19.20±0.84 | 19.00±2.00 | 18.60±0.55 | ||||
| Globulin, g/l | 42.60±3.65 | 40.60±3.78 | 42.00±3.16 | 40.60±1.34 | ||||
| Calcium, m mol/l | 2.86±0.12 | 2.65±0.13 | 2.88±0.11 | 2.70±0.09 | ||||
| Phosphorus, m mol/l | 1.08±0.18 | 1.34±0.28 | 1.11±0.14 | 1.22±0.18 | ||||
| Magnesium, m mol/l | 1.19±0.07 | 1.18±0.05 | 1.21±0.12 | 1.20±0.06 | ||||
| Sodium, m mol/l | 150.40±5.37 | 147.80±8.84 | 151.20±3.35 | 151.20±3.35 | ||||
| Potassium, m mol/l | 6.93±0.45 | 6.69±0.62 | 6.77±0.62 | 7.18±0.82 | ||||
Metabolic profiles of female sheep (adults and lambs) at end of lactation. Average values of various blood metabolites (January).
| Parameters | Adults | Lambs | ||||||
|---|---|---|---|---|---|---|---|---|
| Crossbreed | Karakul | Crossbreed | Karakul | |||||
| Hemoglobin, g/dl | 10.03±9.92 | 9.12±2.60 | 12.01±0.49 | 10.56±2.68 | ||||
| Corpuscle volume, % | 26.00±2.00 | 27.00±4.00 | 31.00±1.00 | 27.00±7.00 | ||||
| Glucose, m mol/l | 2.67±0.30 | 2.84±0.23 | 3.17±0.50 | 1.99±0.17 | ||||
| Urea, m mol/l | 2.81±0.62 | 2.86±0.96 | 2.56±0.62 | 1.99±0.17 | ||||
| Cetonic bodies | Normal | Normal | Normal | Normal | ||||
| Protein, g/l | 75.60±7.40 | 75.40±5.73 | 74.00±1.58 | 71.70±4.72 | ||||
| Albumin, g/l | 24.92±1.92 | 24.60±0.89 | 28.56±1.67 | 23.00±1.10 | ||||
| Globulin, g/l | 50.68± — | 50.80± — | 45.44± — | 48.70±2.83 | ||||
| Calcium, m mol/l | 3.13±0.17 | 3.11±0.16 | 3.15±0.12 | 3.16±0.10 | ||||
| Phosphorus, m mol/l | 1.60±0.35 | 1.34±0.21 | 1.23±0.09 | 1.35±0.18 | ||||
| Magnesium, m mol/l | 1.01±0.03 | 1.04±0.10 | 1.01±0.10 | 1.02±0.03 | ||||
| Sodium, m mol/l | 161.60±4.51 | 152.60±3.58 | 153.20±8.35 | 154.60±6.11 | ||||
| Potassium, m mol/l | 6.72±0.55 | 6.28±0.68 | 6.30±0.39 | 6.60±0.56 | ||||
APPENDIX 2
GOAT METABOLIC PROFILES
Metabolic profiles of female goats (adults and kids) during the breeding period. Average values for various blood metabolites (March).
| Parameters | Adults | Kids | ||||||
|---|---|---|---|---|---|---|---|---|
| Native | Crossbreed | Native | Crossbreed | |||||
| Hemoglobin, g/dl | 12.30±1.00 | 12.39±0.75 | 13.34±0.47 | 12.73±0.68 | ||||
| Corpuscle volume, % | 35.00±3.00 | 35.00±3.00 | 38.00±1.00 | 35.00±3.00 | ||||
| Glucose, m mol/l | 2.79±0.23 | 3.03±0.13 | 2.87±0.20 | 3.13±0.89 | ||||
| Urea, m mol/l | 3.44±0.64 | 4.41±0.37 | 3.49±0.94 | 4.74±0.43 | ||||
| Cetonic bodies | Normal | Normal | Normal | Normal | ||||
| Protein, g/l | 80.80±4.76 | 82.00±6.78 | 77.40±7.80 | 72.80±4.32 | ||||
| Albumin, g/l | 33.20±3.27 | 34.40±0.89 | 33.00±1.73 | 33.00±1.00 | ||||
| Globulin, g/l | 47.60±1.26 | 47.60±3.59 | 44.40±7.18 | 39.80±3.90 | ||||
| Calcium, m mol/l | 2.82±0.20 | 2.62±0.06 | 2.86±0.19 | 2.84±0.10 | ||||
| Phosphorus, m mol/l | 1.18±0.21 | 1.34±0.11 | 1.14±0.25 | 1.16±0.11 | ||||
| Magnesium, m mol/l | 0.99±0.03 | 0.96±0.12 | 0.89±0.07 | 0.96±0.06 | ||||
| Sodium, m mol/l | 153.20±5.67 | 149.00±1.87 | 147.80±7.79 | 154.00±3.32 | ||||
| Potassium, m mol/l | 7.44±1.08 | 7.52±0.86 | 6.82±0.19 | 6.96±0.69 | ||||
Metabolic profiles of female goats (adults and kids) during pregnancy. Average values for different blood metabolites (July).
| Parameters | Adults | Kids | ||||||
|---|---|---|---|---|---|---|---|---|
| Native | Crossbreed | Native | Crossbreed | |||||
| Hemoglobin, g/dl | 10.80±0.88 | 11.64±1.44 | 12.40±1.19 | 11.96±0.71 | ||||
| Corpuscle volume, % | 33.40±4.00 | 32.00±3.00 | 36.00±4.00 | 35.00±2.00 | ||||
| Glucose, m mol/l | 3.22±0.18 | 2.83±0.26 | 3.14±0.53 | 2.92±0.11 | ||||
| Urea, m mol/l | 5.07±1.09 | 5.28±1.21 | 4.82±0.61 | 4.43±0.91 | ||||
| Cetonic bodies | Normal | Normal | Normal | Normal | ||||
| Protein, g/l | 62.40±2.07 | 66.60±1.52 | 60.80±4.82 | 60.00±3.08 | ||||
| Albumin, g/l | 30.40±2.30 | 31.00±2.92 | 31.80±1.48 | 32.60±0.89 | ||||
| Globulin, g/l | 32.00±1.87 | 29.60±2.41 | 29.00±5.15 | 27.40±2.30 | ||||
| Calcium, m mol/l | 2.46±0.29 | 2.41±0.11 | 2.43±0.20 | 2.60±0.18 | ||||
| Phosphorus, m mol/l | 2.15±0.89 | 1.29±0.48 | 1.74±0.87 | 0.92±0.21 | ||||
| Magnesium, m mol/l | 1.01±0.06 | 0.96±0.18 | 0.97±0.09 | 0.90±0.06 | ||||
| Sodium, m mol/l | 146.60±3.36 | 138.00±5.83 | 148.60±3.55 | 138.80±6.87 | ||||
| Potassium, m mol/l | 6.70±0.41 | 8.70±1.33 | 7.74±1.18 | 6.77±0.46 | ||||
Metabolic profiles of female goats (adults and kids) during the lactation period. Average values for various blood metabolites (early November).
| Parameters | Adults | Kids | ||||||
|---|---|---|---|---|---|---|---|---|
| Native | Crossbreed | Native | Crossbreed | |||||
| Hemoglobin, g/dl | 8.47±1.27 | 9.69±0.95 | 10.37±1.35 | 8.63±2.49 | ||||
| Corpuscle volume, % | 23.00±4.00 | 26.00±3.00 | 29.00±5.00 | 24.00±7.00 | ||||
| Glucose, m mol/l | 2.58±0.09 | 2.48±0.11 | 2.95±0.20 | 2.71±0.10 | ||||
| Urea, m mol/l | 5.00±1.02 | 5.27±1.02 | 4.60±1.33 | 4.86±0.71 | ||||
| Cetonic bodies | Normal | Normal | Normal | Normal | ||||
| Protein, g/l | 64.20±2.68 | 60.00±2.24 | 61.20±5.63 | 57.00±2.95 | ||||
| Albumin, g/l | 22.80±2.05 | 23.00±1.58 | 22.80±0.84 | 21.00±0.71 | ||||
| Globulin, g/l | 41.40±3.58 | 37.00±3.54 | 38.40±5.59 | 36.00±3.24 | ||||
| Calcium, m mol/l | 2.30±0.14 | 2.48±0.10 | 2.56±0.22 | 2.79±0.37 | ||||
| Phosphorus, m mol/l | 2.62±0.27 | 2.34±0.29 | 1.51±0.38 | 1.72±0.89 | ||||
| Magnesium, m mol/l | 1.16±0.06 | 1.19±0.10 | 1.12±0.11 | 1.16±0.11 | ||||
| Sodium, m mol/l | 162.00±6.75 | 162.00±9.27 | 148.00±2.83 | 152.80±3.35 | ||||
| Potassium, m mol/l | 6.88±0.65 | 7.58±1.54 | 7.00±0.80 | 7.34±0.68 | ||||
Metabolic profiles of female goats (adults and kids) during the lactation period. Average values for various blood metabolites (January).
| Parameters | Adults | Kids | ||||||
|---|---|---|---|---|---|---|---|---|
| Native | Crossbreed | Native | Crossbreed | |||||
| Hemoglobin, g/dl | 12.46±1.30 | 12.05±1.01 | 11.36±0.37 | 10.91±1.50 | ||||
| Corpuscle volume, % | 31.00±4.00 | 31.00±2.00 | 30.00±2.00 | 30.00±2.00 | ||||
| Glucose, m mol/l | 3.78±0.42 | 3.37±0.10 | 4.42±0.73 | 3.57±0.41 | ||||
| Urea, m mol/l | 2.78±1.18 | 3.20±1.34 | 2.81±1.01 | 3.99±0.64 | ||||
| Cetonic bodies | Normal | Normal | Normal | Normal | ||||
| Protein, g/l | 82.40±6.35 | 85.00±4.85 | 80.00±8.29 | 76.20±4.15 | ||||
| Albumin, g/l | 29.00±1.48 | 29.10±0.82 | 33.30±1.14 | 27.00± — | ||||
| Globulin, g/l | 53.40±2.12 | 55.90± — | 46.70± — | 49.20±3.40 | ||||
| Calcium, m mol/l | 2.81±0.11 | 3.12±0.35 | 3.02±0.09 | 3.10±0.22 | ||||
| Phosphorus, m mol/l | 1.40±0.11 | 1.07±0.09 | 1.49±0.10 | 1.28±0.19 | ||||
| Magnesium, m mol/l | 1.06±0.06 | 1.11±0.04 | 1.03±0.06 | 1.05±0.06 | ||||
| Sodium, m mol/l | 155.60±5.27 | 152.40±3.58 | 158.80±3.96 | 157.40±3.78 | ||||
| Potassium, m mol/l | 8.12±8.87 | 8.48±1.18 | 7.32±1.30 | 7.30±1.37 | ||||
![]()
![]()
![]()