|
|
Special features
HIGH PRICES AND VOLATILITY IN AGRICULTURAL COMMODITIES
|
 |
The price boom in agricultural commodity markets: why now and for how long?
|
 |
Agricultural commodity prices rose sharply in 2006 and, in some cases, are soaring at an even faster pace this year. The purpose of this brief is to explain the underlying factors that have led to the current price “boom” and to clarify some of the uncertainties and difficulties associated with determining the future direction of prices.
Prices are high and volatile
|
 |
The FAO food price index rose by 9 percent in 2006 compared with the previous year. In September 2007 it stood at 172 points, representing a year-on-year jump in value of roughly 37 percent. The surge in prices has been led primarily by dairy and grains, but prices of other commodities, with the exception of sugar, have also increased significantly.
High price events, like low price events, are not rare occurrences in agricultural markets although often high prices tend to be short lived compared with low prices, which persist for longer periods. What distinguishes the current state of agricultural markets is rather the concurrence of the hike in world prices of, not just a selected few, but of nearly all, major food and feed commodities. As has become evident in recent months, high international prices for food crops such as grains continue to ripple through the food value/supply chain, contributing to a rise in retail prices of such basic foods as bread or pasta, meat and milk. Rarely has the world witnessed such a widespread and commonly shared concern on food price inflation, a fear which is fuelling debates about the future direction of agricultural commodity prices in importing as well as exporting countries, be they rich or poor.
The price boom has also been accompanied by much higher price volatility than in the past, especially in the cereals and oilseeds sectors (see the next section below for a more detailed analysis of volatility in agricultural markets). Increased volatility highlights the prevalence of greater uncertainty in the market. Supply tightness in any commodity market often raises price volatility in that market. Yet, the current situation differs from the past in that the price volatility has lasted longer, a feature that is as much a result of supply tightness as it is a reflection of ever-stronger relationships between agricultural commodity markets and other markets.
Among major cereals, this season’s main protagonist is wheat, the supply of which has been hampered by production shortfalls in Australia, a major exporter, and low world stocks, while demand has been strong, not only for food but also feed. In September, wheat was traded at record prices, between 50 and 80 percent above last year. Maize prices increased progressively from the middle of last year until February 2007, when they hit a ten-year high, but have fallen considerably since. Supply constraints in the face of brisk demand for biofuels triggered the initial price hike in maize prices. However, reacting to a massive expansion in plantings and expectations of a record crop this year, prices have started to come down, although by September they had still remained 30 percent above last year. Prices of barley, another important cereal, also soared lately. Supply problems in Australia and Ukraine, tighter availability of maize and other feed grains, compounded with strong import demand, have contributed to the doubling of prices of both feed and malting barley in recent weeks.
The tightness in the grain sector also affected the oilseed complex, which witnessed a year-on-year price surge of at least 40 percent, depending on crops and products. Soaring maize markets during the second half of the previous season contributed to keeping oilseed prices at high levels as maize plantings expanded at the expense of oilseed plantings. Due to the expected shrinking of world supplies and historically low inventories in 2007, in the face of faster rising demand for food and biodiesel, as well as unusually strong demand for feed, oilseed markets are experiencing further increases in prices in these early months of the new season.
Among all agricultural commodities, dairy products have witnessed the largest gains compared with last year, ranging from 80 percent to more than 200 percent. Higher animal feed costs, tight dairy supplies following the running down of inventories in the European Union and drought in Australia, the suspension of exports by some countries coupled with the imposition of taxes by others, and dynamic import demand are the main factors that have sustained dairy prices at historically high levels.
High feed prices have also raised costs for animal production and resulted in an increase in livestock prices; with poultry rising most, by at least 10 percent. In addition, growth in consumption and gradual reductions in trade restrictions are contributing to the increase in meat and poultry prices this season.
Beyond the usual supply and demand factors
|
 |
The persistent upward trend in international prices of most agricultural commodities since last year is only in part a reflection of a tightening in their own supplies. Global markets have become increasingly intertwined. As a result, linkages and spill-over effects from one market to another have greatly increased in recent years, not only among agricultural commodities, but across all commodities and between commodities and the financial sector.
Market-oriented policies are gradually making agricultural markets more transparent and, in the process, are elongating the financial opportunities for increased portfolio diversification and reduction in risk exposures. This is a development that is taking place just as financial markets around the world are experiencing the most rapid growth, driven by plentiful international liquidity. This abundance of liquidity reflects favourable economic performances around the world, notably among emerging economies, low interest rates and high petroleum prices. These developments have paved the way for massive amounts of cash becoming available for investment (by equity investors, funds, etc.) in markets that use financial instruments linked to the functioning of agricultural commodity markets (e.g. future and option markets). The buoyant financial markets are boosting asset allocation and drawing the attention of speculators to such markets, as a way of spreading their risk and pursuing of more lucrative returns. Such influx of liquidity is likely to influence the underlying spot markets to the extent that they affect the decisions of farmers, traders and processors of agricultural commodities. It seems more likely, though, that speculators contribute more to raising spot price volatility rather than their levels.
Soaring petroleum prices have contributed to the increase in prices of most agricultural crops: by raising input costs, on the one hand, and by boosting demand for agricultural crops used as feedstock in the production of alternative energy sources (e.g. biofuels) on the other. National policies that aim to reduce greenhouse gas emissions are behind the fast growth of the biofuel industry. Rising fossil fuel prices and attempts to reduce dependence on imported oil, however, have provided the extra incentive for many countries to opt for even more challenging crop production targets. The combination of high petroleum prices and the desire to address environmental issues is currently at the forefront of the rapid expansion of the biofuel sector: this is likely to boost demand for feedstocks, most notably, sugar, maize, rapeseed, soybean, palm oil and other oilcrops as well as wheat for many more years to come. However, much will also depend on the supply and demand fundamentals of the biofuel sector itself.
Freight rates have become a more important factor in agricultural markets than in the past. Increased fuel costs, stretched shipping capacity, port congestion and longer trade routes have pushed up shipping costs. The Baltic Exchange Dry Index, a measure of shipping costs for bulk commodities such as grains and oilseeds, has recently passed the 10 000 mark for the first time with freight rates up more than 80 percent compared with the previous year. Not only have these record freight values increased the cost of transportation, but they have significant ramifications on the geographical pattern of trade, as many countries opt to source their import purchases from nearer suppliers to save on transport costs. In many instances, this development has also sparked a noticeable reduction in the degree of world market integration, with prices at regional or localized levels falling out of line with world levels.
Exchange rate swings play a critical role in all markets and agricultural markets are no exception. Yet, rarely have currency developments been as important in shaping agricultural prices as in recent months. The gradual decline in the US dollar against most currencies since 2005 has made imports from the United States cheaper, thereby boosting demand for products that are exported from the United States. As international prices of most commodities are also primarily expressed in US dollar, this weakening of the dollar has helped push the United States export prices higher, exasperating the overall price strength, especially, in recent months, for wheat.
Evidently, the increases in the US dollar dominated prices of commodities affect international buyers (importers) differently, depending on how the value of their own currency changed vis-à-vis the US dollar. The fact that the dollar depreciated sharply against all major currencies lessens the true impact of the rise in world prices, a major reason behind the brisk world import demand that, in spite of high prices, shows very little sign of retreat or rationing.
What next?
|
 |
The main factor affecting the uncertainty in agricultural markets is how linkages with other markets, including markets of other agricultural commodities, will influence the direction and magnitude of price changes during the coming months and into the next season. This volatility in prices, especially in the case of agricultural crops, will represent a major hurdle in decision-making by farmers around the world.
Nowhere is this more evident than in the current debate about wheat plantings for next season. To most farmers, the current high wheat prices are only one reason to plant more wheat. The other is the general anticipation that even if wheat prices were to decline from their current high values, the decrease is expected to be less than those of other competing crops. In other words, farmers would be better off planting more land to wheat because of its higher relative profitability compared with other crops. In fact, all indications point to more wheat being planted around the world for harvesting next year. The recent decision by the European Union to release land from its set-aside programmes and the move by other major producing countries such as India to encourage farmers to grow more wheat by raising wheat procurement prices are also likely to pave the way for a much-needed rebound in world production in 2008. All of the above, of course, assumes a normal weather situation, notwithstanding the fact that weather is impossible to predict. Prolonged drought in Australia, especially this year and last, affecting as it did a major wheat exporter, is a case in point. Yet, a strong expansion in wheat production, assuming normal growth in consumption, is bound to bring down wheat prices.
This brings about a critical issue: if more wheat gets planted, what will happen to the prices of other crops? Part of the answer can be found in what took place in the previous season with maize: once maize prices began to rise, plantings expanded across the world; jumping by 19 percent alone in the United States. Higher plantings and favourable weather drove maize production to a record this year, and this abundance started to push down prices, which are now well below their earlier highs, but still above levels of last year. Given a limited potential for expanding the agricultural frontier, the increase in maize plantings was at the expense of reductions in areas dedicated to several other crops, the production of which suffered as a result. A good example is soybeans and, to some extent, wheat and cotton. It is clear that by shifting land out of one crop into another, prices of those crops with reduced planting could increase.
Such trends have always existed and switching crops to maximize returns is nothing new. Most countries produce a host of crops and planting periods together with areas can be similar, making substitution easier (see Table). However, what makes recent episodes differ from the past is that inventories are being kept at low (almost pipeline) levels, which makes prices particularly sensitive to unexpected changes. In other words, agricultural markets, and food crops in particular, may be going through a period whereby stocks, especially those in major exporting countries, no longer play their traditional role as a buffer against sudden fluctuations in production and demand. This change has come about because of reduced government interventions associated with a general policy shift towards liberalizing agricultural commodity markets.
The role of farmers in this ever more populated world has never been more critical. It is one of FAO's key roles, at this key juncture, to help farmers in making the right decisions, by providing them with reliable and timely information about market and price trends.
| | | | | | | | | | | | | |
Country |
Crop | | | | | | | | | | | | | | |
% Share in |
% Share in | | | | | | | | | | | | | | |
World Production |
World Exports |
Total Domestic Arable Land | | |
Jan |
Feb |
Mar |
Apr |
May |
Jun |
Jul |
Aug |
Sep |
Oct |
Nov |
Dec | |
Argentina | | | | | | | | | | | | | | | | | Wheat | | | | | | | | | | | | | 2.2 | 8.2 | 19.7 | | Maize | | | | | | | | | | | | | 2.6 | 15.1 | 8.7 | | Sorghum | | | | | | | | | | | | | 4.5 | 8.6 | 1.8 | | Soybeans | | | | | | | | | | | | | 17.2 | 31.0 | 47.7 | | Sunflower | | | | | | | | | | | | | 12.6 | 30.0 | 7.1 | | Sugar Cane | | | | | | | | | | | | | 1.4 | 0.9 | 1.0 | | | | | | | | | |
Australia | | | | | | | | | | | | | | | | | Wheat | | | | | | | | | | | | | 2.8 | 11.7 | 27.1 | | Barley | | | | | | | | | | | | | 4.6 | 19.3 | 9.5 | | Sorghum | | | | | | | | | | | | | 2.7 | 2.2 | 1.5 | | Cotton | | | | | | | | | | | | | 1.6 | 6.0 | 0.5 | | Rapeseed | | | | | | | | | | | | | 3.6 | 4.0 | 2.4 | |
Brazil | | | | | | | | | | | | | | | | | Wheat | | | | | | | | | | | | | 0.6 | 0.2 | 4.4 | | Maize | | | | | | | | | | | | | 5.9 | 5.6 | 20.8 | | Rice | | | | | | | | | | | | | 1.9 | 0.8 | 6.1 | | Cotton | | | | | | | | | | | | | 4.6 | 2.0 | 1.8 | | Soybeans | | | | | | | | | | | | | 25.2 | 31.0 | 35.5 | | Sugar Cane | | | | | | | | | | | | | 31.2 | 39.5 | 9.5 | | | | | | | | | | | | | |
Canada | | | | | | | | | | | | | | | | | Wheat | | | | | | | | | | | | | 4.0 | 14.8 | 22 | | | | | Maize | | | | | | | | | | | | | 1.3 | 0.3 | 2.5 | | Barley | | | | | | | | | | | | | 8.1 | 11.9 | 9.0 | | Rapeseed | | | | | | | | | | | | | 18.5 | 67.0 | 11.5 | | Soybeans | | | | | | | | | | | | | 1.4 | 1.0 | 2.5 | |
China | | | | | | | | | | | | | | | | | Wheat | | | | | | | | | | | | | 16.9 | 1.5 | 15.6 | | Maize | | | | | | | | | | | | | 19.8 | 4.9 | 17.8 | | Barley | | | | | | | | | | | | | 2.6 | 0.0 | 0.6 | | Sorghum | | | | | | | | | | | | | 4.2 | 0.4 | 0.4 | | Oats | | | | | | | | | | | | | 2.7 | 0.0 | 0.2 | | Rice | | | | | | | | | | | | | 29.5 | 4.6 | 19.8 | | | | | Cotton | | | | | | | | | | | | | 27.6 | 4.0 | 3.7 | | Rapeseed | | | | | | | | | | | | | 28.2 | 1.0 | 5.1 | | Soybeans | | | | | | | | | | | | | 8.2 | 1.0 | 6.7 | | Sunflower | | | | | | | | | | | | | 6.1 | 1.0 | 0.7 | | Sugar Beets | | | | | | | | | | | | | 2.7 | 0.2 | 0.2 | | Sugar Cane | | | | | | | | | | | | | 6.8 | 0.5 | 1.0 | | | | | | | | |
EU-27 | | | | | | | | | | | | | | | | | Wheat | | | | | | | | | | | | | 20.0 | 11.5 | 23.2 | | Maize | | | | | | | | | | | | | 6.6 | 0.2 | 8.6 | | Barley | | | | | | | | | | | | | 39.6 | 21.4 | 12.54 | | Oats | | | | | | | | | | | | | 32.7 | 8.4 | 2.7 | | Rapeseed | | | | | | | | | | | | | 31.3 | 2.0 | 4.2 | | Sunflower | | | | | | | | | | | | | 23.1 | 7.0 | 3.5 | | Sugar Beets | | | | | | | | | | | | | 53.4 | 76.9 | 2.0 | |
India | | | | | | | | | | | | | | | | | Wheat | | | | | | | | | | | | | 11.6 | 0.4 | 16.3 | | Maize | | | | | | | | | | | | | 2.0 | 0.3 | 4.5 | | Sorghum | | | | | | | | | | | | | 12.6 | 0.4 | 5.8 | | Rice | | | | | | | | | | | | | 21.7 | 15.0 | 26.3 | | | | | | | Cotton | | | | | | | | | | | | | 13.8 | 0.0 | 5.3 | | Rapeseed | | | | | | | | | | | | | 12.9 | 11.0 | 3.6 | | Soybeans | | | | | | | | | | | | | 3.2 | 4.0 | 4.2 | | Sunflower | | | | | | | | | | | | | 3.6 | 0.0 | 1.2 | | Sugar Cane | | | | | | | | | | | | | 19.1 | 1.3 | 2.5 | | | | | | |
| | | | | | | | | | | | | |
Country |
Crop | | | | | | | | | | | | | | |
% Share in |
% Share in | | | | | | | | | | | | | | |
World Production |
World Exports |
Total Domestic Arable Land | | |
Jan |
Feb |
Mar |
Apr |
May |
Jun |
Jul |
Aug |
Sep |
Oct |
Nov |
Dec | |
Indonesia | | | | | | | | | | | | | | | | | Maize | | | | | | | | | | | | | 1.7 | 0.1 | 14.8 | | | | | Rice | | | | | | | | | | | | | 8.1 | 0.0 | 51.0 | | | | | | Soybeans | | | | | | | | | | | | | 0.4 | 0.0 | 2.5 | | Sugar Cane | | | | | | | | | | | | | 2.1 | 0.5 | 1.9 | | | | | | | | | |
Mexico | | | | | | | | | | | | | | | | | Wheat | | | | | | | | | | | | | 0.5 | 0.4 | 2.4 | | Maize | | | | | | | | | | | | | 3.0 | 0.0 | 29.3 | | Sorghum | | | | | | | | | | | | | 9.0 | 0.0 | 7.3 | | Sugar Cane | | | | | | | | | | | | | 3.5 | 1.4 | 2.6 | | | | | | | | | | |
Russian Fed | | | | | | | | | | | | | | | | | Wheat | | | | | | | | | | | | | 7.6 | 9.7 | 18.5 | | | | Barley | | | | | | | | | | | | | 12.2 | 10.1 | 7.5 | | Oats | | | | | | | | | | | | | 19.5 | 0.0 | 2.6 | | Sunflower | | | | | | | | | | | | | 19.2 | 14.0 | 4.1 | | Sugar Beets | | | | | | | | | | | | | 8.6 | 1.7 | 0.7 | |
South Africa | | | | | | | | | | | | | | | | | Wheat | | | | | | | | | | | | | 0.3 | 0.2 | 5.4 | | Maize | | | | | | | | | | | | | 1.2 | 1.3 | 22.7 | | Sunflower | | | | | | | | | | | | | 2.4 | 0.0 | 3.6 | | Sugar Cane | | | | | | | | | | | | | 1.5 | 2.9 | 2.9 | | | | | | | | |
Ukraine | | | | | | | | | | | | | | | | | Wheat | | | | | | | | | | | | | 2.6 | 3.7 | 14.9 | | Maize | | | | | | | | | | | | | 0.9 | 1.8 | 6.1 | | Barley | | | | | | | | | | | | | 6.4 | 26.1 | 13.8 | | Oats | | | | | | | | | | | | | 3.0 | 1.0 | 1.5 | | Sunflower | | | | | | | | | | | | | 14.3 | 35.0 | 11.2 | | Sugar Beets | | | | | | | | | | | | | 6.2 | 2.2 | 2.0 | |
USA | | | | | | | | | | | | | | | | | Wheat | | | | | | | | | | | | | 9.0 | 24.3 | 11.8 | | | | Maize | | | | | | | | | | | | | 40.4 | 63.6 | 16.9 | | Barley | | | | | | | | | | | | | 3.2 | 2.9 | 0.9 | | Sorghum | | | | | | | | | | | | | 16.2 | 72.2 | 1.5 | | Oats | | | | | | | | | | | | | 6.2 | 1.5 | 0.4 | | Rice | | | | | | | | | | | | | 1.5 | 10.8 | 0.7 | | Cotton | | | | | | | | | | | | | 17.4 | 29.0 | 3.0 | | Rapeseed | | | | | | | | | | | | | 1.6 | 3.0 | 0.2 | | Soy | | | | | | | | | | | | | 38.8 | 27.0 | 17.0 | | Sunflower | | | | | | | | | | | | | 4.7 | 3.0 | 0.5 | | Sugar Beets | | | | | | | | | | | | | 11.0 | 2.2 | 0.3 | | Sugar Cane | | | | | | | | | | | | | 2.1 | 0.7 | 0.2 | | | | | | | | | | | | | | | | | | | | | | | | | | | | | Planting | | Harvesting | | | | | |
Note: This table highlights the main periods with regard to the planting and harvesting of the most relevant agricultural crops at a highly aggregated level. This list does not intend to be exhaustive. The compiled information is based on the last five years.
VOLATILITY IN AGRICULTURAL COMMODITIES
|
 |
Why does volatility matter?
|
 |
Volatility measures the degree of fluctuation in the price of a commodity that it experiences over a given time frame. Wide price movements over a short period of time typify the term ‘high volatility’. International prices for agricultural commodities are renowned for their high volatility, a feature which has been, and continues to be a cause for concern among governments, traders, producers and consumers. Many developing countries are still highly dependent on commodities, either in their export or import. While high price spikes can be a temporary boom to the export economy, they can also heighten the cost of importing foodstuffs and agricultural inputs. At the same time, large fluctuations in prices can have a destabilizing effect on real exchange rates of countries, putting a severe strain on their economic environment and hampering efforts to reduce poverty. In a prolonged volatile environment, the problem of extracting the true price signal from the noise may arise, a situation that can lead to an inefficient allocation of resources. Greater uncertainty limits opportunities for producers to access credit markets and tends to result in the adoption of low risk production technologies at the expense of innovation and entrepreneurship. In addition, the wider and more unpredictable price changes of a commodity are, the greater is the possibility of realizing large gains on speculating future price movements of that commodity. That is to say, volatility can attract significant speculative activity, which in turn can initiate a vicious cycle of destabilizing cash prices.
How do we measure volatility?
|
 |
Volatility measures how much prices have moved or how they are expected to change. Historical volatility represents past price movements and reflects the resolution of supply and demand factors. It is often computed as the annualized standard deviation of the change in price. On the other hand, implied volatility represents the market’s expectation of how much the price of a commodity is likely to move in the future. The data upon which historical volatility is calculated may no longer be reflective of the prevailing or expected supply and demand situation. For this reason, implied volatility tends to be more responsive to current market conditions. It is called “implied” because, by dealing with future events, it cannot be observed, and can only be inferred from the price of an “option”.
An “option” gives the bearer the right to sell a commodity (put option) or buy a commodity (call option) at a specified price for a specified future delivery date. Options are just like any other commodity, and are priced based on the law of supply and demand. Any excess or deficit of demand would suggest that traders have different expectations of the future price of the underlying commodity. The more divergent these expectations are, the higher the implied volatility of the underlying commodity. Using the price of an option to estimate price volatility is analogous to using the future’s price to estimate the spot price at the future’s delivery date and location.
Does implied volatility matter? Prices that are observed today of commodities which are traded in the major global exchanges are in someway determined by movements in implied volatility, in that they convey all information, future and the present, pertinent to the market and the commodity. Hence, implied volatility as a metric is an important instrument used in the price discovery process and as a barometer as to where markets might be headed.
How has volatility evolved?
|
 |
For wheat, maize and soybeans, the CBOT is widely regarded as the major centre for their price discovery. Implied volatilities during the past ten years for these commodities as well over the past 22 months are shown in the following figure.
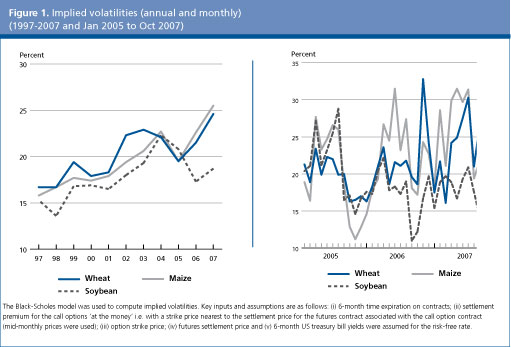
Volatility for wheat and maize has been creeping up steadily over the course of the decade, while soybean volatility has been relatively flat. Moreover, it now appears more of a permanent feature in the grain markets than was the case in the past. A more detailed examination of the recent past reveals just how volatile grain markets have become and how volatility has been sustained. Since the beginning of 2006, wheat and maize implied volatility has frequently spiked to levels in the realm of 30 percent, and as of 11 October 2007, implied volatility stood at 27 and 22 percent for each commodity, respectively. How are these values interpreted?
These percentages are a measure of the standard deviation in the expected price six months ahead. Assuming that prices are normally distributed, the properties of the distribution can be used to say ‘the market estimates with 68 percent certainty that prices will rise or fall by 27 percent for wheat and 22 percent for maize’. In a similar vein, the likelihood that prices will exceed their current values by more than 50 percent in six months time is perceived to have a probability of around 2 percent, in other words quite unlikely. This is not to say that such events will not take place. The surge in maize prices that began in September 2006 surprised the markets, then, although traders were betting on higher prices, they handed only a 5 percent chance of a 50 percent or more increase in the price of maize in six months. Instead, prices actually climbed by almost 60 percent in that period. A one-off misjudgement? Apparently not. More recently, wheat traders were caught totally off-guard, when in April 2007 they were 99 percent certain that wheat prices would not rise by more than half their value, in six months, wheat prices had doubled. The large upswings in implied volatilities witnessed today, bear testimony to the enormous uncertainty that markets face in predicting how grain prices could evolve in the short term.
In the absence of readily available options data to estimate implied volatility for other commodities, historical volatilities were calculated, and for consistency, computations were also made for soybeans, wheat and maize. Classifying the latter with rice under ‘bulk commodities’, a similar picture to the above is portrayed. Wheat and maize price volatility has steadily risen over the past decade, peaking at over 30 percent in 2007. By contrast, volatility in the rice sector has moved sharply downwards, and in 2007 stood at just one-eighth of the variability in the grain sector.
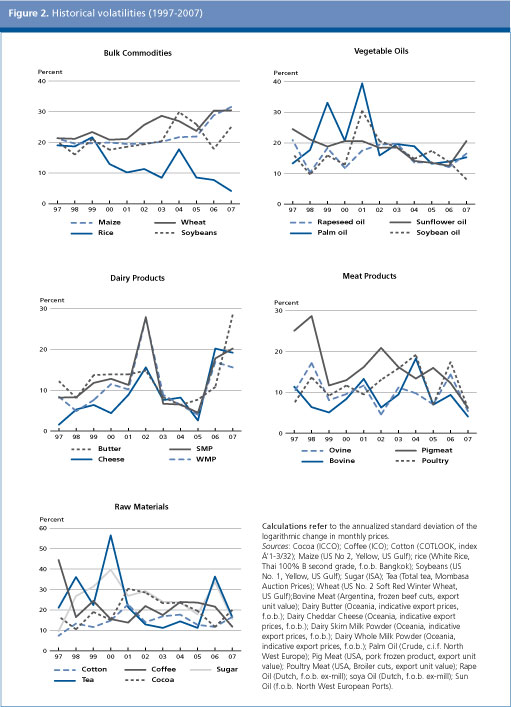
Among the vegetable oils, volatility has been fairly even since 1982 for all the products, but there appears some resurgence in the prices of palm, sunflower and rapeseed oil. The upturn in volatility for dairy product prices has been most striking, rising almost four-fold since 2005 in the case of butter. By contrast, price changes in meat products have been in a state of quiescence over the past two years. Similarly volatility for many raw materials, traditionally the highest of all agricultural commodities, has steadily fallen, but for sugar and tea, from the peaks of the previous year.
Volatility is an important property in understanding the tendency for a commodity to undergo price changes. More volatile commodities undergo larger and more frequent price changes. Implied volatility can be a useful metric in revealing how traders expect prices to evolve in the shorter term. However, given the huge upheaval in grain markets over the past year or so, it also exposes just how wrong expectations can be.
INTERNATIONAL YEAR OF THE POTATO 2008
|
 |
The Sixtieth Session of the United Nations’ General Assembly adopted a resolution that sought to focus world attention on the importance of the potato in providing food security and alleviating poverty. By declaring the year 2008 as the International Year of the Potato (IYP 2008) and inviting FAO to facilitate its implementation, an opportunity will be provided to raise awareness, among policy-makers, donors and the general public, especially young people and school children, on the importance of the potato in particular, and on agriculture in general, in addressing issues of global concern, such as food insecurity, malnutrition, poverty and threats to the environment. For more information please visit: www.potato2008.org
Why potato?
|
 |
Over the next two decades, the world's population is expected to grow on average by more than 100 million people a year. More than 95 percent of that increase will occur in the developing countries, where pressure on land and water is already intense. A key challenge facing the international community is, therefore, to ensure food security for present and future generations, while protecting the natural resource base on which we all depend. The potato will be an important part of efforts to meet those challenges.
Potatoes feed the hungry
|
 |
The potato should be a major component in strategies aimed at providing nutritious food for the poor and hungry. It is ideally suited to places where land is limited and labour is abundant, conditions that characterize much of the developing world. The potato produces more nutritious food more quickly, on less land, and in harsher climates than any other major crop; up to 85 percent of the plant is edible human food, compared with around 50 percent in cereals.
Potatoes are grown worldwide
|
 |
The potato has been consumed in the Andes for about 8 000 years. Taken by the Spanish to Europe in the 16th century, it quickly spread across the globe: today potatoes are grown on an estimated 195 000 km², or 75 000 square miles, of farmland, from China's Yunnan plateau and the subtropical lowlands of India, to Java's equatorial highlands and the steppes of Ukraine. In terms of sheer quantity harvested, the humble potato tuber is the world's No. 4 food crop, with production in 2006 of almost 315 million tonnes. More than half of that total was harvested in developing countries. The note overleaf provides an overview of the potato market from a global perspective and discusses the major trends and challenges for the sector.
| |
Global Potato Economy
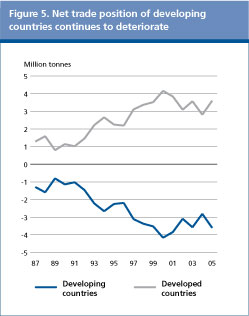
Over the past few decades, contrasting trends have emerged within global potato supply, demand and trade. Production in the developed regions has declined steadily, while output in Africa and Asia expanded rapidly. Subsistence production has decreased as more potato farmers in developing countries have reoriented potato cultivation toward production for the domestic and international market. Global consumption of potatoes is shifting from the fresh market to added-value processed products (e.g., French fries, chips), a tendency which reflects increasing urbanization throughout the world and growing demand by global consumers for convenience foods. The structure of international trade in potatoes has also undergone substantial change. Both the value and volume of traded processed products far outweigh trade in fresh tubers. Developing countries are net importers in international potato trade, which in 2005 was estimated to be worth US$6 billion globally. Despite its importance as a staple crop and in combating hunger and poverty, potato has often been neglected in agricultural development policies for food crops. The commodity has superior nutritional attributes and great potential for added value through processing. Redressing the trade imbalance is an important challenge for the sector.
| |
Major trends
|
 |
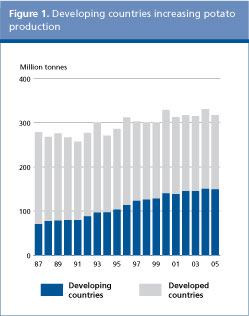
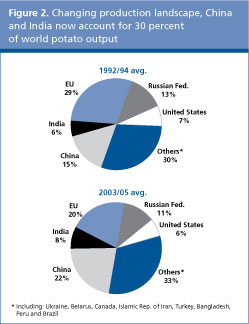
World potato production and consumption are expanding at rates lower than the population growth. Production in developed countries, especially in Europe and the CIS, has declined on average by 1 percent per annum over the past 20 years. However, output in developing countries expanded at an average rate of 5 percent per year. Asian countries, particularly China and India, fuelled this growth.
By 2005, the developing countries’ share of global potato output stood at 47 percent. In the next few years, aggregate production of this country group is expected to surpass that of developed countries: this is a remarkable achievement, considering that just 20 years ago the developing countries’ share in global production stood at just over 20 percent.
Fresh potato consumption, once the mainstay of world potato utilization, is decreasing in many countries, especially in developed regions. Currently, more potatoes are processed to meet rising demand from the fast food, snack and convenience food industries. The major drivers behind this development include growing urban populations, rising incomes, the diversification of diets and the time needed to prepare the fresh product for consumption.
Potatoes are commonly regarded as a bulky, perishable, and a high transport cost commodity with limited export potential, confined mostly to cross-border transactions. These constraints have not hampered the international potato trade, which has doubled in volume and risen almost fourfold in value since the mid-1980s. This growth is due to unprecedented international demand for processed products, particularly frozen potato products. To date, developing countries have not been beneficiaries of this trade expansion. As a group, they have emerged as leading net importers of the commodity.
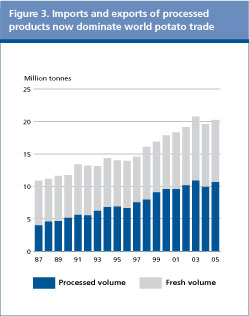
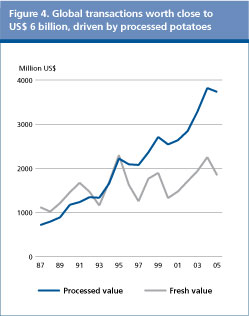
International trade in potatoes and potato products still remains thin relative to production, as only around 6 percent of output is traded. High transport costs, including the cost of refrigeration, are major obstacles to a wider international marketplace.
Trade policies – a blight to the global potato economy?
|
 |
Ad valorem import tariffs are used to protect domestic potato markets. Other policies that restrict access to markets include sanitary and phytosanitary (SPS) measures and technical barriers to trade.
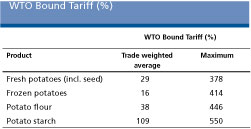
Import tariffs on potatoes and potato products are applied by most countries. The binding rates agreed under the WTO vary considerably. Potato provides a classic example of “tariff escalation”, where importing countries protect processing industries by levying higher duties on processed products than on raw material. By preventing countries from diversifying their export base into higher value processed products, tariff escalation can therefore keep them “trapped” as providers of raw material.
Countries wishing to engage in supplying potato commodities to the international market, especially to the more lucrative developed country markets, also face considerable hurdles imposed by food health standards and technical regulations.
The Doha Development Round recognizes the negative impacts of tariff escalation and contains important provisions aimed at ensuring that standards and regulations do not become de facto barriers to trade or hidden protectionist policies, while at the same time putting public health concerns foremost. Unfortunately, negotiations pertaining to the Doha agenda have suffered a series of setbacks, and agreement towards a final solution is yet to materialize.
Potato potential
|
 |
Potato’s positive attributes, particularly the commodity’s high nutritional value and its potential to boost incomes, have not received the attention they deserve from governments. The lack of established marketing channels, inadequate institutional support and infrastructure, and restrictive trade policies are impediments to commercialization of the sector. National and international stakeholders need to place potato higher on the development agenda.
|
 November 2007