![]()
![]()
![]()
A site survey is a way of "freezing" the landscape into the form of a map, much as a camera does when it takes a photograph. Unlike a photograph, however, the survey provides many more data than would be seen by the naked eye.
In the past many artisanal shelters were built at convenient locations without much attention being paid to environmental factors such as wave heights, uncharted reefs, currents, seaweeds and sand drift.
Problems arose from these factors and many of the problems that used to be considered minor have now developed into major ones. Some shelters, for example, foul up with seaweed because the shelter mouth is facing in the wrong direction. Other shelters silt up because they have been placed directly on a beach, or they become inaccessible in rough weather because there are reefs too close to the entrance channel.
A good site survey is therefore essential to make sure that the shelter or landing is easy to use and free of maintenance problems under normal conditions.
A good site survey should produce the following items:
Topographic map. This is a map showing all the relevant land details near the proposed shelter. Features such as the village, pathways, roads, wells, the electricity supply cables, beaches, rocky outcrops and vegetation appear on a topographic map. Contour map. This shows the sea-bottom depths in and around the proposed shelter. Depths are shown either in grid form or as contours. Tide survey. This is a table showing the maximum and minimum tide-levels at the proposed location. Tidal stream survey. This is a map showing the location, direction and strength of tidal streams. Wave height survey. This is a table showing the direction, frequency and intensity or heights of waves for the area proposed.
Several kinds of instruments are required for a proper survey. These instruments have been divided into two groups, Group A and Group B.
The prices of all the items in groups A and B vary considerably depending on the country of origin, the brand name of the manufacturer and other factors.
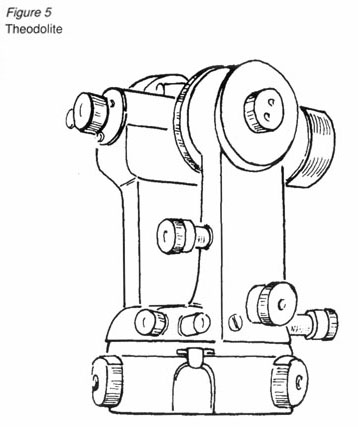
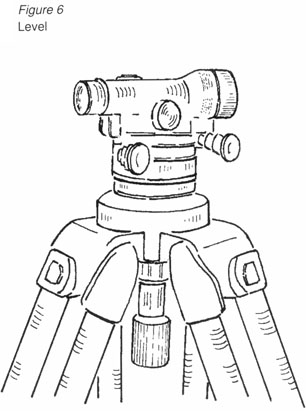
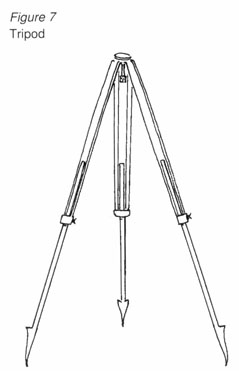
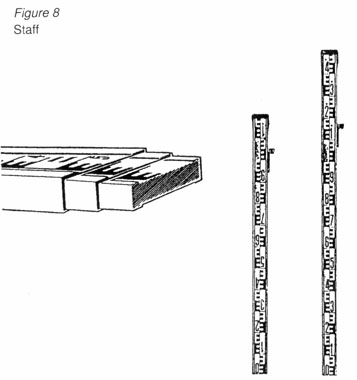
The instruments in Group A are very expensive and should be hired or borrowed from the local public works office or contractor, preferably with the services of an operator or surveyor from the same office. Instruments from Group A are shown in Figure 5 to Figure 9.
|
|
|
||
|
|
|
|
|
||
When borrowing a theodolite or level from an office, make sure that the tripod anchor bolt fits both instruments as some brands are not interchangeable, i.e. the tripod may fit the theodolite but not the level. In this case a separate tripod is required for each instrument. |
|
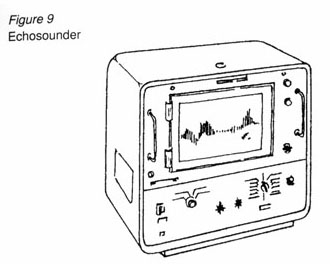
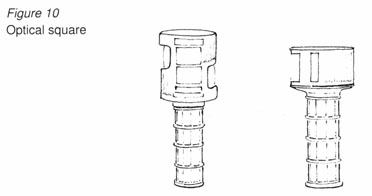
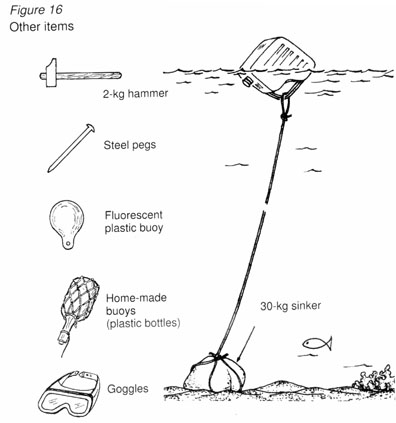
The hydrographic office, the public works department or the port authorities usually own this type of echosounder which they use to monitor the silting up of approach channels to major ports. A portable instrument of this kind should come with a pair of special battery cables, a separate transducer head, one or two rolls of thermal paper and a spare stylus. A fully charged 12-volt car battery is required to operate it. The items in Group B are relatively cheap and some may even be assembled on-site from inexpensive materials. Some of the instruments from Group B are shown in Figure 10 to Figure 16. |
|
|
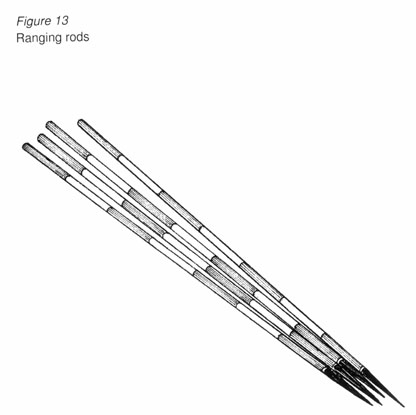
Ranging rods can either be purchased outright or made from pieces of straight pipe, roughly 1.5 m long, with red and white bands (150 mm wide) painted as shown Figure 13. |
 |
 |
|
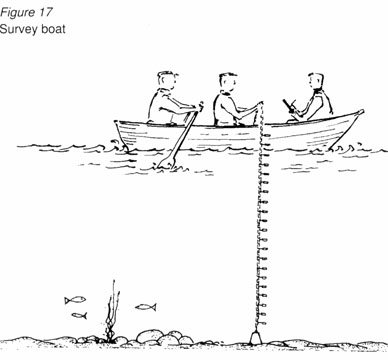
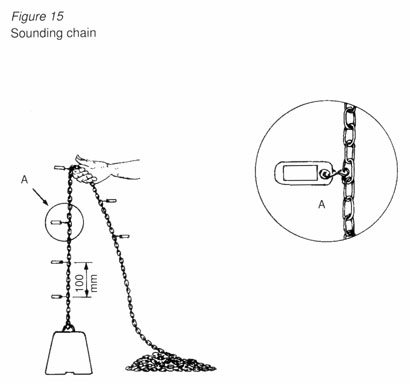
A sounding chain is very easy to assemble from normal metal chain, plastic tags and wire. The weight should ideally, be made of lead. |
|
When using a hand-held chain, a pair of oars are necessary. Three people are needed on the survey boat: the pilot, the person who holds the chain and an assistant who records the readings on paper. |
This booklet assumes that when a theodolite, a level or an echosounder have been borrowed or hired from an office, someone from that office has been made available to operate the instrument.
Topographic map
The topographic map has to be made by a trained surveyor. Details
of how a topographic map survey is carried out are too
complicated for this booklet to discuss.
Contour map
A contour map is a plan of the depth of the sea-bed. Each contour
of equal depth is indicated by a line on which the depth, in
metres is clearly marked.
The survey carried out to obtain the contour map is called the
Hydrographic survey.
In a hydrographic survey, the actual measurement of the depth is
the easy part. The main problem is knowing how far the boat is
from the coastline when the depth is recorded.
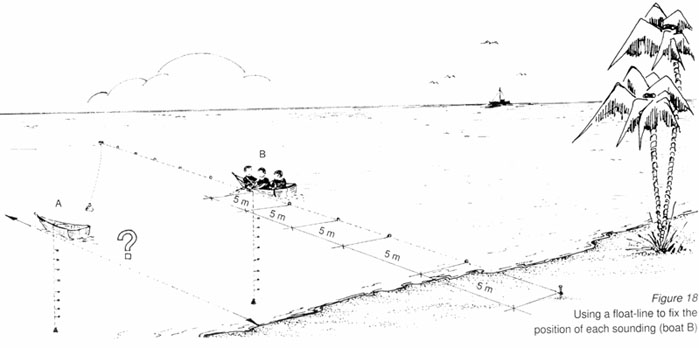
For example, boat A in Figure 18 has no point of reference in
relation to the coast. Boat B on the other hand, is using a
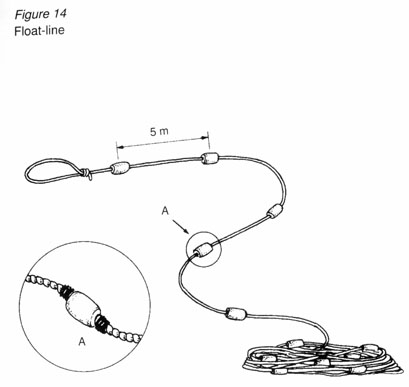
calibrated float-line (see Figure 14) to obtain a fix or
position with respect to the coastline. In this case the
coastline is 20 m away on the straight line between the peg and
the buoy.
The float-line should be set up or floated out between a peg on
the coastline and a floating buoy offshore, as shown in Figure
18. The peg driven into the ground is simple to set out and
should fit into the topographic map of the shore around the
proposed shelter.
There are two simple methods for setting out the position of the
buoy to which the float-line is to be attached:
The ray method (Figure 19) is considered the simplest and is ideally suited for confined work, like, such as when working off a solitary offshore rock or a headland. The instruments required are a theodolite and about 20 buoys.
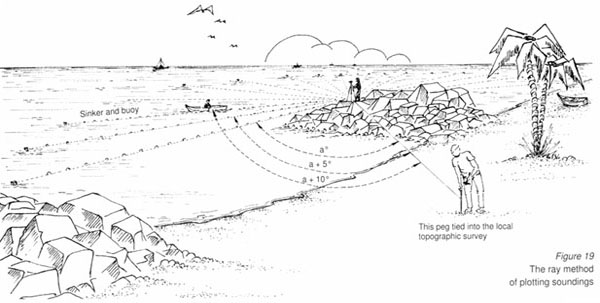
This method involves setting up the theodolite on a vantage point that can easily be tied into the topographic survey. At equal angular intervals, say at every 5 or 10 degrees, a buoy should be dropped in place roughly 200 m from the theodolite. These angles should be measured from a fixed mark or benchmark, such as an electricity pole, a big tree or the corner of a building. This will produce a fan shape when in the buoys have been dropped in. Float-lines should then be anchored from the peg under the theodolite to each of the buoys around the fan. By taking into account the position of the peg on the ground and the angle of each buoy from the benchmark, the depth readings can be plotted on paper in the right place in the form of a fan.
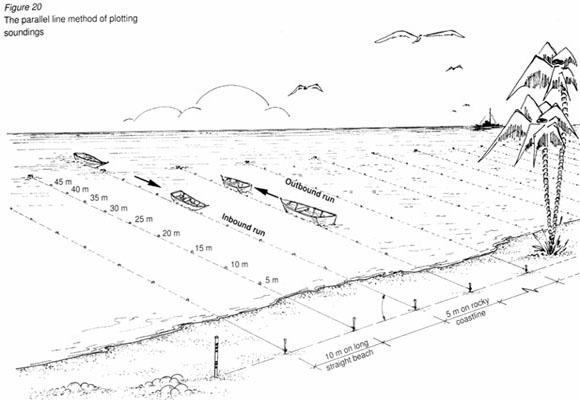
The parallel line method (Figure 20) is much more accurate, but requires considerably more groundwork.
The instrument required is: an optical square, two ranging rods, about 10 pegs and buoys; and a 100-m measuring tape.
First, set out a straight baseline along the beach with a ranging rod placed at either end. The baseline should be at least 100 m long. If the coasdtline is rocky, a steel peg should be driven into the ground every 5 m along the baseline. On flat beach, however, one steel peg every 10 m is enough. Then, with the help of the optical square, a buoy should be dropped offshore at right-angles to each peg. A float-line should be anchored between each peg and its corresponding buoy offshore. By tying the baseline into the topographic survey, the depth readings can be plotted on paper in the right place.
It is always a good practice to extend the survey for 50-100 m, on either side of the proposed shelter or landing.
The actual depth of the water may be read by simply lowering
the sounding chain (Figure 15) every 5 or 10 m along the floatlines.
The person using the chain calls out the readings to another
person in the boat who records the figures on paper in the correct
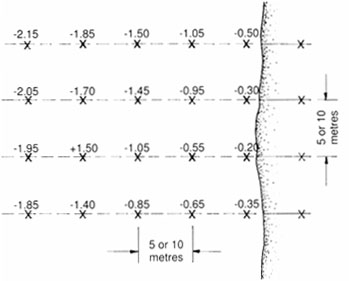
order. This type of recording yields a grid with spot depths only, as
shown in Figure 21.
If a hydrographic echosounder and an experienced operator are
available, the soundings are recorded on a special paper roll by the
instrument itself. In this case, only the echosounder operator need
accompany the boat pilot on the survey vessel up and down the
graduated float-lines. A continuous bottom profile is obtained on a
continuous strip-chart.
This strip-chart can be read to the nearest 5 mm.
When making a contour map or grid map remember:
The sounding chain must reach the bottom in a straight vertical line. When a sounding chain is being used, the vessel must be still while the reading takes place. If the area is subject to strong tidal streams, the weight of the sinker should be increased by attaching weights to the chain. If a hydrographic echosounder is being used, readings should be taken as the boat approaches the shore on an inbound run (Figure 20). If the vessel's skipper starts an inbound run, say 50 m from the float, it will be easier to position the boat parallel to the float-line. Surveys should not be carried out on stormy or windy days. Flood and ebb periods in strong tidal areas should also be avoided. The sea should be perfectly calm. In rocky areas, before the float-lines are removed, a swimmer wearing a pair of goggles can swim up and down the surveyed line looking for submerged rock outcrops or wrecks. The swimmer can then point these out by placing small floats near them. The depth of water over each obstacle can then he measured and the small floats plotted on the survey map by taking a series of fixes from the baseline with the theodolite.
A detailed grid map (Figure 21) is usually sufficient for normal day-to-day coastal work. At local village level no attempt should be made to convert a grid map into a contour map; this should be left to a professional surveyor at the public works office. If a hydrographic echosounder was used for the survey, the same operator is the best person to interpret the strip-chart and produce the contour map.
Figure 21
Soundings plotted using
the parallel line method (the "+" sign
indicates a rocky outcrop sticking
out above mean sea level or msl,
depths are in metres )
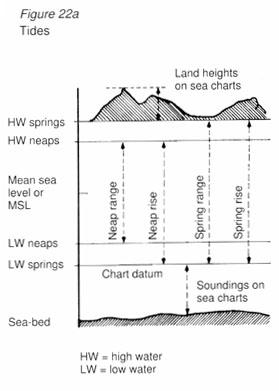
Tide survey
You may need the help of an experienced surveyor or extension
worker to help you fully understand the following series of surveys.
It is most important that tides should not be confused with tidal
streams. A tide is a periodic vertical movement in the level of the
sea. A tidal stream, on the other hand, even though it results from a
tide, is a periodic horizontal movement.
Tides affect the depth of the water at a particular place. Tidal
streams affect navigation courses.
Tides are affected by the solar cycle. Twice a month, first when
the moon is new and again when it is full, spring tides will be
experienced. This is when the highest high waters and the lowest
low waters of a tide cycle occur. Seven-and-a-quarter days after the
spring tide, with the first and last quarters of the moon, the neap tide
occurs. This is when the lowest high waters and the highest low
waters of a tidal cycle are experienced.
There are thus two separate tide cycles: height fluctuations from
springs to neaps, which take place twice each in a lunar month (29
days); height oscillations of each tide from high water to low water,
which take place twice each in a lunar day.
This is a basic description of the phenomenon of the tides. There
are, of course, other factors to be considered. The fact that the orbits
of the earth and the moon are ellipses and not circles must also be
taken into account. These ellipses have a corresponding seasonal
(equinox) effect on the height of the tide wave (astronomical tide).
Wind and barometric pressure also exercise an uncertain influence
on the tide wave. A wind blowing onshore usually tends to raise the
height of a tide, while an offshore wind tends to lower it. A wind
blowing in the same direction as the advancing tide wave crest tends
to hasten the time of high water and a wind blowing in the opposite
direction will delay it. The tidal range can be as little as 100 mm and
as much as several metres. In most countries, tide tables are
available from the hydrographic office or harbour office.
Tides are important factors in safe navigation. Navigators,
whether of fishing boats or ferries, are continuously asking
themselves "How deep is the water under my boat?"
To ensure safe navigation in and out of manmade ports, all depth
soundings are referred to chart datum, or low water spring level, and
all land heights are referred to high water spring level.
To record a tide table for a particular area or coastal village, all
that is required is a simple tide gauge installed in a relatively calm
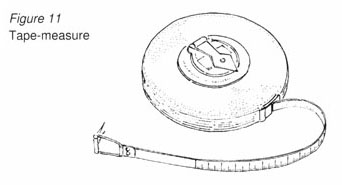
place. A tide gauge can easily be made from a piece of steel or plastic tube, or a piece of timber, with a length of plastic tape-measure tied to its side - a tailor's plastic tape is ideal
for this purpose (Figure 22b).
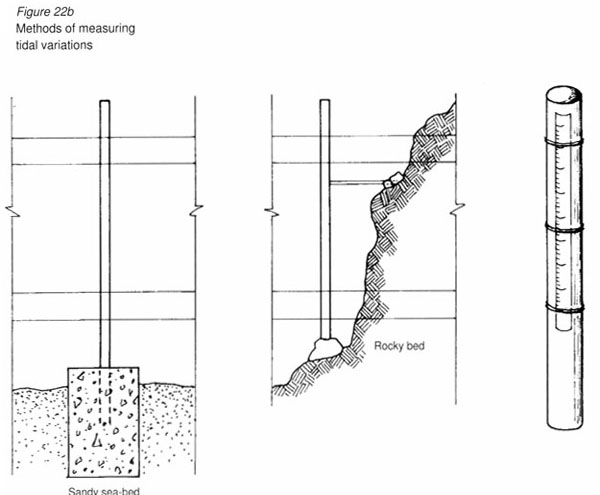
In a sandy location, the upright pipe or timber should be driven into an oil drum filled with concrete or stones. The whole contraption can then be buried in a suitably calm place where the tape can easily be read. In a rocky location, the pole or pipe should be concreted inside a hole in the rock. To install the tide board (in this case, the tape-measure), a surveyor equipped with a level and staff should be called in. By recording the level of the sea a few days before and after a new moon, the low water spring level can be deduced. This is the lowest point reached by the water level and the tide board can be installed by placing the zero mark of the tape at this level. The full tidal range can then be recorded. Once the tide board has been installed, the level of the sea surface should be noted every hour or so for a period of two months. It should be recorded in a table together with the time, date and weather conditions.
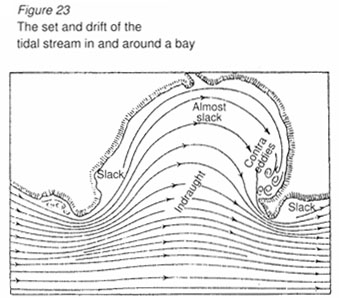
Tidal stream survey
The tidal phenomenon described above gives rise to tidal streams,
which are periodic horizontal movements of the water. In open
ocean this horizontal movement is either non-existent or very small.
In inshore and coastal waters, on the other hand, whenever there is
an appreciable vertical movement, a horizontal movement can also
be expected.
The main cause of tidal streams is a change in water levels. The
average velocity of tidal streams depends on the average height of
the advancing tide wave. In deep ocean this height is small so the
stream rate is either very feeble or very small. Where the wave
height is large the stream rate will be correspondingly great. When
a tidal stream meets an obstruction to its to-and-fro movement, its direction and velocity are affected. So, when a tidal stream meets a headland, it is deflected around it, and
usually immediately off the headland the tidal stream's velocity is
increased (Figure 23). Its direction is deflected round the headland
into the bay beyond, and this causes an indraught of indefinite
direction and velocity. The spreading out of the deflected tidal
stream, combined with the fact that its real strength runs from
headland to headland leaving comparatively unmoved water
between headlands, causes diminished velocity in the bay itself.
In the absence of tides, sea currents may be experienced during
sea storms. These currents, although not as strong as tidal streams,
should be observed closely because they usually carry weeds
uprooted from offshore areas.
Currents in general make navigation more difficult but not
impossible. When the currents bring with them seaweed or flotsam
(including timber and vegetation carried down by rivers),
navigation may be hindered by weeds fouling up propellers.
Flotsam, or floating debris, may also prove trouble-some if it is
piled up inside a harbour by a prevailing tidal stream or sea current.
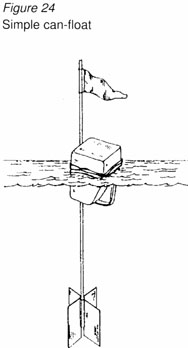
The strength of a current may be measured by timing it as it
travels a known distance along the coast, or across a bay. A simple
can-float with a counterweight hanging about 1 m below water
level (Figure 24), can be used to do this. When measuring currents
at sea, the following points should be observed:
When the currents are storm generated, what are the general direction and duration of the storm or incoming waves? If seaweed appears, after how many hours of storm does it make its first appearance?
- If flotsam or driftwood appear, where do they land? In many instances, one particular spot or bay may accumulate more debris than adjacent ones. Such spots or bays do not make good sites for harbours.
Wave height survey
The precise nature of the waves that occur on a particular stretch of
coastline can be investigated in three different ways:
- On-the-spot measurement by special electronic equipment called a wave-rider buoy. This can be hired for a set time, from a private company or government laboratory, together with a trained operator.
- Prediction by statistical methods on a computer using statistical models. This can be done if wind data are available for the area.
- On-the-spot observation by simple optical instruments such as the theodolite.
The first two methods give very accurate results but are very
expensive. These methods are usually reserved for big projects
where precise wave data is of the utmost importance.
The third method is not very accurate but is relatively cheap
and lies more within the scope of this booklet. The only differences
between this method and the first method are the observer and
recorder of data.
In the first method the observer is an electronic instrument that
can record continuously far out at sea where the waves are not yet
influenced by the coastline. In the last method, however, the
observer is a normal surveyor observing waves close to the
shoreline with a theodolite placed at a secure vantage point. The
wave heights thus recorded will be distorted and suitable only for
minor projects.
Setting up a wave observation point
The equipment needed to set up a wave observation point consists of
two large fluorescent plastic buoys about 500 mm in diameter (one
should be red and one white), a large stone or concrete sinker, a
length of 10-mm nylon rope, a theodolite, a compass and a watch
with a second hand or digital readout.
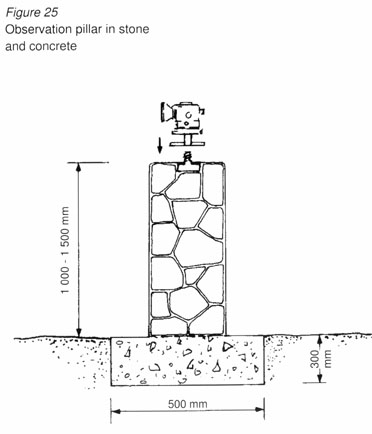
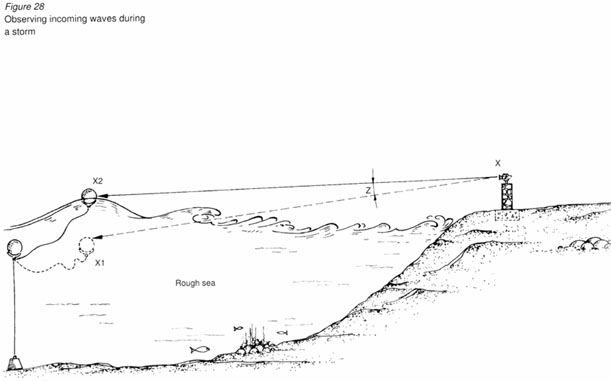
A vantage point that is just high enough above sea level to be safe and dry during a storm should be chosen. A stone pillar should be erected here with an anchor screw concreted in at the top. This is so that every time the theodolite is set up it faces the same way in exactly the same position (Figure 25).
The two fluorescent plastic buoys should then be moored a
known distance (say 100 m) offshore as shown in Figure 25. The
white buoy keeps the mooring line taut while the red buoy floats
freely on the incoming waves.
To calibrate the station, the theodolite should be pointed at the
buoy on a very calm day. A witness mark should then be placed on
something robust (a wall, for example, is preferable to a tree) so
that the observer can repoint the eyepiece of the theodolite at the
buoy in its rest position even when the buoy is bouncing up and
down with the waves during a storm.
In this way the theodolite is not tied up completely with wave
height observations but can be used for other work as well (Figure
26).
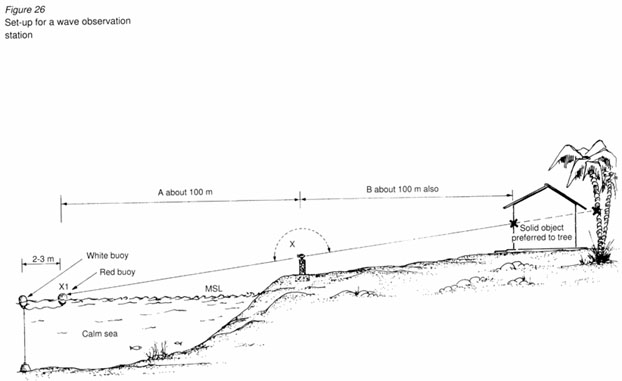
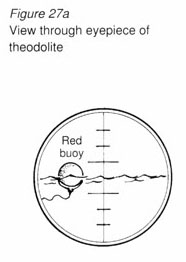
Figure 27a shows the view through the eyepiece of the theodolite
with the base of the buoy just above the central hairline in perfectly
calm conditions.
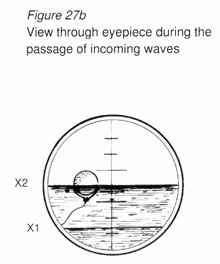
During a storm, the buoy will float up and down with the passage of the waves. By following the base of the buoy with the same central hairlines, the theodolite is made to traverse a small angle, Z, as shown in Figure 28. Using basic surveying principles, the distance between the theodolite and the buoy and the angle Z may be used to calculate the height of a wave. As a rule of thumb, a wave during a storm is twice the height of a wave in calm water. However, it must be emphasized that this calculation is very approximate and suitable for minor projects only. During wave height observations, the following additional information should also be recorded:
The direction of both the incoming waves and the wind. These can be taken by using a hand-held compass. The time difference between each successive wave peak. This is also known as the wave period and is measured using the second hand on a watch. The exact position of the buoy with respect to the coastline. The time of year when each storm was recorded.
As mentioned earlier, this method is suitable only for small projects where the anticipated financial outlay is very limited. The method has several drawbacks that may be summarized as follows:
The human observer can see waves during daylight hours only and this effectively reduces observation time by at least 12 hours a day. In very bad weather, strong winds and rain usually reduce visibility to only a few metres, making it difficult to keep the buoy under continuous observation. The presence of swell or long waves is very difficult to detect, especially during a local storm. This is because of the long time (15 seconds or more) between peaks.
Having completed the site survey, all the data collected
should then be put on a drawing with the help of a surveyor.
Chapter 9 describes some of the ideal scales for layout
drawings and some of the more common drawing conventions
used.
Ideally, the layout of the site should include the hydrographic
survey (in grid or contour form) and the area where the fishing
shelter will be situated.
All forms of access and all landmarks should also be plotted
on the layout. So should nearby utilities, such as fresh-water
wells, water pipes and electricity, if available.
The tide, tidal streams and wave data should be drawn up in
table form. Before embarking on the construction phase,
however, it would be a good idea to show the drawing to an
engineer from the public works office for comments and
suggestions.
![]()
![]()
![]()