Floodplain rivers are inhabited by an extremely wide diversity of different fish species. In the Indonesian archipelago, for example, up to 950 fish species live permanently or temporarily in fresh water (Kottelat et al, 1993). Individual river systems such as the Kapuas in West Kalimantan contain up to 185 different fish species (Dudley, 1996). From these multi-species fish stocks, about 25–30 common and economically valuable fish species are usually exploited by river fishing communities.
The fish populations in different Asian rivers are all broadly similar, containing several representatives of the (mostly herbivorous/omnivorous) Cyprinids, and the (mostly carnivorous) Silurid, Channid and Anabantid families. In terms of the number of species, the Cyprinids, perches and catfish dominate the catches.
As described in the last chapter, floodplain habitats experience a characteristic annual sequence of events. The biomass and production of most fish foods increases during inundation to give the main feeding season in the flood. Many floodplain fish have adapted to this cycle by spawning at the beginning of the flood, thereby placing their young on the floodplain at this time of plenty. The uncertainty over future water levels and the large number of predators gives strong selection pressure for rapid growth and early development (Lowe-McConnell, 1975).
The ecology of floodplain fish determines their vulnerability to the various types of fishing gears used in the floodplain and has strong implications for their management. This section firstly describes the life history characteristics of some representative species of Asian river fish; their migration and distribution patterns, and their growth, reproduction, and mortality. It then proceeds to examine the impacts of both fishing and floodplain modification on these stocks at the project study sites.
The simple fact that fish migrate - often unseen, in murky waters - makes them far harder to manage than trees, crops or other immobile natural resources. All river fish species migrate distances of at least a few kilometres, between appropriate habitats for feeding, reproduction and survival. Some fish migrate hundreds or thousands of kilometres up and down rivers making them vulnerable to many different fishing communities. Such fish movements determine how effective a fishing community will be in trying to manage a fish stock. ‘Fishery management units’, as discussed in Part 1, should be based on both the distribution patterns of fish and the spatial nature of fishing communities and existing management institutions. The seasonality of fish movements also determines the effectiveness of different fishing gears and the likely impact of different seasonal regulations. This section describes the seasonality and scales of movements shown by Asian fish species.
The distribution and migration patterns of floodplain fish species depend largely on their abilities to tolerate the extreme conditions which develop as the floodplain dries out. These may include low oxygen and pH levels, high temperatures or even a total absence of water in very dry years. Differences in the spatial distributions of floodplain fishes are most pronounced in the dry season, when two broad classes of fish may be distinguished (Welcomme, 1985):
| • Whitefish | ‘rheophilic’ flowing-water fishes, which are intolerant of severe environmental conditions, and emigrate from the floodplain back to the main river to survive the dry season; |
| • Blackfish | ‘limnophilic’ still-water fishes, adapted to survive the low oxygen conditions, which remain in the standing waters of floodplain over the dry season. |
Whitefish thus migrate on to the floodplain every year to take advantage of the good feeding available, but must return to the river due to their intolerance of the deoxygenated waters in the standing pools of the dry season. This has been termed a ‘lateral’ migration (Daget, 1960). Fish leave the drying floodplain in an ordered sequence of species with the least tolerant and often the larger/older fish emigrating first (Hoggarth and Utomo, 1994). In large river systems, many fish also migrate to optimal breeding habitats, usually upstream of the main floodplains so that developing fry drift downstream towards the best nursery areas. Such ‘longitudinal’ migrants include the Hilsa illisha shad in the middle and lower reaches of Bangladeshi rivers.
Blackfish, in contrast, may spend their whole lives in the standing waters of the floodplain and are particularly common in Asian inland waters. Many blackfish have some form of air breathing adaptation and some can survive in totally anoxic water. Most Asian blackfish have anatomical developments of their gills or branchial chamber: young Channa punctatus for example may surface to breathe up to 1,900 times per day. Most fish, including the Clariids and Heteropneustids, are still vulnerable to complete desiccation, but some fish, such as the Channid species can even survive short periods of total drought. These fish ‘cocoon’ themselves in the drying mud in a layer of hard slime with only a thin air passage to the surface to maintain oxygen exchange (see reviews in Lowe-McConnell, 1975 and Welcomme, 1985).
Fish migration studies - the R5953 tagging programme
The migrations of key fish species were studied by a tagging programme at the PIRDP and River Lempuing study sites of the ‘Fisheries Dynamics’ project. From totals of up to 92 different fish species recorded in catches at the study sites, the following six ‘key species’ were selected for the tagging study:
| Taxonomic group | Bangladesh | Indonesia |
| Carps | Catla catla (large, major carp) | Osteochilus hasselti |
| Puntius sophore (small barb) | ||
| Snakeheads | Channa striatus | Channa striatus |
| Catfish | Wallago attu | Mystus nemurus |
| Perches | Glossogobius giurus | Helostoma temmincki |
| Anabas testudineus | Anabas testudineus | |
| Shrimp | Macrobrachium rosenbergii |
These key species were selected for their medium large sizes (enabling the use of external tags), and for their high abundance (indicating their importance to the fisheries, and their potential for collecting large samples). The six Bangladesh key species, especially P. sophore and W. attu, were responsible for 35% of the 1995–96 catches at the PIRDP site. The six Indonesian key species contributed 48% of the total 1995–96 catches at the Lempuing site. The valuable shrimp M. rosenbergii has declined in abundance in the Lempuing, but was selected due to its previous economic importance. Anabas testudineus was selected at the Lempuing to make comparisons with the same species in Bangladesh, but proved too rare to produce useful results.
In the mark-recapture programme, fish bought alive from fishermen were tagged and released with small, individually numbered, plastic tags. Two tag types were used: 15 × 10mm anchor tags, and 42.5 × 2.5mm streamer tags. Both tag types were inserted through the dorsal musculature, passing between the anterior dorsal fin rays. The stiffer anchor tags were generally used for the larger fish species, A. testudineus, C. catla, C. striatus and W. attu (maximum size 73cm), while the more flimsy streamer tags were used for the smaller G. giuris and P. sophore and for small specimens of the other species (minimum sizes 4cm, see Halls et al, in press).
Fish for tagging were randomly selected from the catches of fishermen, and released between September 1994 and December 1996. A total of 4.618 fish was released in Bangladesh, and 3,712 in Indonesia. Releases were made in as many different locations around the study sites as possible. At the PIRDP, tagged fish were released both inside and outside the PIRDP embankment to determine the ability of fish to penetrate the sluice gates.
The mark recapture programme was supported by publicity activities at the study site, including posters, handouts and verbal announcements both in villages and at fishermen's meetings. To increase the tag return rate, a reward of 100 Taka (~, 1.60) was awarded for each tag returned, and a lottery was held at the end of the programme with a total of 16,000 Taka (~, 225) offered as prize money. When tagged fish were returned in addition to the tag itself, the market value of the fish was also paid.
Overall tag return rates varied from 7% for the small P. sophore up to 51% for the larger C. catla, and were consistently lower for the small fish tagged with streamer tags than for the larger ones tagged with anchor tags, probably reflecting both higher tag loss rates for the streamer tags, and higher tag-induced mortality rates for the smaller fish. The average time at liberty ranged between 9d for P. sophore and 46d for A. testudineus. The longest time between release and recapture was 263d for a tagged C. striatus.
The release and recapture locations of tagged fish, and the habitats occupied at the times of capture, were recorded as ‘location codes’. At the PIRDP, over 350 such codes were defined in advance of the programme by the project field staff, with reference to well-known landmarks such as schools, bridges, river confluence's etc. The actual positions of the location codes were quantified for mapping using a hand-held GPS meter. Location codes identifying floodplains and lakes covered an average area of 1.13km2, while those in secondary rivers and canals had an average length of 1.18km. The distances moved by migrating fish were calculated as the shortest straight lines between the centres of the release and recapture locations: no allowance was made for the actual likely routes of migration along the meandering river channels, or through nearest sluice gates etc.
Analyses of the mark-recapture data included both the seasonality and spatial aspects of the migrations of each of the key species, their relative migration scales and habitat preferences, and their abilities to migrate in or out of the PIRDP scheme. The seasonality of migrations was explored by examining subsets of data for those fish recaptured within the same month of, or the following month after, release. This approach effectively omitted information relating to those migrations indicated by recaptures two or more months after release for which the actual time of migration was least well known. Such reduced data subsets included 79% of all the recaptures, from 67% of the tagged A. testudineus up to 96% of the P. sophore.
Seasonality of fish migrations
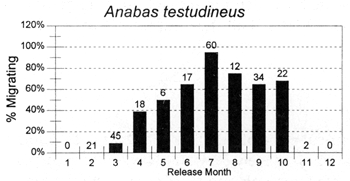
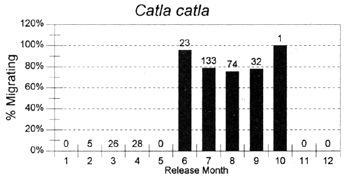
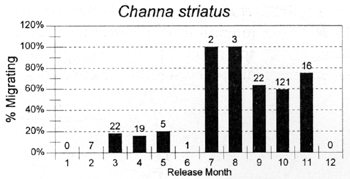
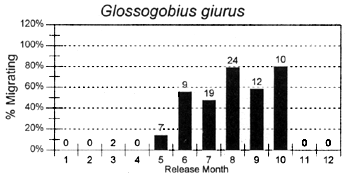
The migrations of fish are made in response to the annual cycle of flooding and drying. Floodplain lands at the PIRDP study site are inundated between approximately May and November each year: in the other months, water remains only in lakes, floodplain pools and river/canal sections, some of which become isolated from the main rivers (Figure 2.8; Halls et al, in press (b)). Reflecting the abundant presence of water over the flood season, the strongest migrations (the percentages of fish moving from their release locations) were seen for all of the key species in this season (Figure 3.1). In the dry season, only A. testudineus, C. striatus and P. sophore maintained significant migratory activity, mostly along river channels.
Scales of fish migrations
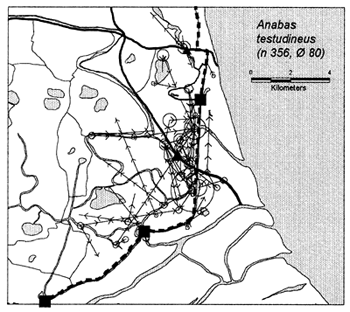
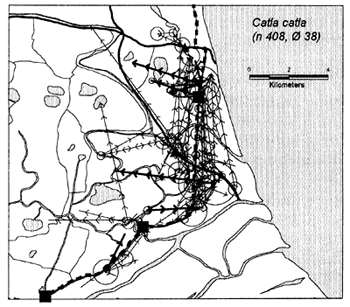
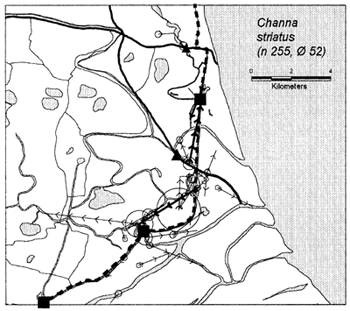
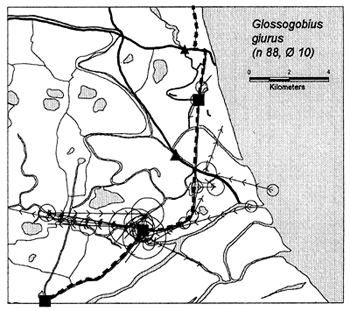
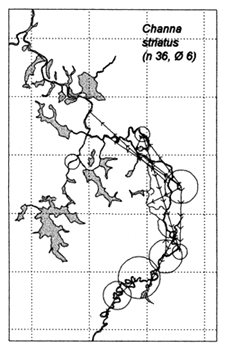
In the heavily exploited PIRDP fishery, most fish were recaptured within only one or two kilometres of their release locations, but all of the key fish species showed some ability to migrate significant distances (Figure 3.2). Between 2% (C. striatus) and 16% (G. giuris) of the tagged fish of each species were recaptured more than 2km from their release locations. The maximum (straight-line) migration observed in Bangladesh was 8.55km by a W. attu catfish. Longer migrations may have been achieved by tagged fish which migrated outside the study site, to be recaptured by fishermen unaware of the project. Relative migratory behaviour thus varied between the key species. As illustrated in Figure 3.3, similar percentages of each species migrated up to 2km, but 2–5 times as many C. catla, G. giuris and W. attu migrated distances between 2 and 5km, compared to the other three species.
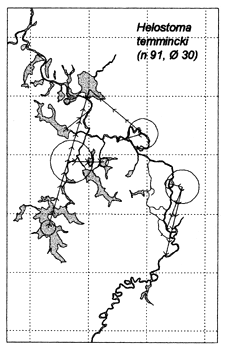
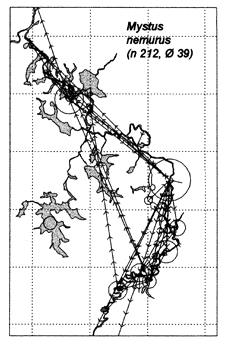
Similar results were obtained at the River Lempuing study site. All five of the Indonesian key species showed significant mobility, with some substantial migrations between different waterbody licensing units. The most migratory species were Mystus nemurus and Macrobrachium rosenbergii, both of which migrated along the full length of the 36km river section studied, and were also returned from waterbodies outside the study site (Figure 3.4 Figure 3.3). The longest recorded migration (measured in a straight line) was a downstream movement of over 18km for a M. rosenbergii prawn. The least migratory species was Helostoma temmincki, most recaptures of which were taken in the same waterbody as their release (only 16% of the 91 recaptures had moved). However, even this species occasionally migrated as far as 9km (Figure 3.4).
These results confirm two important factors. Firstly, it is evident that many floodplain fish do move between the spatial fishing units of different fishers or fishing villages (see Section 5.4.1). Such movements motivate fishers to catch as many fish as possible while they remain within their area of control. Secondly, it is clear that some fish migrate far more than others and will require different management units, as suggested in Part 1. The most migratory ‘whitefish’ species include C. catla, W. attu and G. giurus in Bangladesh and M. nemurus and M. rosenbergii in Indonesia. The least migratory ‘blackfish’ species include C. striatus, P. sophore, A. testudineus and H. temmicki.
Fish use different habitats as the flood cycle progresses, as necessary for their various life stages-most importantly for breeding, feeding and survival. Within a given season, blackfish and whitefish also use different habitats due to their variable tolerances of poor environmental conditions. Since fish may be widely distributed over the floodplain system, and in many different habitats, it is recommended that reserves designed to protect fish stocks should be placed in a variety of different habitats, and in different parts of the river system. One single reserve (even a large one) would not give adequate protection to all the species in a floodplain system.
 |  |
 |  |
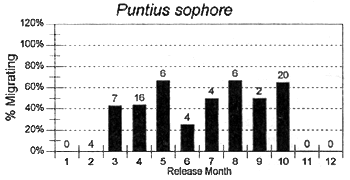 | 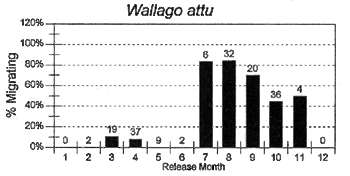 |
Figure 3.1 Percentages of tagged fish of each key species, released in each month, and subsequently recaptured in either the same or the next calendor month in a different location. Figures above bars indicate the total numbers of tagged fish recaptured within the same or the next calendar month as release (from Halls et al, in press (b)).
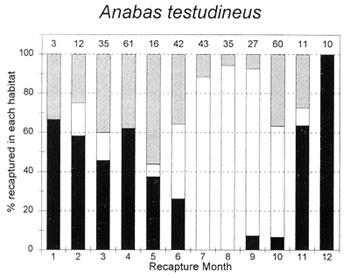
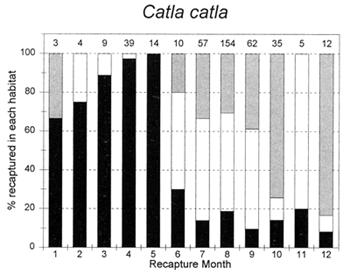
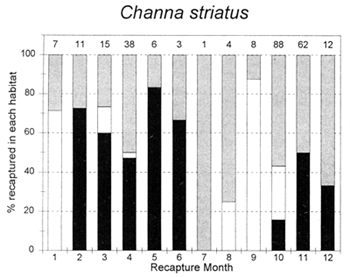
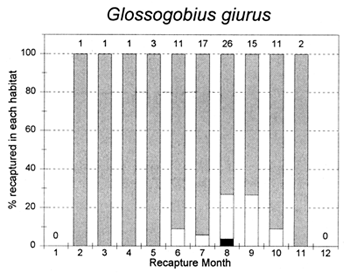
The habitat preferences of fish were studied by the Fisheries Dynamics project tagging programme, by recording the types of habitats in which tagged fish were recaptured. Habitat preferences varied between the key species, and between the different seasons. In the dry season, December to April, A. testudineus, C. striatus and W. attu were all found in both river and beel habitats, while C. catla mainly resided in beels and P. sophore and G. giuris were mostly found in the river channels (Figure 3.5). Those few fish reported as being captured in ‘floodplain’ habitats would actually have been taken in residual floodplain pools at this time of year.
 |  |
 |  |
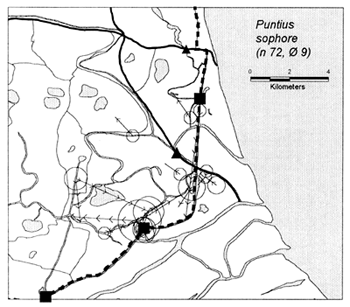 | 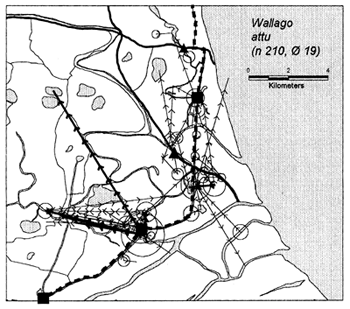 |
Figure 3.2 Recaptures of tagged fish of each key species at the Bangladeshi PIRDP study site. Lines with arrows connect the release and recapture locations of migrating fish; bold lines show fish which crossed the PIRDP embankment. Circles indicate fish recaptured at their release locations, with ø= number of fish indicated by the largest circle in each plot. n = total number of tag recaptures. Squares indicate the positions of the PIRDP sluice gates (see Figure 2.2) (from Halls et al, in press (b)).
In the flood season, May/June to November, all fish species were found in both river and floodplain habitats. Both A. testudineus and C. catla showed a particular preference for moving on to the floodplains at this time. In contrast, the highly migratory species, G. giuris was still especially recaptured in riverine habitats, while some of the C. catla and W. attu also remained in the deeper beel habitats (Figure 3.5).
The growth of tropical floodplain fish is both fast and strongly seasonal. Both feeding and growth are maximal in the high water season. In the Kafue River in Zambia, 75% of the first year's growth of Oreochromis species occurs during the 6 weeks of peak floods (Dudley, 1972, in Welcomme, 1985). In the Amazon floodplain, the mean weight increments of 12 species were 60% higher during the rising water period than during the remainder of the year (Bayley, 1988). It is this high productivity over the flood period which produces the abundant fish stocks and large catches of the drawdown and dry seasons. This section illustrates the fast and seasonal growth rates displayed by floodplain fish at the Asian study sites.
Methodology - growth rates from length frequency data
Growth patterns were studied for a range of key species using length frequency data, in both projects R4791 and R5953 (MRAG, 1994, 1997; Halls, 1998). In these projects, length frequency data were collected every other month from a number of different gear types, as seasonally available at different times of the year (see Section 4). Since no single gear type provided sufficient data to construct a full time series of bi-monthly length frequencies for any of the species, it was necessary to combine data across different gears in each sampling period to obtain enough data for the analyses. This procedure assumes that any observed differences among length frequencies collected from different gears in each bimonthly period reflects the seasonal variation in the size of fish as opposed to any selectivity characteristics of the gear. To maximise the validity of this assumption, only the samples from the least selective gear types were aggregated, with samples from gill nets, for example, being excluded from analyses.
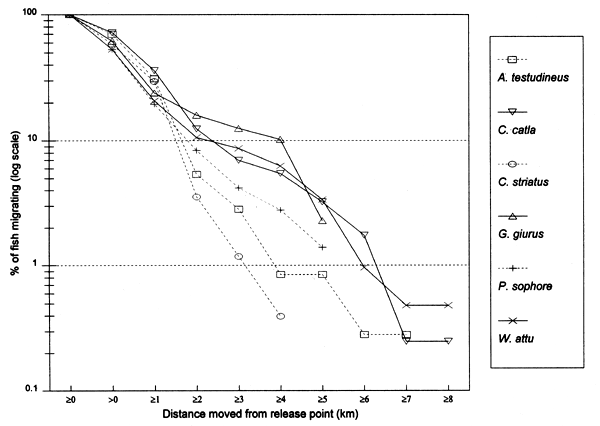
Figure 3.3 Percentages of tagged key fish species in Bangladesh, migrating at least the specified distances from their release locations (from Halls et al, in press (b)).
The growth of each species was analysed using the seasonal version of the von Bertalanffy growth function (VBGF) (Pauly and Gaschutz, 1979). This model allows for sinusoidal variation in growth rates throughout the year, as found in the floodplain environment. The parameters of the VBGF were estimated from the aggregated length frequency data using the Electronic Length Frequency Analysis method (ELEFAN; Pauly and David, 1981). This approach proved useful for the one-year time series collected in project R4791, but was more difficult to apply for the two-year time series of project R5953. For a two-year data set, the VBGF failed to adequately describe the growth of the key species due to variations in the timing of the flood seasons, and the resulting timing of spawning, recruitment and growth events. Since growth patterns differed between the two years, it was impossible to find a single growth curve which fitted the data well for both years (see also Section 3.4.1, and Halls et al, in press (a)).
Estimated growth rates
 |  |  |
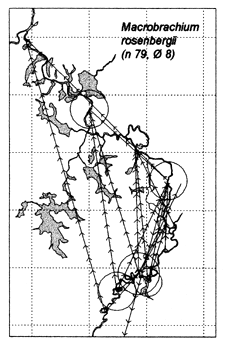 | 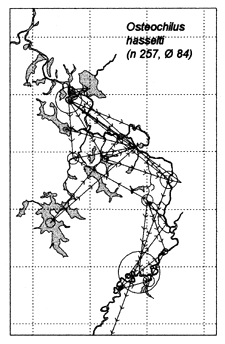 |
Figure 3.4 Recaptures of tagged fish of each key species at the Indonesian River Lempuing study site. Lines with arrows connect the release and recapture locations of migrating fish. Circles indicate fish recaptured at their release locations, with ø = number of fish indicated by the largest circle in each plot. n = total number of tag recaptures (from MRAG, 1994).
In both projects, the length frequency data clearly demonstrated the highly seasonal nature of floodplain fish growth (see example for Wallago attu in Figure 3.6; MRAG 1997 Halls et al, in press (a)). The length frequency distributions were nearly all dominated by a single mode or peak, which increased in mean length over the course of the year. In Bangladesh, the new fry of each species first appeared in samples taken in July, shortly after the time of floodplain inundation. The majority of the year's growth was then achieved over the high water period, between July and November. Very little growth occurred during the dry season, from November to April (Figure 3.6 Figure 3.9). Due to the high mortality rates in Bangladesh (see Section 3.2.5), very few fish remained in stocks at the end of their first year, when the next year's fry first appeared.
The key fish species studied varied in their maximum sizes from less than 10cm to over 120cm. Nearly all of these species, however, including the largest catfish and snakeheads, grew towards their asymptotic lengths very fast, at around 40–50% per year (VBGF growth parameter ‘K’ generally between 0.5 and 0.7; MRAG, 1994; Hoggarth and Kirkwood, 1994). A notable exception was the major carp Labeo rohita at the R4791 Hail Haor study site, which was found to grow at around half the rate of the other species studied (K = 0.3). Such slow growing species are usually best exploited by delaying or reducing exploitation below that of the other fish, until they have grown to a reasonably large size (Section 5.2).
 |  |
 |  |
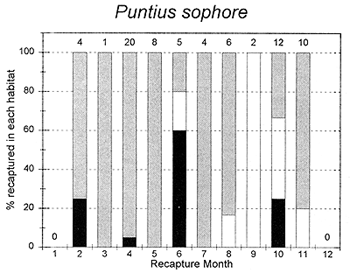 | 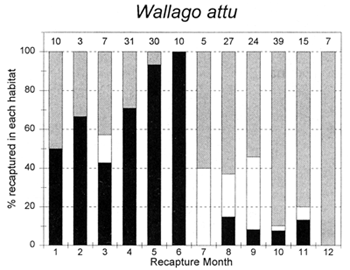 |
Figure 3.5 Percentages of tagged fish of each key species at the PIRDP study site, recaptured in each month, in river/canal habitats (dark grey bars), floodplain habitats (light grey bars, including dry season pools), and ‘beel’ lake habitats (black bars). Figures above bars indicate the total number of recaptures (from Halls et al, in press (b)).
Variability in growth
The growth of floodplain fish can vary significantly between years. These variations have been correlated with flooding intensity and duration, and temperature during the dry season (Dudley, 1972; Kapetsky, 1974). During exceptionally poor flood years in the Senegal river system, Citharinus citharinus grew to less than 50% of its normal size and failed to reach sexual maturity, resulting in recruitment failure (Welcomme, 1985). The influence of flooding on fish growth rates at the PIRDP study site is demonstrated in Section 3.4.1. Fish populations at this site are almost entirely comprised of fish less than one year old (Section 3.2.5), which reach maturity at the end of their first year (Section 3.2.4). While multi-aged fish stocks can survive occasional breeding failures, they are potentially far more dangerous for such short lived species.
Density dependence of growth
Project R5953 found that the growth of several of the key species in the 1995 flood year was faster inside the PIRDP than outside - a result best explained by variations in fish densities (see Section 3.4.1). To quantify this result for the detailed modelling of the hydrological impacts of fish production potential, a collaborative pond experiment was undertaken at the Bangladesh Agricultural University, Mymensingh during the 1996 flood season (MRAG, 1997, Appendix F; Halls, 1998).
Briefly, this experiment confirmed that the growth of the key species P. sophore was highly dependent on its biomass density, with growth being limited by competition for food resources. Growth was highly responsive to pond conditions, presumably reflecting an adaptation to the unpredictable conditions of floodplain river systems. Under favourable conditions with low densities and high primary productivities (in the most fertilised ponds), recently spawned P. sophore were able to grow to sexual maturity and spawn within only 12 weeks of hatching! These results demonstrate the enormously high potential productivity of small species such as P. sophore, especially when reduced to very low numbers, either by fishing or natural hydrological conditions.
The reproductive strategies of fish, particularly the age and time at which they spawn, coupled with their mortality rates, determine how many fish survive to mature and reproduce next year's fish. In the strongly seasonal floodplain environment, reproduction must be well adapted to environmental conditions to ensure that enough eggs are released at the right time to take advantage of seasonal opportunities for feeding and growth. This section illustrates the reproductive dynamics of the key species studied at the PIRDP site in Bangladesh. It is shown that all five of the key species studied2 reach sexual maturity by the end of their first year of life ready to spawn at the start of the next flood season.
2 Most of the C. catla sampled were immature, preventing reliable analyses for this species.
Age and length at maturity
The mean length at maturation for each key species (males and females) inside and outside the PIRDP flood control scheme was estimated from the length at which half the sampled individuals were sexually mature (Lm50), as fitted using the logistic function (see Halls et al, in press (a)).
As shown in Figure 3.7 and Table 3.1, mean lengths at maturity varied between the sexes for four of the five species studied, excluding only W. attu. Mature males of the most sexually dimorphic C. striatus and G. giuris were approximately 30% and 100% larger then females respectively. The average size of maturity for male A. testudineus was slightly larger than that of the females. For P. sophore, length at maturity for females was marginally larger than for males.
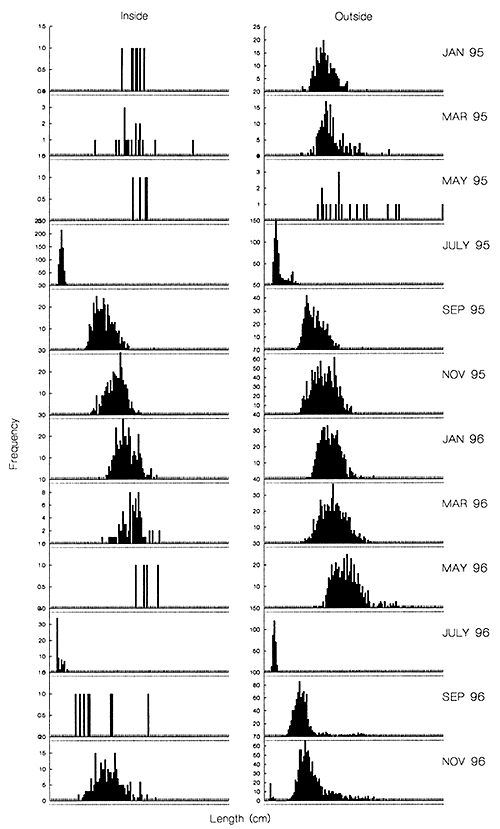
Figure 3.6 Bi-monthly fork length frequencies of Wallago attu, combined across non-selective gear types, in the Inside (‘modified’) and Outside regions of the PIRDP study site. X-scale = 0–127cm in 1cm classes (from Halls et al, in press (a)).
Table 3.1 Estimated mean lengths at maturity (Lm50, in cm, with sample sizes in parenthesis) for key fish species at the PIRDP study site (from Halls et al, in press (a)).
| Species | Female | Male | ||
| In | Out | In | Out | |
| A.testudineus | 11.5 (341) | 11.5 (166) | 12.5 (200) | 13.5 (99) |
| C.striatus | 29.0 (162) | 30.5 (148) | 37.5 (198) | 39.5 (157) |
| G. giuris | 10.5 (155) | 9.0 (206) | 22.0 (182) | 19.5 (278) |
| P.sophore | 6.0 (430) | 6.0 (386) | 5.5 (138) | 5.5 (108) |
| W.attu | 60.0 (112) | 54.0 (218) | 56.0 (87) | 54.0 (187) |
Comparing these maturity data with the observed patterns of growth discussed in the previous section, it was found that all the key species studied were able to reach sexual maturity by approximately the end of their first year. W. attu, for example mature at between 54 and 60cm (Table 3.1) at about the length they have achieved by the month of May at the end of their first year (Figure 3.9)
Seasonality of spawning
Spawning patterns in fish are commonly defined by changes in gonadosomatic index (GSI) (Welcomme, 1985; Wooton, 1990), which is a measure of the relative size of the gonad with respect to total body (somatic) weight:
GSI (%) = gonad weight / total body weight × 100
Increases in GSIs during the reproductive cycle reflect the growth of developing eggs in female fish. Mean GSI is highest just prior to spawning, after which it declines as more of the population comprises spent females.
Changes in mean monthly GSIs for female fish, with 95% confidence intervals, for each of the key species in the two PIRDP sampling locations are illustrated in Figure 3.8. The GSI data showed that A. testudineus, C. striatus, P.sophore and W.attu all have discrete, relatively short breeding seasons (May – June) coinciding with rising water levels. In a number of cases (A.testudineus, outside, 95/96; C.striatus, outside, 95/96; P.sophore, outside, 95/96, and inside, 96/97; and W.attu, outside, 95/96), maximum spawning activity was seen to coincide closely with the actual time of floodplain inundation when flood levels reached full bank height.
The small cyprinid, P. sophore, showed extended spawning both inside and outside the PIRDP flood control scheme. As indicated in the previous section, this small, fast growing species may grow to maturity and spawn more than once in each flood season. Spawning seasonality is less pronounced in G.giuris (Figure 3.8) though the trend in the data suggests that spawning activity is concentrated during the higher water periods between July and August, rather than during the rising water period.
The long-term survival of floodplain fisheries depends on the continued success of spawning and the subsequent ‘recruitment’ of young fish to the exploited stocks. As reported in the last section, spawning is generally an annual event in floodplain stocks, occurring at the start of the flood. Continued recruitment is thus critically dependent on the survival of enough fish through the dry season to contribute to the spawning stocks at the start of the next year.
Mortality in exploited fish populations is due to both fishing and natural causes. Causes of natural mortality in floodplain fish populations include stranding in isolated pools, or other extreme abiotic conditions such as high temperatures or low dissolved oxygen concentrations particularly for the whitefish species not adapted to cope with them (Section 3.2.5; Welcomme, 1985; 1989; Halls, 1998).
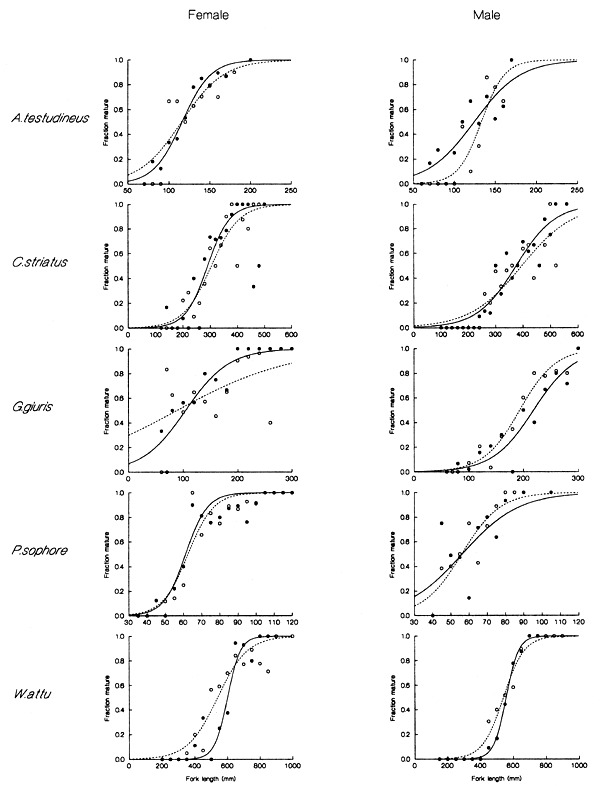
Figure 3.7 Fraction of mature male and female fish of each key species plotted against their lengths. Solid circles and solid lines, and open circles and broken lines indicate data and corresponding logistic model fits, for fish sampled from inside and outside the PIRDP, respectively (from Halls et al, in press (a)).
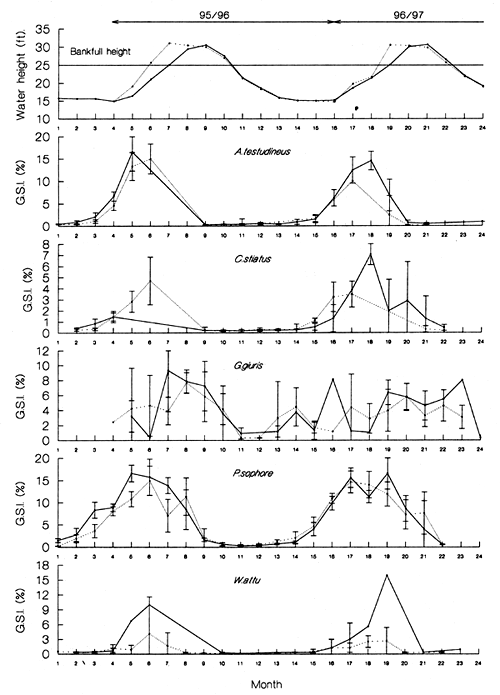
Figure 3.8 Changes in the mean monthly gonado-somatic index (GSI) with 95% confidence intervals for sampled female A. testudineus, C. striatus, G. giuris, P. sophore and W. attu from inside (solid line) and outside (broken line) the PIRDP during the 24 month sampling period (January 1995 to December 1996). Where no confidence interval is shown, only one fish was sampled. The top plot shows the changes in mean monthly water height (ft) inside (solid line) and outside (broken line) the PIRDP at Talimnagar sluice (from Halls et al, in press (a)).
Such fish kills are only rarely observed at the project sites, where predation is believed to be the major cause of natural mortality. Fishing mortality is of course extremely high at the project sites, due to the multitude of fishing activities (see Chapter 5): the absence of mortality due to stranding may be partly because the fish are usually removed from the waterbody before such dry conditions arrive.
The major factors influencing mortality rates - fishing, abiotic factors and predation - vary strongly with the flood cycle, intensifying during the drawdown and with the progression of the dry season (Welcomme, 1985, 1989; Halls 1998). During this time, fish become concentrated in channels or pools, as water recedes from the floodplain. These periods of high concentrations or densities of fish, with high catchability (‘q’), are exploited by both fishermen and other predators (see Section 4.2; Welcomme, 1985; MRAG, 1994; Halls, 1998). Abiotic conditions are also likely to reach extremes during this period leading directly, or indirectly, through greater vulnerability to disease and predation, to increased mortality rates. Conversely, during the high water period, the floodplain offers abundant food resources, space to escape from predators, tolerable abiotic conditions and low fish densities. Mortality rates during the flood period are thus assumed to be low (Halls, 1998).
The overall mortality rate arising from the various density-dependent and seasonal natural and fishing mortalities has strong implications for the sustainability and management of these fisheries. The following sections briefly examine the overall mortality rates seen at the study sites, and then proceed to discuss the relative contributions of both fishing and natural effects on the total mortality rates observed. A final section investigates the habitats in which fish currently survive the dry seasons, which may provide valuable opportunities for management interventions intended to improve fish survival.
Methodology - total mortality rates from length frequency data
Total annual instantaneous mortality rates, Z, were estimated in both projects R4791 and R5953 from unaggregated length frequency data, collected for each key species from individual low selectivity gear types, such as de-watering, katha brush piles, kua pits, small mesh seines and traps (see MRAG, 1994, 1997; Halls et al, in press (a)).
Gulland and Rosenberg (1992) reviewed length based approaches to estimating mortality rates, and concluded that, for the pattern shown in the length frequencies by most of the key species, ie a single mode for the majority of the year with a progressively increasing mean length (Type B distribution, based upon the classification of Shepard et al, 1987), Z is most reliably estimated using distributions which show two clear modes assumed to represent numbers of new recruits (Nt) and relative numbers of survivors from the previous year's recruitment (Nt+1). By distinguishing two such modes, Z may be estimated as:
Z = -In (Nt+1 / Nt)
This method assumes ‘steady state’ population dynamics, that is, that recruitment and mortality are both constant in the two years compared. It also assumes that the length frequency samples are representative of the true population size structure. To maximise the latter assumption, only samples which exhibited a clearly bimodal pattern coinciding with the overall growth pattern were included in the analysis. Where modes were overlapping, numbers in each mode (cohort) were estimated using the NORMSEP (Hasselblad, 1966), normal distribution separator routine of the FISAT programme (Gayanilo et al, 1996; Halls, 1998).
Estimates of total mortality and survival rates
At the PIRDP site, 64 individual estimates of Z were calculated from the 402 length frequency distributions examined (see Halls, 1998 for individual estimates), including 30 from inside the PIRDP flood control scheme, and 34 from outside. Most of the estimates (45) were derived from length frequencies collected from de-watering, katha, kua, lift and seine net gears. There were no obvious differences in the types of gear for which estimates were derived between the two sampling locations. Those distributions for which no estimate could be made either contained two few fish to detect reliable modes, or simply comprised a single mode. Since the many samples comprising a single mode indicate infinitesimal mortality (on an annual basis), the average mortalities from the 64 bimodal distributions should be interpreted as a lower limit to the true mortality rates.
Table 3.2 Estimates of mean total mortality rate z for key species inside and outside the Bangladesh PIRDP study site, with probability (p) of no difference between the two regions. Due to the absence of significant (p > 0.05) differences in mortality rates between regions, estimates of Z from both locations are pooled to give an overall and equivalent mean survival rates S (%), with 95% confidence intervals. Numbers in parentheses give sample sizes (from Halls et al, in press (a)).
| Species | Z | Z1 ≠ Z0 | Z combined inside and outside | ||||||
| Inside | Outside | p | Z | Zlower | Zupper | S (%) | Slower (%) | Supper (%) | |
| A.testudineus | 3.4 (5) | 4.5 (1) | NA | 3.5 | 2.7 | 4.3 | 3 | 1.3 | 6.7 |
| C.catla | 4.0 (4) | 5.7 (3) | 0.11 | 4.7 | 3.4 | 6 | 0.9 | 0.2 | 3.3 |
| C.striatus | 3.6 (4) | 4.1 (6) | 0.62 | 3.9 | 3 | 4.7 | 2 | 0.9 | 4.9 |
| P.sophore | 2.5 (10) | 3.7 (12) | 0.06 | 3.2 | 2.5 | 3.9 | 4 | 2 | 8.2 |
| W.attu | 3.5 (3) | 3.7 (11) | 0.78 | 3.7 | 3.1 | 4.2 | 2.5 | 1.5 | 8.2 |
The estimates of Z for individual gear and month/year combinations ranged between approximately 2 and 6, with only 4 estimates below 2 and only one estimate above 6. This observed range is equivalent to between only 14 and 0.4% survival per year. Mean Z estimates, for each species and sampling location, were higher outside the PIRDP scheme compared to inside, though not significantly so in any case (Table 3.2). Due to the absence of significant differences in between the two sampling locations, estimates for Z from both sampling locations were pooled, to give an overall mean value for each species. Total mortality rates were thus seen to be highest for C. catla (' 4.7) corresponding to a survival rate of just below 1%. The remaining species show marginally lower mortality rates between 3.2 for P. sophore and 3.9 for C. striatus, equivalent to between 4 and 2% survival respectively (Table 3.2).
Longevity
With such low survival rates, fish populations at the PIRDP study site in Bangladesh are virtually annual, and must be supported mainly by their ability to mature and spawn by the end of their first year. In these fish stocks, recruitment failure due to excessive fishing mortality or failure to reach sexual maturity due to poor growth could be extremely dangerous (Halls, 1998).
The approximate longevity of the key species at each study site could also be viewed directly in the length frequency data, by following the age classes of fish from their initial recruitment through the subsequent bi-monthly samples (MRAG, 1994; 1997). From the general unimodality of the length distributions in Bangladesh, it is clear that nearly all of the Bangladesh key species only survive in significant numbers up to their first birthday (see e.g. Figure 3.6).
In Indonesia, mortality and survival rates were not calculated. However, in contrast to Bangladesh, far more of the length frequency distributions for the key fish species3 showed more than one mode, indicating that significant numbers of fish do survive into their second year (see e.g. Figure 3.9 for Mystus nemurus; MRAG, 1997). The September 1994 length frequency distribution for Mystus nemurus even indicates that the largest sampled Indonesian catfish had probably survived to almost three years of age (Figure 3.9 Figure 3.6).
| Fishing mortality rates |  |
| Relative indications of fishing mortality rates are available for the two R5953 project study sites from the tag return rates achieved in the mark-recapture programme. The overall tag return rates reflect the fishing mortality rates, but do not give actual estimates because some tags become missing due to both tag-induced mortality and tag losses from fish after release. Recapture rates also vary seasonally, being particularly high when fish become fully enclosed in dry season waterbodies. Overall recapture rates then depend on the seasonality of tag releases, which varied due to availability, both between species, study sites and years (see MRAG, 1997; Halls et al, in press (b)). The application of rigorous tagging models developed for such situations (see Seber, 1982) are difficult to apply to the floodplain study sites due to their open situation, with possible immigration and emigration of fish. Tag recapture rates are thus compared as simple indications of the lower limits of relative fishing mortality rates. | |
| Comparing the two study sites is further complicated by the facts that different selections of species were used in each, and that different field staff did the tagging work (who's practices may have differed slightly, influencing tag losses and tag-induced mortality rates), and finally that different fishermen caught and returned the tags. As noted in Section 3.2.1, two different tag designs were also used in both countries, with the less recaptured streamer tags being most used for the smaller individuals and the smaller species including H. temmincki and O. hasselti in Indonesia, and G. giurus and P. sophore in Bangladesh. | |
| Figure 3.9 Bimonthly fork length frequencies of the catfish Mystus nemurus, combined across nonselective gear types at the River Lempuing study site, with an approximate growth curve fitted ‘by eye’ (X-axis scale = 0–55cm; from MRAG, 1997). |
The most comparable overall tag recapture rates from the well-recaptured anchor tags only, for the full two-year study periods, are shown below in Table 3.34 (sample sizes and seasonality of recaptures are given in MRAG, 1997 and Halls et al, in press (b)):
Table 3.3 Tag recapture rates for anchor-tagged key species in Bangladesh and Indonesia (project R5953, from MRAG, 1997 and Halls et al, in press (b)).
| Taxonomic Group | Bangladesh Species | Recapture Rate | Indonesia Species | Recapture Rate |
| Carp | C. catla | 51% | O. hasselti | 24% |
| Snakehead | C. striatus | 46% | C. striatus | 11% |
| Catfish | W. attu | 36% | M. nemurus | 33% |
| Perch | G. giurus A. testudineus | 44% 47% | H. temmincki A. testudineus | 16% 6% |
With up to 51% of tags returned to the project, these recapture rates indicate that fishing mortality must be extremely high in both the study sites. Studies of fish species in coastal systems, using similar tag designs (e.g. Buxton and Allen, 1989; Bryant et al, 1989, Funicelli et al, 1989) usually do not achieve recapture rates above 2–3%!
Two key species were selected for study at both the Bangladesh and Indonesia sites: A. testudineus and C. striatus. The recapture rates of these species indicate that fishing mortalities may be up to four to eight times greater in Bangladesh than in Indonesia for these species. This result may be unreliable for the smaller A. testudineus, though, as this species was only included at the Indonesian study in the second study year, and only 67 releases were made due to its low availability. The comparison for C. striatus still indicates a four-fold difference between the sites.
Of the other species, the strongly migratory major carp, C. catla was most recaptured in Bangladesh, confirming its high total mortality rate, as also observed in the preceding section. The smaller Indonesian cyprinid, O. hasselti shows only half the recapture rate of Bangladeshi C. catla. Similarly, the Indonesian H. temmincki was recaptured less than half as well as the Bangladeshi goby G. giurus. In contrast, the strongly migratory Indonesian catfish M. nemurus was recaptured by the Indonesian barrier traps (see Chapter 5) almost as much as the Bangladeshi catfish W. attu.
Natural mortality rates
Rates of natural mortality ‘M’ were estimated in project R4791 using a modification (Trenkel, 1993) of Pauly's (1980) predictive model based on the VBGF parameters and ambient water temperatures (see MRAG, 1994; Hoggarth and Kirkwood, 1994). These estimates of natural mortality ranged from M = 0.6 for the large, slow growing Labeo rohita to M = 1.5 for the smaller, fast growing P. sophore. As expected, the confidence intervals for M from this method were all wide, at up to 50–60% above or below the central estimate.
The natural mortality rate of P. sophore at the PIRDP site in Bangladesh was studied in more depth during both field-based and pond experiments by project R5953 (MRAG, 1997; Halls, 1998). At the fish densities observed in the field - up to 10 P. sophore / m3 - natural mortality levels were found to be up to M = 0.05 per week, during the dry season period. Extrapolating this rate to the whole 20 week dry season, the P. sophore stock would have experienced an overall mortality of M = 1.0, equivalent to a survival rate of 37%. Compared to the total mortality estimate of Z = 3.2 (4% survival per year), it is evident that fishing in Bangladesh is by far the greatest cause of fish mortality.
Key habitats for fish survival
With such high fish mortalities, it is important for fishery managers to know where fish currently survive over the dry season. Further increases in mortality in such key habitats could be extremely threatening to the long-term productivity of the fishery. Key habitats used by fish for dry season survival were thus investigated at the PIRDP study site by project R5953 (see also Section 3.2.2). Supporting data was also provided by the tagging programme at the River Lempuing as reported below.
PIRDP fish catches were studied in each of the different waterbody types - beels, river sections and three types of kua pits - over the duration of the whole 1995/96 dry season. The ‘escapement’ of fish in the dry season waterbodies was estimated as the weight of fish not caught over the dry season which thus survived to form the spawning stock for the next year. Escapement was estimated using the ‘Leslie’ depletion model (Seber, 1982), which in its simplest form regresses fish abundance, as measured by catch-per-unit-effort (CPUE) data, against the cumulative catch (Hoggarth et al, in press (b)).
Fish catch rates (CPUEs) from the dry season waterbodies generally declined over the months, as fish stocks became depleted by fishing and natural mortalities (effort and CPUE data in MRAG, 1997). In 18 of the 28 monitored waterbodies, the last gear to be used in the dry season was de-watering, either by diesel pump or by hand. For these waterbodies, it was assumed that all the fish were fully caught so that escapement was zero5. Six of the 28 waterbodies studied were estimated to have allowed some escapement of fish. Of the other 4 waterbodies, one beel was de-watered to provide irrigation water, and three other waterbodies had insufficient data to use the Leslie method (Hoggarth et al, in press (b)).
Total escapement in the inside and outside regions was then estimated by raising the escapement within the 28 waterbodies to the total numbers of waterbodies in each regions. Though very approximate, these escapement estimates suggest that less fish survive over the dry season inside the PIRDP scheme than outside. All of the surviving fish were contained in the perennial beel and river waterbodies, and the abundant floodplain kuas. No fish were estimated to have survived over the whole dry season in the small household kuas or the river kuas (Table 3.4). Expressed as fish densities per unit of high water floodplain area, the numbers of fish escaping the fishery are extremely low, between 0.07 and 0.43kg/ha. Expressed as densities per unit of dry season water area, the fish numbers are still low overall (1.08–4.94kg/ha), though the floodplain kua waterbodies contain particularly dense concentrations of fish due to their small sizes.
The proportional survival rates over the dry season period were calculated as the escapement divided by the estimated initial populations, also given by the Leslie method. With such figures based on weights rather than numbers, the estimates assume zero growth during the dry season, and also assume zero natural mortality in the days after the end of the fishing activities. For 18 of the waterbodies, it was assumed that no fish survived due to the use of de-watering or the natural drying of the ponds. For the six waterbodies in which some fish did escape the fishery, dry season survival rates varied between 1.6 and 21% (median 4%), equivalent to instantaneous total mortality coefficients of Z = 4.11 to 1.55 (median Z = 3.14).
The overall proportional escapement was also calculated from the total escapements (Table 3.4) and the total catches (see Hoggarth et al, in press (b)), as 0.54–1.9% inside the PIRDP scheme and 0.6% outside (Z = 5.2 to 4.0). These figures also take account of those waterbodies with zero escapement, and should provide a better indication of the overall dynamics of Bangladeshi floodplain fish stocks. They provide good support for the mortality rates estimated (as lower limits) in the previous section from the length frequency data.
The numbers of fish species in the catches from dry season waterbodies was higher in the larger, permanent beel and river waterbody types than in the kua waterbodies. The smallest household kuas were the least species rich of all the waterbodies. The number of fish species in dry season waterbodies also invariably declined as the season progressed (Table 3.5), presumably as the least common species became fished out, or as the non air-breathing species died in the deoxygenated conditions. In five of the six combinations of waterbody type and season in which data were available, fish communities were richer outside the PIRDP scheme than inside (Table 3.5).
Table 3.4 Estimated escapement (kg/ha) of fish at the end of the dry season, inside and outside the PIRDP flood control scheme (from Hoggarth et al, in press (b)).
| Waterbody Type | Escapement Inside PIRDP | Escapement Outside PIRDP | ||
| Kg/ha of total high water flooded area | Kg/ha of dry season water area | Kg/ha of total high water flooded area | Kg/ha of dry season water area | |
| Beels | 0 | 0 | 0.12 | 9.17 |
| Rivers | 0.05 | 10.23 | 0.04 | 3.69 |
| Floodplain Kuas | 0.03–0.23 | 6.49–51.94 | 0.27 | 180.7 |
| River Kuas | 0 | 0 | 0 | 0 |
| Household Kuas | 0 | 0 | 0 | 0 |
| All habitats | 0.07–0.27 | 1.08–4.00 | 0.43 | 4.94 |
This suggests that the diversity of fish stocks inside the PIRDP could be supported by opening the sluice gates as much as possible to maintain the access of fish from outside the scheme (Halls et al, in press (b); Hoggarth et al, in press (b)). Only the beel fish communities comprised more species inside the scheme, reflecting the large beel habitats available in the inside region (MRAG, 1997).
Evidence of variable survival rates for fish in different habitats was also seen from the tagging data from the Indonesian River Lempuing. With average tag return rates of only 8%, fish survival in the Indonesian lake district region6 may be more than three times higher than in some of the riverine waterbodies (Table 3.6). Within the riverine habitat, almost twice as many tags were also returned from the upstream forest river region (27%), as in the downstream savanna river region (14%). As found in Bangladesh, these results further suggest that the wider, deeper river sections (downstream), produce better conditions for the survival of fish against fishing pressures.
Summary and comparison of mortality rate studies
The above studies have shown that mortality rates are enormously high for floodplain fish, and significantly different between Bangladesh and Indonesia, though not different inside and outside the PIRDP flood control scheme.
At the Bangladeshi study site, total mortality rates were such that only up to 1–4% of the fish of each key species survived between years. In the dry season waterbodies, only 0.5–1.9% of fish survived over the dry season to spawn next year. This suggests that most of the mortality does occur over the dry season period. As a result of such high mortality rates, the Bangladesh stock was comprised almost entirely of fish less than one year old.
In contrast, at the Indonesian site, more fish were seen to survive into their second year, and the tag recapture data showed that fishing mortality rates for some key species could be up to four times lower than in Bangladesh. Other species, including the most migratory M. nemurus and M. rosenbergii were, however, both highly exploited by the barrier traps in Indonesia, though still less than equivalent species in Bangladesh.
Overall tag recapture rates indicate the lower limits to fishing mortality rates, since tag losses and tag-induced mortalities reduce the number of tagged fish actually available for recapture. The tag recapture rates of 36–51% in Bangladesh, and their correlation with the estimated total mortality rates (both being highest for the migratory C. catla), imply that fishing is the major component of the very high mortality at this site.
Table 3.5 Total numbers of fish species recorded in catches from dry season waterbodies in the early (November to March) and late (April and May) dry season, inside and outside the PIRDP flood control scheme, by waterbody type (‘-’ indicates zero catches or missing species composition data; from Hoggarth et al, in press (b)).
| Waterbody types: | Beels | River Sections | Floodplain Kuas | River Kuas | Household Kuas | Total | |
| Inside PIRDP | |||||||
| Early dry season | 48 | 52 | 37 | 30 | 27 | 56 | |
| Late dry season | 34 | 32 | 18 | - | - | 43 | |
| Outside PIRDP | |||||||
| Early dry season | 43 | 59 | 41 | - | 36 | 63 | |
| Late dry season | 36 | 35 | - | - | 21 | 48 | |
Table 3.6 Percentages of tagged fish recaptured in different habitat regions at the Indonesian River Lempuing study site, suggesting variations in fishing mortality between habitats (project R5953; summarised from MRAG, 1997).
| Fish Species | Number of tag releases (n), and %s recaptured from each region: | |||||
| Forest River | Lake District | Savanna River | ||||
| n | % | n | % | n | % | |
| A. testudineus | 0 | - | 0 | - | 91 | 4.4% |
| C. striatus | 132 | 15.2% | 32 | 3.1% | 187 | 5.9% |
| H. temmincki | 0 | - | 385 | 9.9% | 341 | 14.4% |
| M. nemurus | 282 | 29.8% | 24* | (25.0%) | 404 | 23.0% |
| M. rosenbergii | 162 | 25.9% | 0 | - | 121 | 17.4% |
| O. hasselti | 435 | 28.9% | 323 | 5.3% | 793 | 11.7% |
| All species | 1011 | 26.8% | 764 | 8.1% | 1937 | 14.0% * |
M. nemurus are not commonly found in the lake region. Tagged M. nemurus released in the Lake region were transported in from the riverine regions. Their relatively high recapture rate for this region may thus be due to their abnormal behaviour patterns.
In comparison to these very high rates of total and fishing mortality, natural mortality rates, studied in field and experimental conditions for the most abundant Bangladeshi species, P. sophore, were relatively low. Though still high compared to other resource systems at approximately M = 1.0, natural mortalities were such that 37% of the P. sophore proved capable of surviving over the full dry season period, at the densities observed in the field. This suggests that restraints on dry season fishing could significantly increase the numbers of fish contributing to the recruitment of fish stocks in the following year. Though it is difficult to quantify this prediction due to multi-species effects and density dependent processes, simulation modelling by Halls (1998) has indicated that a sacrifice of a few tonnes in the dry season catches could easily double the pre-spawning stock at the start of the next flood.
Supporting studies on the habitats used by fish to survive the dry season indicated that most fish currently survive in the largest waterbodies such as beels, lakes and the deeper floodplain kua pits and river sections. Fishing is presumably harder in such habitats since the fish can not be so easily enclosed by gear types such as seines or fish drives. To maintain the fishery, managers should ensure that such habitats are not fished out by poisons or other totally extractive fishing methods. Such habitats may also provide the best locations for reserves, since good water quality is most likely to be maintained over the full dry season in larger waterbodies.