![]()
![]()
![]()
Production and production systems
Constraints and factors influencing production in tropical Africa
Nutritional and economic contributions of livestock
Projections and key constraints
References
H. E. JAHNKE, G. TACHER, P. KEIL and D. ROJAT
Tropical Africa is defined as sub-Saharan Africa excluding the South African Republic. It covers 23 million km2 of which 9.5 million (40%) are infested by the tsetse fly.
Here we will particularly emphasize ruminant species such as cattle, sheep and goats as they play the major role in livestock production and are the species mainly affected by trypanosomiasis.
Livestock populations and productivity
Table 1 shows the population sizes of the livestock species, both in numbers and in "tropical livestock units" (TLU).1 One hundred and sixty-one million cattle and 264 million small ruminants are found in the total area. Sheep represent 46 and goats 54% of the small ruminant population. In addition, one assumes a population of 12 million camels, 12 million equines, 10 million pigs and some 460 million chickens.
1 The tropical livestock unit is commonly taken to be an animal of 250 kg liveweight.
Table 1. Population sizes of livestock species in tropical Africa in numbers and in tropical livestock units (TLU)a (1986).
|
Species |
1000 Head |
TLU conversion factor |
1000 TLU |
|
Camels |
12,320 |
1,00 |
12,320 |
|
Cattle |
161,135 |
0.70 |
112,795 |
|
Sheep |
121,388 |
0.10 |
12,139 |
|
Goats |
142,711 |
0.10 |
14,271 |
|
a Sub-total ruminants |
437,554 |
n.a. |
151,524 |
|
Horses |
2,906 |
0.80 |
2,325 |
|
Mules |
1,518 |
0.70 |
1,063 |
|
Asses |
7,901 |
0.50 |
3,951 |
|
b Sub-total equines |
12,325 |
n.a. |
7,339 |
|
c Sub-total grazing animals (a + b) |
449,879 |
n.a. |
158,863 |
|
Pigs |
10,453 |
0.20 |
2,091 |
|
Chickens |
464, 000b |
0.01 |
4,640 |
|
d Sub-total pigs and chickens |
n.a. |
n.a. |
6,731 |
TLU conversion factors constitute a compromise between different common practices (Jahnke, 1982).Source: FAO, 1987a - FAO, 1986b.
Ruminant species, excluding camels constitute 82% of the total TLU. They are by far the most important livestock species in tropical Africa.
Of the developing world, the African continent has 17% of the cattle and 26% of the small ruminant population; these percentages change to 11 and 17% respectively when compared with world populations (Food and Agriculture Organization of the United Nations [FAO], 1986a,b). The human population of Africa represents 15.3% of the developing countries' and 11.5% of the world's population (FAO, 1986a,b).
The cattle per caput and the small ruminants per caput ratios are, respectively, 0.32 and 0.63 in Africa, 0.23 and 0.28 in developing countries, 0.35 and 0.47 in developed countries and 0.26 and 0.33 in the world.
The cattle per caput ratio in Africa is closer to the developed than to the developing countries, exceeding by far the world average and the ratio for small ruminants in Africa is the highest in the world.
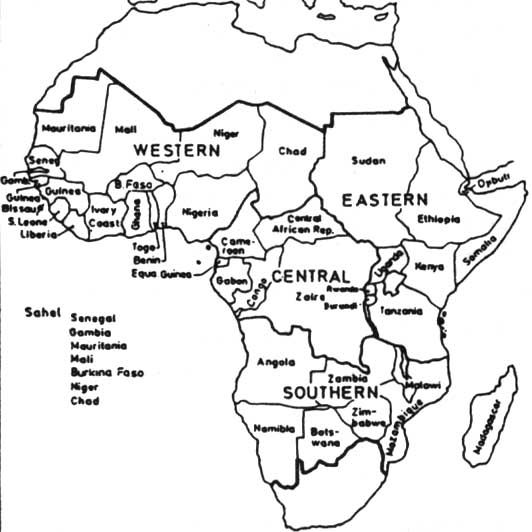
Figure 1 shows the subdivision of tropical Africa into four major regions, while Table 2 indicates the regional distribution of the ruminant species. Eastern Africa has by far the largest population, with 55% of the TLU, followed by the Western and Southern regions with 25.1 and 15%, respectively and by Central Africa with 4.4%.
Table 2. Distribution of the ruminant livestock population species in regions/countries of tropical Africa (1986).
|
Region/Country |
Thousand head |
Total 1,000 TLU |
Share in total TLU (%) |
|||
|
Camels |
Cattle |
Sheep |
Goats |
|||
|
Western Africa |
2,045 |
37,635 |
40,272 |
56,488 |
38,066 |
25.1 |
|
Sahel |
2,027 |
19,589 |
20,178 |
23,259 |
20,083 |
13.1 |
|
Nigeria |
18 |
12,169 |
13,160 |
26,320 |
12,485 |
8.2 |
|
Other |
- |
5,877 |
6,934 |
6,901 |
5,497 |
3.6 |
|
Central Africa |
- |
7,982 |
3,564 |
6,888 |
6,633 |
4.4 |
|
Zaire |
- |
1,400 |
700 |
2,930 |
1,350 |
0.9 |
|
Other |
- |
6,582 |
2,794 |
3,958 |
5,283 |
3.5 |
|
Eastern Africa |
10,275 |
85,893 |
67,939 |
69,620 |
84,156 |
55.5 |
|
Sudan |
2,800 |
22,389 |
20,600 |
15,581 |
22,090 |
14.6 |
|
Ethiopia |
1,000 |
30,000 |
23,000 |
17,000 |
26,000 |
17.2 |
|
Other |
6,475 |
33,504 |
24,339 |
37,039 |
36,066 |
23.8 |
|
Southern Africa |
- |
29,625 |
9,613 |
9,715 |
22,670 |
15.0 |
|
Mainland |
- |
19,140 |
9,009 |
8,490 |
15,148 |
10.0 |
|
Madagascar |
- |
10,485 |
604 |
1,225 |
7,522 |
5.2 |
|
Total |
12,320 |
161,135 |
121,388 |
142,711 |
151,524 |
100.0 |
Source: FAO, 1987.
Productivity differs greatly between developed and developing countries. The latter have nearly 70% of the bovines and buffaloes in the world, but produce only 29% of the meat and 23% of the milk. The developing countries have 64% of the small ruminant population and produce 54% of the meat (Hoste, 1987).
The productivity of bovines is about 15 kg meat per head per year in developing countries versus 79 kg in the developed world. This statistic is relatively better for small ruminants, whose productivity is 4.6 kg meat per head per year in the former and 6.5 kg in the latter (Hoste, 1987).
Meat productivity per head of cattle and per small ruminant in Africa, at 14 and 3.7 kg per head, respectively, is a little less than the average of all developing countries. (Hoste, 1987). Milk productivity is much lower in developing countries. It is estimated to be 90 litres per head of cattle per year versus 900 litres in the industrialized world (Tackier, 1982).
Furthermore, the percentage of the agricultural population differs greatly between the developed and developing countries, 63% in developing countries (66% in Africa) versus 10% in the developed countries (FAO, 1986a,b).
This very low rate of productivity of livestock and labour in developing countries, especially in Africa, suggests that production systems are faced with major constraints and/or are managed for goals other than just meat or milk production.
Livestock production systems in Africa
Environmental conditions and intensity levels
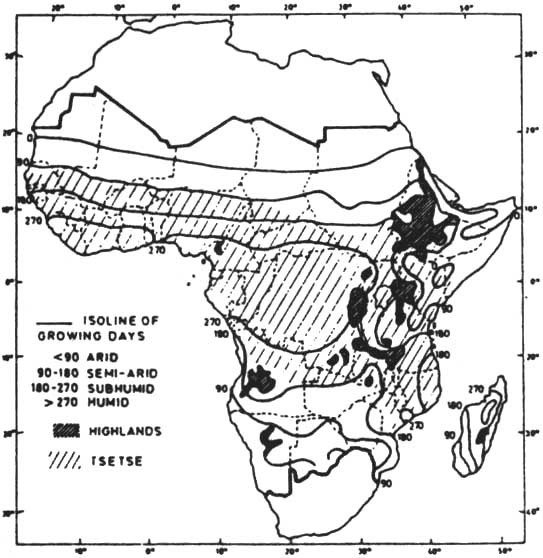
Figure 2 shows the different ecological zones of tropical Africa; the isolines reflect the number of growing days of vegetation and display an aridity-humidity gradient.
Figure 1. Regions of Tropical Africa
Figure 2. The Ecological Zones of Tropical Africa and the Extent of Tsetse Infestation.
Source: Jahnke, 1982; Katondo, 1984.
Table 3 shows the extent of the ecological zones by region in tropical Africa. The Western and Eastern regions are mainly arid and semi-arid. The South is divided into approximately equal parts of arid, semi-arid and sub-humid zones and Central Africa is mainly humid. Almost all highland areas are located in the Eastern and Southern zones. The arid zone is the largest, covering 37% of the area, followed by the sub-humid zone with (23%), the semi-arid and the humid zones (18% each) and the highlands 4%.
Table 3. Extent of ecological zones by region in tropical Africa (1,000 km2).
|
Ecological zone/region |
Western |
Central |
Eastern |
Southern |
Total |
% |
|
Arid |
3,990 |
- |
3,015 |
1,322 |
8,327 |
37.3 |
|
Semi-arid |
1,442 |
74 |
1,047 |
1,487 |
4050 |
18.1 |
|
Sub-humid |
1,187 |
805 |
959 |
1,907 |
4,858 |
21.7 |
|
Humid |
707 |
3,029 |
94 |
307 |
4,137 |
18.5 |
|
Highlands |
4 |
61 |
718 |
207 |
990 |
4.4 |
|
Total |
7,330 |
3,969 |
5,833 |
5,230 |
22,362 |
100.0 |
Source: Jahnke, 1982.
Table 4 shows the ruminant livestock population within each ecological zone. Cattle are most numerous in semi-arid regions (31%) followed by the sub-humid and arid zones and the highlands (about 20% each). Small ruminants are mainly distributed in the arid zone and goats outnumber sheep except in the highlands. Ruminant densities are by far the highest in the highlands, followed by the semi-arid zone (Tackier and Jahnke, in press).
Table 4. Ruminant livestock population by species and ecological zone in tropical Africa (1986).
|
Ecological zone |
1,000 head (%) |
Ruminantsa 1,000 TLU (%) |
||
|
Cattle |
Sheep |
Goats |
||
|
Arid |
34,322 |
43,093 |
55,087 |
46,163 |
|
(21.3) |
(35.5) |
(38.6) |
(30.5) |
|
|
Semi-arid |
49,629 |
26,948 |
37,818 |
41,229 |
|
(30.8) |
(22.2) |
(26.5) |
(27.2) |
|
|
Sub-humid |
35,772 |
16,509 |
23,119 |
29,003 |
|
(22.2) |
(13.6) |
(16.2) |
(19.1) |
|
|
Humid |
9,668 |
9,590 |
13,129 |
9,040 |
|
(6.0) |
(7.9) |
(9.2) |
(6.0) |
|
|
Highlands |
31,744 |
25,127 |
13,558 |
26,089 |
|
(19.7) |
(20.6) |
(9.5) |
(17.2) |
|
|
Total |
161,135 |
121,388 |
142,711 |
151,524 |
|
(100.0) |
(100.0) |
(100.0) |
(100.0) |
|
a Including camels.Source: Adapted from Jahnke (1982); updated figures are based on the assumption that the distributional ratios of the different species between the ecological zones did not change; totals correspond with the country figures by FAO, 1986a; the whole of the camel population has been put in the arid zone.
Traditional production systems
In the arid zones of tropical Africa we find pastoral systems and, as humidity increases, agro-pastoral systems combining livestock husbandry and crop production.
Nomads make use of the hyper-arid zones, usually with camels and goats rather than cattle. The proportion of cattle in herds increases in arid regions where transhumance becomes more important. Livestock production is a tribal affair based on traditional rights to the rangelands. The main product is milk, the major component of the human diet; meat is not a major concern. A limited number of animals are sold for cash in order to purchase cereals or clothing or to pay taxes. The major goals in pastoral systems are to assure subsistence for the increasing community and to avert risk of disease and drought mainly by maximizing livestock numbers.
The main reason for livestock integration into agro-pastoral systems is the need of draught power and manure. Meat and milk are less important than in other systems. Animals are fed on fallow land and with agricultural by-products which would otherwise remain unused. The sale of small ruminants enables farmers to meet unexpected cash needs.
The African highlands, due to their good big-climatic conditions, have the highest densities of people and livestock. The high density of livestock has led to increased intensity levels. Animal feeding is improved by using fodder in rotation systems or fodder trees as wind-breaks and erosion barriers. At these altitudes transhumance is rare.
Almost 95% of the beef in tropical Africa is produced by traditional production systems (Tackier and Jahnke, in press).
Modernized production systems
Cattle fattening is undertaken by smallholders or is done in feedlots. The number of on-farm fattened animals varies seasonally due to production requirements. Fodder shortages are compensated by the use of agricultural by-products; feed-lots use a wide range of agricultural and agro-industrial by-products. Economic and financial benefits have been closely related to management issues such as the price of feed and meat, livestock and feed supply lines and sale facilities (Institut d'Elevage et de Medicine Veterinaire des Pays Tropicaux [IEMVT], 1973).
Ranching systems are located mainly in the arid and semiarid zones of Eastern and Southern Africa. They hold breeding and growing herds, or specialize in breeding or in growing units (Senegal) according to environmental and economic conditions.
It is only in the few modernized production units that monetary income is the main goal of livestock rearing. This is one explanation of the difference in productivity per head between Africa and the developed countries.
Livestock functions and management
The function of livestock in tropical Africa is multiple, with their economic and social importance depending on the production system (Jahnke, 1982; Tacher and Jahnke, in press; Weber, 1986).
Output function: Livestock produce food and non-food materials, mainly hides, skins and wool and provide transport services. The surplus of products not used for subsistence is easy to market and enters the monetary economy.
Input function: Livestock provide intermediate products such as animal traction for agricultural field work, transportation or other purposes and manure used as fertilizer, organic materials or fuel. Livestock also convert crop residues and fibre materials of no value into protein of high quality.
Asset and security functions: Livestock have the characteristics of a capital investment yielding an interest in the form of milk, eggs, etc. They are a safe and durable form of storing and increasing wealth, especially if there is no financial system to ensure this function.
Social and cultural function: Livestock are involved in social exchange within families or with other social groups. Slaughtering for traditional feasts or religious ceremonies gives social rewards for the cattle owners and reinforces family and social links. Livestock have a cultural function in various societies.
Input constraints to productivity improvement
Even if all production systems aim to increase meat and milk production, they are confronted with input constraints more or less common to all African countries: capital is scarce and the level of capitalization is low. Furthermore, monetary incomes are low in Africa due to the importance of subsistence. Exports of African countries are insufficient and consist mainly of raw materials whose international prices are low and variable. What is true for capital in general is even more true for foreign currencies. An improvement of productivity would require energy inputs which are rarely available locally and are difficult to obtain, due to the lack of income in general and of foreign currencies in particular.
The increase in livestock productivity also requires an upgraded feed supply for animals at a low cost. But the low agricultural productivity in Africa results in much higher relative prices of crop products compared to meat products. For example the beef/grain price ratio has been evaluated at 10-12 in North America, 7-8 in European Economic Communities countries, 45 in Australia and Argentina and only 2-3 in Ethiopia, Tanzania and Madagascar (Jahnke, 1982). This reflects the competition for crop products between man and livestock. Weber (in press) established that an increase in livestock productivity must be preceded by an increase in crop productivity to assure the fodder requirements. Or to generalize, the livestock production in any country depends on the overall agricultural productivity.
Genetic factors
The broad genetic variability of African livestock breeds enables them to exist under harsh environmental conditions of all kinds, including trypanosomiasis infestation if the challenge is not too high.
Environmental pressure continues to maintain a wide range of resistance aptitudes within all breeds. This may be interpreted as a genetic response of the species to risk. In controlled environments such as research stations or experimental farms, African breeds show good performance aptitudes in weight gain, fertility, etc. This suggests that they would react very well towards any improvement in their management conditions, mainly those concerning feed and diseases. This should be accompanied by selection schemes based on performance and resistance. They also have been successfully crossed with breeds originating from developed countries, mainly to increase milk production.
Genetic factors do not appear to be a restriction in Africa. Local breeds are able to make the best use of their actual environment, and, with better management, performance can be improved.
Land and labour
Land is of major importance in all African production systems. The pastoral systems utilize land that is unsuitable for other types of production and Provide a higher employment capacity than modernized systems in comparable ecological settings. An agriculturalist in Africa commercializes between 0.5 and 1.5 TLU per year; in Australia the figure is between 100 and 200 TLU (Tackier and Jahnke, in press). As mentioned before, the main objective of the pastoral societies is risk aversion by maximizing livestock numbers and consequently assuring subsistence. Land use is based on traditional rights (often challenged in crisis situations).
In the sub-humid zone, which borders on transhumance areas, herders and farmers compete for land use during the dry season. The pressure on land comes from farmers, due to the increase of the human population and from herders, due to the periodic droughts in various parts of Africa. Clearly this situation limits livestock production due to scarcity of land. Pressure on land is greatest in the highlands which are the most densely populated areas.
The equatorial forest and the low, flooded areas are unsuitable for livestock, while the availability of land for livestock production is also restricted by environmental constraints in the sub-humid and humid zones. The main constraint in these regions is trypanosomiasis, a disease which largely excludes cattle production and the survival of even trypanotolerant breeds may be threatened.
In general labour as an input is not a constraint since unemployment is common in tropical Africa. But livestock husbandry requires certain skills and experience. Programmes which introduced trypanotolerant cattle in areas with no cattle keeping tradition had to provide training to enable unskilled farmers to rear livestock.
Trypanosomiasis
Bacterial or viral diseases such as rinderpest are obstacles in the arid zones. Parasitic diseases become more important as humidity increases. Trypanosomiasis is a major constraint to livestock husbandry and production in the sub-humid and humid zones.
The FAO (in Hoste, 1987) has tried to assess the benefits of an eventual eradication of tsetse in the 7 million km of infested savanna which had a population of 20 million head of cattle in 1974. Assuming a potential density of 20 head per km2, the number of cattle, after the elimination of trypanosomiasis, would reach 140 million. The additional 120 million would produce 15 kg of meat per head per year resulting in a total of 1.8 million tons of meat per year. But the estimated potential density for cattle seems to be very high and does not permit for any increase in the small ruminant population.
We have made a different hypothesis. Our estimation is based on:
(1) the ecological zones defined in Table 3 and the relative density of all ruminant livestock in tsetse-free or infested areas in the sub-humid and humid zones (based on Tacher and Jahnke, in press);(2) equalization of ruminant densities between tsetse-free and infested areas: in the sub-humid zones the latter would rise from 6.2 to 9.9 TLU/km2 and in the humid zones from 2.8 to 9.3. The semi-arid zones are not included since the ruminant densities in infested areas are higher than those in tsetse-free areas.
If one considers the 7.039 million km2 infested in the subhumid and humid zones, the total increase in cattle would be 33 million head producing an additional 495,000 tons of meat per year (assuming a productivity of 15 kg/head/year).
Our results indicate much lower numbers than those estimated by FAO, mainly due to the difference in the potential density that could be achieved after the elimination of trypanosomiasis. If we also take into account the milk production of our additional 33 million head of cattle, we obtain an increase in milk production of 1.26 million tons per year (again using the FAO's estimates of 38.3 kg milk/head/year (Hoste, 1987). Converting the milk production into meat-equivalents using the relevant ratio given by Jahnke (1982), shows that an additional 537,000 tons of meat-equivalents per year could be obtained. Adding this figure to the meat production already computed, we arrive at an increase of 1.032 million tons of meat-equivalents per year as a result of the eventual disappearance of trypanosomiasis.
When we compare our estimated figures with the total production of 3,162 million tons of meat and 8,745 million tons of milk produced by cattle and small ruminants per year (Table 5), we Obtain a respective increase of 16 and 14%. The potential benefits from trypanosomiasis control/eradication would appear to be considerable.
Table 5. Food production of livestock in tropical Africa (1986).
|
Livestock species/product |
|
Quantity 1,000t |
Grain equivalents 1,000t |
% |
Calorific value Mcal/t |
% |
|
Camels |
Milka |
2,460 |
4,182 |
9.8 |
836 |
4.6 |
|
Cattle |
Milkb |
2,245 |
8,980 |
21.1 |
6,286 |
34.2 |
|
Milkc |
6,451 |
10,967 |
25.7 |
2,193 |
11.9 |
|
|
Sheep/ |
Meat |
917 |
3,668 |
8.6 |
2,568 |
14.0 |
|
goats |
Milkd |
2,294 |
3,900 |
9.1 |
780 |
4.2 |
|
Sub-total ruminants |
|
n.a. |
31,697 |
74.3 |
12,663 |
69.0 |
|
Pigs |
Meatd |
303 |
1,212 |
2.8 |
2,145 |
4.8 |
|
Chickens |
Meat |
766 |
3,064 |
7.2 |
2,145 |
11.7 |
|
|
Eggs |
667 |
6,670 |
15.6 |
2,668 |
14.5 |
|
Sub-total non-ruminants |
|
n.a. |
10,964 |
25.7 |
4,814 |
31.0 |
|
Grand total |
|
|
42,643 |
100.0 |
17,477 |
100.0 |
|
Total meat |
|
4,231 |
16,924 |
39.7 |
11,847 |
64.7 |
|
Total milk |
|
11,205 |
19,049 |
44.7 |
3,810 |
20.8 |
|
Total eggs |
|
667 |
6,670 |
15.6 |
2,688 |
14.5 |
a Milk production of camels teas been put at 200 kg/head (Jahnke, 1982).b The meat commodity is defined as indigenous meat (FAO).
c The milk commodity is defined as whole, fresh milk.
d (FAO, 1986a).
Conversion ratios for grain and calorific equivalents are taken from Jahnke, 1982.
Source: FAO, 1987; FAO, 1986a
Livestock products in the diet of African people
The share of animal products in the diet is a reliable indicator of the wealth and development of a nation's economy. In developed countries animal products provide, respectively, 30.5, 57.4 and 62.5% of the energy, proteins and fat of the diet (FAO, 1986). These percentages change to 8.1, 19.7 and 35.5% when applied to developing countries as a whole and to only 6.6, 20.7 and 21.1% for Africa.
Furthermore the calorie, protein and fat supply per caput in Africa represent only 63.9, 53.4 and 32.6% of those in developed countries. The same figures related to developing countries are, respectively, 90.1, 90.8 and 103.7%.
Table 6 shows the livestock production per caput in Africa. The average figures of 8.0 kg meat and 20.3 kg milk per caput per year hide great disparities between the different regions of tropical Africa, as shown in Table 7 (Hoste, 1987). The production of meat per caput per year varies from 2.6 to 16.9 kg and the milk production from 1.4 to 39.5. The lowest figures are from Central Africa, but the figures for the Western region, which bears the highest density of human population, are very close to the former.
Table 6. Livestock production in Africa.
|
Indicator |
Total Africaa |
Tropical Africa 1985/86 |
|||
|
1950 |
1970 |
1985 |
|||
|
Per caput production (kg)b |
|||||
|
|
Meat |
12.0 |
11.1 |
8.6 |
8.0 |
|
|
Milk |
32.6 |
31.5 |
26.2 |
20.3 |
|
Production per animal (kg) |
|||||
|
|
Beef/veal |
13.9 |
13.6 |
17.8 |
13.8 |
|
|
Mutton/goat meat |
3.1 |
3.5 |
4.0 |
3.5 |
|
|
Pork |
34.1 |
41.1 |
39.0 |
30.0 |
|
|
Milk from cattle |
50.9 |
57.6 |
66.3 |
40.4 |
|
|
Milk from sheep/goats |
7.2 |
6.6 |
8.5 |
8.6 |
a The figures include only the mentioned animals.b Production related to the total human population.
Source: Jasiorowski (1973) for the first two columns; FAO, 1987; FAO, 1986a for the third and fourth columns.
In the Central and Western regions the protein supply from livestock products is low, but it is complemented by fishery products to a certain extent, either imported or of local origin.
Table 7. Per caput production (kg) according-to different regions in tropical Africa.
|
Region |
Meata |
Milkb |
|
Sudano-Sahelian |
16.9 |
39.5 |
|
Western sub-humid and humid |
3.4 |
3.4 |
|
Central humid |
2.6 |
1.4 |
|
Eastern sub-humid and highlands |
8.9 |
21.8 |
|
Southern sub-humid and semi-arid |
8.2 |
16.1 |
|
Tropical Africa |
7.5 |
15.2 |
NB: The regions are different from those used elsewhere in the paper.
a All ruminant livestock.
b Cattle onlySource: Hoste, 1987.
Livestock contribution to economic goals
A first, rough approach to assess the economic significance of the livestock sector is to estimate its contribution to the Gross Domestic Product (GDP).
As in most developing countries, the share of agriculture in GDP is important in Africa, rising from 7.6 and 9.5% for Gabon and Congo, which are oil exporters, to 57 and 60% in Niger and Burundi (Jahnke, 1982). The average for all countries in tropical Africa is 29%.
The share of livestock in agricultural GDP rises from 2.2 and 2.3% for Gabon and Cote d'Ivoire, to 35.7% for Zimbabwe, 38.7% for Chad and even 81.6 and 86.3% for Somalia and Mauritania, with an average value of 17.4%. The average contribution of the livestock sector to the total GDP is 5.0% in tropical Africa.
The gross value of meat represents 47% of the total value of all edible livestock products of tropical Africa, while milk represents 15% and draught power is an intermediate product at 31% (ILCA, 1987).
Using the GDP as a first economic indicator, the problems of prices, unemployment and balance of payments must not be forgotten.
Livestock products do not contribute much to foreign currency earnings in African countries. Generally international prices are lower than domestic prices due to the surplus produced in developed countries. This fact encourages African governments to import livestock products to assure the protein supply. But imports cost valuable foreign currency and certainly do not favour any domestic livestock development. In this context manipulated price systems, such as fixed prices at a low level, act as an obstacle to domestic livestock production. However domestic livestock husbandry ensures a high employment: production ratio and contributes to the rural employment of large numbers of people who cannot find an alternative job in their national economies.
Supply and demand projections
The annual increase of supply in tropical Africa is 2.9%, which means that it would take 24 years to double.
For the next few years an annual increase in income per caput of slightly over 4% in sub-Saharan Africa is projected (Sarma and Yeung, 1985). Table 8 shows the income elasticities of demand for selected crops and livestock products in tropical Africa for the period 1975-2000. In most cases they are negative for roots plants, low for cereals but close to or higher than 1 for livestock products. The highest values for meat derive from Western non-Sahelian Africa including the most densely populated countries with the highest expected growth of per caput income.
Table 8. Regional averagea income elasticities of demand for selected crop and livestock foods in tropical Africa, 1975-2000.
|
Region/country |
Crop foods |
Livestock foods |
||||
|
Cereals |
Roots |
Meatb |
Milk |
Eggs |
||
|
Western |
||||||
|
|
Sahel |
0.24 |
-0.22 |
1.04 |
0.53 |
0.90 |
|
|
Nigeria |
0.16 |
-0.09 |
1.08 |
1.20 |
1.20 |
|
|
Other |
0.33 |
-0.16 |
1.08 |
1.23 |
1.10 |
|
Central |
0.51 |
0.03 |
0.97 |
1.23 |
0.90 |
|
|
Eastern |
||||||
|
|
Sudan |
0.22 |
-0.18 |
0.81 |
0.90 |
2.00 |
|
|
Other |
0.24 |
-0.05 |
1.01 |
0.77 |
1.10 |
|
Southern |
0.14 |
0.17 |
0.84 |
0.90 |
2.00 |
|
|
Tropical |
||||||
|
|
Africa |
0.22 |
-0.07 |
0.98 |
0.82 |
1.10 |
a Weighted according to the share in overall consumption of food products; average over analysis period (Jahnke, 1982).
b Excluding edible offals; including game.Source: de Montgolfier-Kouevi and Vlavonou (1981) based on FAO (1979).
Consequently, projections of domestic demand at constant prices (Table 9) show that the annual growth rates for livestock foods are higher than that of human population (assumed to be 2.97% in this table). The increase coefficients between 1975 and 2000 range from 2.9 for meat to 3.6 for eggs.
Table 9. Projection of domestic demanda for selected crop and livestock foods in tropical Africa, 1975-2000.
|
Food Item |
Annual growth rate per caput |
(%) total |
Increase 2000/1975 by factor |
|
Crop foods | |||
|
Cereals |
0.4 |
3.4 |
2.3 |
|
Roots |
-0.1 |
2.9 |
2.0 |
|
Livestock foods | |||
|
Meat |
1.2 |
4.2 |
2.9 |
|
Milk |
0.8 |
3.8 |
2.5 |
|
Eggs |
2.2 |
5.2 |
3.6 |
a At constant prices (1975).Source: de Montgolfier-Kouevi and Vlavonou (1981) based on FAO, 1979.
Another projection (ILCA, 1980) indicates that the domestic demand growth rate will reach 6.8% for meat and 6.2% for milk. Furthermore it has been accepted (Tackier, 1986) that the share of animal products in the human diet shows a constantly increasing trend whatever happens.
With respect to these demand projections, the supply will rise from 2.4% for total meat (1.2% for ruminant meat) and 1.2% for milk (ILCA, 1980) to 3.1% for meat and 1.6% for milk (Sarma and Yeung, 1985). Even with the most optimistic assumptions, domestic supply is not expected to meet the demand in the coming years. Moreover productivity appears to be stagnant in tropical Africa (Jahnke, 1982) and it seems that the increase in supply results more from the growth in number of livestock (especially ruminants) than from a productivity improvement.
Self-sufficiency
In tropical Africa the self-sufficiency ratio for meat has declined during the last ten years, as has the ratio for milk and eggs during the last twenty years (Tackier, 1986). The ratio for meat was 1.0 for the period 1961 to 1977 and it is expected to decline to 0.8 in 1990 and 0.6 or even 0.4 according to other assumptions (ILCA, 1980) by the year 2000. The ratio for milk was 0.9 in 1961-1965 and it is projected to decrease constantly to 0.4 or even 0.3 by the year 2000 (ILCA, 1980). The egg ratio is also expected to decline from 1.0 to 0.9 in the same period.
Currently Africa is confronted with a deficit in both meat and dairy products (a larger one for dairy). The situation according to all projections is likely to worsen due to the increasing gap between supply and demand. Moreover we have to keep in mind that these projections are based on the economic concept of demand, meaning solvent demand. This differs greatly from the needs assessed according to the diet requirements of the human population. In addition these projections do not include the demand for draught animals and manure.
How can African countries ensure a greater supply of livestock products? The first choice is between imports and national production. In the classical debate on self-sufficiency the theory of comparative cost advantages would plead for the former since their prices are structurally low. Imports, in the long term, could have the advantage of saving resources which could be invested in sectors where African countries have a comparative advantage.
The success of such a policy assumes that comparative advantages really exist and that the resources saved, especially labour, could be easily converted into the corresponding sectors. It also assumes that the import prices are maintained for some time and that an adequate quantity of products is available when needed. This certainly is the case in a perfect economy where prices are determined only by the markets. But for livestock products it is obvious that few countries control both quantities and prices and an exclusive import policy would lead African countries from deficiency to dependency in an field of prime importance.
Hence, even if the options are restricted, depending on local and particular conditions, it is imperative for livestock production to be developed in the whole of tropical Africa. Moreover, many African countries strive for a balance between imports and local products to ensure an immediate supply to the poorest, especially in cities; they also attempt to finance livestock development projects publicly to increase employment and the local supply.
Possible strategies for development, especially in tsetse-affected zones
Generally speaking, development initiatives in livestock production should be based mainly on the traditional sector. This strategy combines several advantages including lower requirements for foreign currency and higher quality feeds and a more effective contribution to rural development.
An incentive price policy is an instrument of prime importance to obtain growth in production and productivity. But the response of domestic production is difficult to assess and it strongly depends on a producer's access to and confidence in the financial system. Furthermore the response has a delay during which imports are supported and a net financial need will occur for several years. Hence, the problem of balancing short-term (food supply) and long-term (national production) objectives cannot be solved only by transferring resources from imports to livestock development projects.
Trypanosomiasis acts as an environmental constraint reducing livestock productivity or even making large rangeland areas unsuitable for livestock production. Trypanosomiasis control, treatment or eradication is expensive and is only justified if the benefits (weighted by the risks) exceed the costs.
The three main practices to meet the problem are tsetse control or eradication, chemical treatment or prophylaxis and the use of trypanotolerant breeds. The choice between them depends on local conditions, particularly:
- the existing situation of livestock husbandry (breeds used, production systems, etc.);- the level of trypanosomiasis challenge and whether it is permanent or seasonal during the year; and
- the ranking and relative importance of trypanosomiasis among other development constraints.
The time dimension must be taken into account: basically eradication schemes assume that the costs are incurred for a limited period of time, though they can be increased if the risk management is inadequate, as treatment by prophylaxis entails lower but continuous expense.
Hence the three main schemes have their own indications. Without pretending to establish a rule common to all cases, one may consider that (Figure 3):
- if the challenge is not permanent or if there is no possibility for tsetse eradication campaigns, chemical treatments are the relevant choice;- game exploitation could be undertaken if the pastures are poor and the human density is low;
- when dealing with zebu cattle, eradication may be a solution if the area is small or if it can be isolated. Pressure on land is a major factor of success in eradication campaigns, as high rates of land occupancy following these campaigns contribute greatly to avoiding reinvasion risks.
Figure 3 Alternative approaches to the tsetse and trypanosomiasis problem (simplified flow-chart)
If the area is large and cannot be isolated, eradication will be hard to accomplish and the choice will be tsetse control. Chemical prophylaxis or treatment can be integrated in control methods. At a certain level of trypanosomiasis challenge, only taurine (generally trypanotolerant) breeds are able to produce; but when exposed to high tsetse challenge they also have to be protected. In this context chemical treatments, eventually combined with traps and screens for tsetse control, appear to be the best method.
In all these fields, technological improvements would result in a widening of the range of possible technical choices or in an increase of economic performance.
Particularly since even the trypanotolerant breeds are unable to produce and live in cases of extremely high tsetse challenge, the knowledge of the tolerance mechanism must be improved and selection and diffusion programmes of more tolerant livestock must be undertaken.
FAO 1979. Food and Demand Projections, 1975-2000. Rome.
FAO. 1986a. Production Yearbook 1985. No. 39, Rome.
FAO. 1986b. Trade Yearbook 1985. No. 39, Rome.
FAO. 1987. ICS-data, Statistical Division, FAO, Rome.
Hoste, Ch. M. 1987. Elevage et trypanosomiase animale Africaine. These de doctoral d'etat es sciences naturelles. Universite Pierre et Marie Curie, Paris, France.
Hrabovszky, J.P. 1981. Elevage: Horizon 2000 - notamment dans les pays en development. Revue Mondiale de Zootechnie, 40: 2-16.
IEMVT. 1973. L'embouche Bovine en Afrique Tropicale et a Madagascar. Colloque de Dakar (Senegal), 4-8 decembre 1973. IEMVT, Maisons-Alfort, France.
ILCA. 1980. Livestock production prospects for tropical Africa in the year 2000. ILCA Bulletin 10. Addis Ababa.
ILCA. 1987. ILCA's strategy and long-term plan. Addis Ababa.
Jahnke, H.E. 1982. Livestock Production Systems in Livestock Development in Tropical Africa. Kiel, FRG: Kieler Wissenschaftsverlag Vauk.
Jasiorowski, H.A. 1973. Twenty years with no progress. Wld. Anim. Rev. 5: 1-5.
Katondo, K.M 1984. Revision of second edition of tsetse distribution maps. Insect Sci. Applic. 5 (5): 381-388.
Montgolfier-Kouevi, C. de and A. Vlavonou. 1981. Trends and prospects for livestock and crop production in tropical Africa. ILCA Headquarters, Working Document 5, ILCA, Addis Ababa.
Sarma, J.S. and P. Yeung. 1985. Livestock products in the third world: past trends and projections to 1990 and 2000. International Food Policy Research Institute, Washington, D.C., USA.
Tacher, G. 1982. Problemes economique et avenir des methodes de production animale. Communication presentee au Collogue d'Anders (Belgique): Productions animales tropicales au benefice de l'homme. Anvers, 17-28 decembre 1982.
Tacher, G. 1986. Prospects of livestock production in the future and its relation to sufficient food supply. In: Proceedings of the Fifth International Conference on Livestock Production and Diseases in the Tropics. Kuala Lumpur, Malaysia.
Tacher, G. and H.E. Jahnke. Beef production in semi-arid and tropical zones; beef production systems in Africa. In: Beef Cattle Production. R. Jarribe and C. Beranger, eds. Amsterdam, Netherlands: Elsevier. (in press).
Weber, A. 1986. The contributions of livestock productivity in economic development. University. Kiel, FRG (unpublished).
![]()
![]()
![]()