![]()
![]()
![]()
T. WACHER, P. RAWLINGS and P. JEANNIN
The measure of relative tsetse challenge to cattle depends on the assessment of tsetse abundance (relative density), modified by the mature trypanosome infection rate in the population of flies (ILCA, 1986). The effect of challenge is monitored by assessment of trypanosome prevalence in corresponding cattle populations.
The ATLN has shown that generally there is a positive relationship between these two measures (challenge and prevalence), but points from some locations remain widely divergent from the line of best fit. It has become apparent that one of the major sources of this variability lies in the fact that cattle/fly contact can vary widely within single villages. Hence a single measure of fly challenge at one village need not reflect the experience of each of the herds in that village (e.g. Nankodaba, see article 6 of these Proceedings). There are clearly complex temporal and spatial aspects to cattle/fly contact which can be expected to be of significance in accounting for observed differences in prevalence rates between herds.
The Overseas Development Administration (ODA) funded tsetse project at International Trypanotolerance Centre (ITC), The Gambia, is investigating this aspect of challenge by making a detailed study of tsetse distribution around study villages, supported by mapping of the corresponding space-use pattern by N'Dama cattle herds based at each of the villages. This work is being undertaken at three primary sites: Gunjur, where Glossina palpalis provides a low and very localized challenge; Keneba, where G. morsitans submorsitans provides a medium (though seasonally restricted) challenge, and Bansang, where the fly challenge, though still being investigated, appears to be similar to Keneba, except that both fly species are present.
Fly distribution is being mapped by extensive primary arrays of F3 box traps, set out on a systematic grid to cover the grazing area of the cattle. Subsidiary arrays of traps, within the main grid, sample habitats of special interest.
Maps of herd movements are made by following herds from the time they are released in the morning until they return for tying up in the evening. Grid references (read from aerial photographs) of current location are recorded at five minute intervals. In this way time spent at each location may be estimated by assigning a value of five minutes to each record, and summing the number of records at each location. At each five minute record, codes are also entered to describe the current habitat type, focal cow and herd activity, group size, presence or absence of tsetse, etc. Hence any subset of cattle locations may be selected and analyzed with respect to a variety of factors of possible relevance to tsetse behaviour, e.g. habitat type, herd activity, size, direction and rate of movement.
As yet no data are available from the extensive trap arrays as these have been installed only recently. Currently the most detailed data available is limited to a short period between May and August 1987 at one village, Keneba. This is the late dry-season, early wet-season period when fly abundance and trypanosome prevalence is typically at its lowest in The Gambia. Although 35 traps and 380 head of cattle have been monitored monthly, the numbers of both tsetse and infected cattle are low for these months. Nevertheless, knowledge of the grazing patterns of individual herds at Keneba provide some intriguing preliminary indications of the cattle/fly contact patterns and observed trypanosome prevalence.
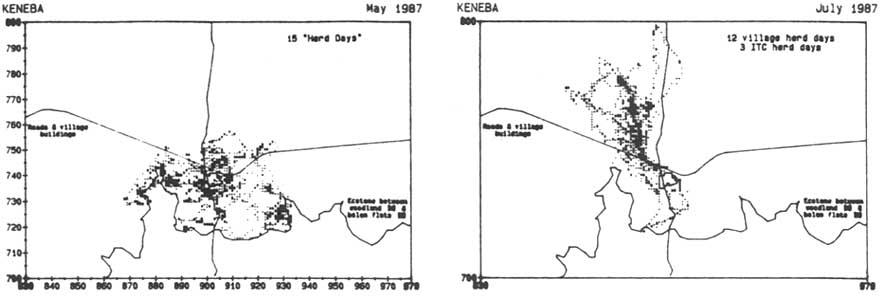
In the dry season months of May and June, when cattle are not herded and are free to move at will, it was established that each of the three village herds at Keneba showed partial, but significant, separation of their ranges. One herd showed a preference for the area to the west of the village, another to the south of the village and the third to the east of the village.
In the wet season, under the influence of herdsman who seek to keep the animals away from growing crops, all the herds experience a shortened grazing day (from 12-13 hours in the dry season down to 6-7 hours when being herded), and are consistently taken to woodland areas to the north of the village.
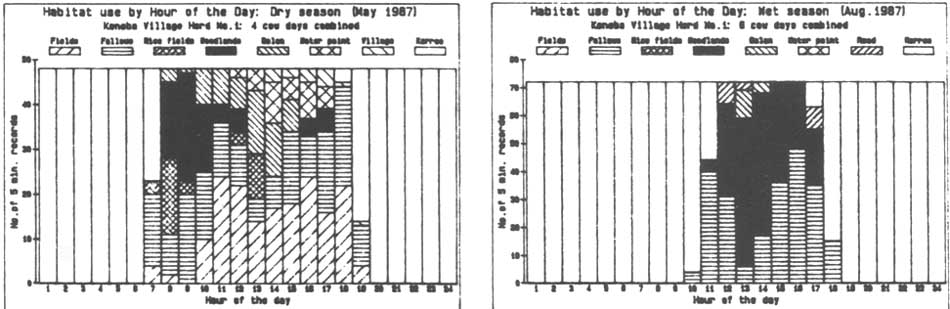
Hence in 1987 there were very large, between-season differences in range use for all herds. This is illustrated in Figure 1, which compares ranges of the village herds in May and July 1987. A direct consequence is that herds experienced different, between-season patterns of habitat use (Figure 2). It was also noted that within the short series of dry season observations, herds showed significant range separation, with Herd 1 using western sectors around the village, Herd 2 moving to the south and Herd 3 using the west. All three herds watered at the same watering point in the village.
It follows from all of this that if a single measure of tsetse challenge is to be applied to the village, as is practiced in the ATLN, then effectively an assumption is being made that since the cattle are not using the range uniformly, then fly challenge itself must be uniformly distributed.
It is interesting to note that 60% of all detected new infections in village herds at Keneba occurred in Herd 1, which accounts for only some 30% of the animals. In the same period 86% of all flies caught in the existing fly round and trap arrays at Keneba occurred in the northern and western sectors around the village, areas visited only by Herd 1 in the period considered.
The significance of this can only be established by following the pattern right through a "fly" season, which we are currently doing. It is nevertheless exactly what should be expected if the general observation relating challenge to trypanosome prevalence, discussed in the introduction, can be applied to a single location. The implementation of extensive trap arrays in the near future is thought likely to reveal widely differing rates of challenge in the immediate environs of a village, particularly at Keneba The mechanisms are in place to explore the consequences of this.
With full data from both Keneba and a new study site, Bansang, 300 km up river in The Gambia, we hope to be able to modify our measure of tsetse challenge to account for relative fly density in different habitats, infection rate, time spent by cattle in different habitats and time of day. In the long run it would be useful to be able to make specific predictions on, for example, the likely consequences in terms of additional cattle infections, if the wet season grazing regime of N'Dama in The Gambia were extended from the current six or seven hours to a more "normal" twelve to thirteen hours. Likewise it would be of interest to examine the ways in which different components of the challenge model interact to influence observed trypanosome prevalence, particularly the relative significance of fly numbers and time spent by cattle in fly habitats.
ILCA. 1986. The African Trypanotolerant Livestock Network. Indications from results 1983-1985. ILCA, Addis Ababa, Ethiopia.
![]()
![]()
![]()