![]()
![]()
![]()
A. DEFLY, K. AWUOME, K. BOKOVI, G.D.M. d'IETEREN, G. GRUNDLER, M. HANDLOS, P. ITTY, S.G.A. LEAK, J.H.H. MAEHL, K. MAWUENA, G. MORKRAMER, S.M. NAGDA, R. W. PALING, J.M. RARIEYA, W. THORPE and J. a. M. TRAIL
The prevalence, species and intensity of trypanosome parasitaemia in different livestock species, breeds, age groups and management systems are reported from Togo for trypanotolerant cattle and sheep in the Avetonou area and for trypanotolerant sheep and goats in the Sokode area. The effects of these trypanosome parasitaemias on health and production traits in cattle and sheep are evaluated. In Avetonou the study included some 380 cattle in eleven villages and two ranch herds and about 120 Djallonke sheep in nine flocks. Data were recorded from January 1984 to December 1986. In Sokode the study included four Djallonke sheep and two Dwarf West African goat flocks, with a total of some 145 animals and covered the period January 1984 to August 1985.
Details of the sites have been given by ILCA (1986) and are summarized in article 3 of these Proceedings. Research protocols and methodologies were those of the ATLN and have been described by Murray et al. (1983) and by ILCA (1986).
Trypanosome prevalence
Trypanosome prevalence, the percentage of animals in which trypanosomes were detected at the monthly recording, varied between years and location in Avetonou and in Sokode, but there was no marked seasonal variation. Livestock species had a major effect on trypanosome prevalence. Prevalence in trypanotolerant cattle was three times that in Djallonke sheep kept in the same area, but there was no difference between the trypanosome prevalence of Djallonke sheep and Dwarf West African goats (Table 1).
Table 1. Mean monthly trypanosome prevalence (%) in cattle, sheep and goats at Avetonou and Sokode, 1984-1986.
|
Site |
Cattle |
Sheep |
Goats |
|
Avetonou (CREAT Ranch) |
6.0 |
|
|
|
Avetonou (Villages) |
7.2 |
2.4 |
|
|
Sokode (Villages) - |
|
7.5 |
7.0 |
a January 1984-August 1985.
The cattle breeds, N'Dama and Race Locale (West African Shorthorn with some Borgou genes), had similar prevalence levels both within ranch and village management systems (Table 2).
Table 2. Mean monthly trypanosome prevalence (%) in different breeds of cattle in two management systems, Avetonou.
|
Breed |
CREAT Ranch |
Villages |
||
|
Animal months |
Prevalence |
Animal months |
Prevalence |
|
|
N'Dama |
3233 |
5.0 |
2901 |
6.9 |
|
Race Locale |
3895 |
4.8 |
3992 |
7.5 |
Animal age had a large effect on trypanosome prevalence in cattle in which prevalence was twice as high in pre-weaners as in adult females, but in sheep prevalence was several times higher in adult females than in pre-weaners (Table 3).
Table 3. Mean monthly trypanosome prevalence (%) in different age classes of cattle and sheep in Avetonou and of sheep in Sokode.
|
Age class |
Avetonou |
Sokode |
||
|
Ranch cattle |
Village cattle |
Village sheep |
Village sheep |
|
|
Pre-weanersa |
4.1 |
11.2 |
1.2 |
0.7 |
|
Post-weanersb |
7.8 |
7.7 |
1.4 |
6.1 |
|
Adult femalesc |
2.3 |
5.5 |
4.0 |
6.7 |
|
|
a Cattle:<9 mth |
b Cattle: 9-36 mth |
c Cattle: >36 mth |
|
|
Sheep:<5 mth |
Sheep: 5-12 mth |
Sheep: >12 mth |
Species and intensity of trypanosome infections
T. vivax parasitaemias accounted for 89% of all parasitaemias in cattle, 98% in sheep and 94% in goats. There were no differences between cattle breeds or management systems for species of infection. Adult female cattle had a higher proportion of T. congolense parasitaemias (18%) than calves (3%), but age did not affect the species of trypanosome causing parasitaemia in sheep.
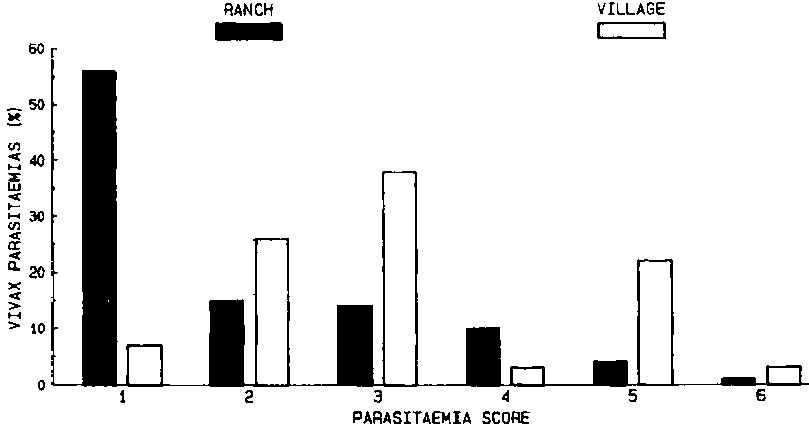
Intensity of T. vivax parasitaemia, measured on a scale from 1, low, to 6, high, was lower in ranch cattle (mean score 1.9) than in village cattle (3.2; Figure 1) and in village sheep (3.5). The cattle breeds, N'Dama and Race Locale, had similar parasitaemia scores in both management systems.
Table 4. Effect of number and intensity of parasitaemic months on cattle PCV, Avetonou.
|
No. of parasitaemic months during gestation |
Average PCV during gestation (%) |
No. and intensity of parasitaemic months during lactation |
Average PCV during lactation (%) |
||||
|
No |
Mean |
s.e. |
No |
Mean |
s.e. |
||
|
0 |
146 |
32.7 |
0.33 |
0 |
131 |
32.0 |
0.43 |
|
1 |
39 |
31.2 |
0.61 |
1 Low |
18 |
31.5 |
0.82 |
|
2 or more |
19 |
29.3 |
0.87 |
1 High |
13 |
30.4 |
0.96 |
|
|
|
2 or more |
11 |
28.5 |
1.06 |
||
|
Significance |
*** |
Significance |
* |
||||
*P<0.05
***P<0.001
Trypanosome infection and other factors affecting PCV
Trypanosome infection of the individual depressed its own PCV in cattle (Table 4) and in sheep (Table 5), but infection of the dam did not depress the PCV of her progeny. In lambs there were too few infections to test their effect on PCV. Parasitaemia with a high score depressed the PCV of cattle more than parasitaemia with a low score (Table 4). The results for the effect of Trypanosome infection during the gestation and during the lactation or pre- and post-weaning suggest that they may depress PCV cumulatively (Table 6). Some systematic environmental factors, for example, herd/flock, lamb birth type, season of parturition/birth, affected PCV.
Table 5. Effect of number of parasitaemic months during gestation and during lactation on average PCV of Djallonke ewes, Avetonou.
|
Number of parasitaemic months |
Average PCV during gestation, % |
Average PCV during lactation, % |
||||
|
No. |
Mean |
s.e. |
No. |
Mean |
s.e. |
|
|
0 |
199 |
26.8 |
0.28 |
173 |
25.0 |
0.35 |
|
1 |
20 |
25.4 |
0.98 |
18 |
23.8 |
1.16 |
|
2 or more |
8 |
25.0 |
1.08 |
8 |
22.6 |
1.21 |
|
Significance |
P<0.07 |
P<0.07 |
||||
Table 6. Effect of number of parasitaemic months pro- (0-8 months) and post-weaning (9-15 months) on average PCV post-weaning of cattle, Avetonou.
|
No. of parasitaemic months |
No. |
Mean |
s.e. |
|
|
Pre-weaning |
Post-weaning |
|||
|
0 |
0 |
18 |
30.5 |
0.99 |
|
1 or more |
0 |
11 |
29.0 |
1.20 |
|
0 |
1 or more |
19 |
28.8 |
1.01 |
|
1 or more |
1 or more |
18 |
27.9 |
0.98 |
|
Significance |
Pre-weaning |
NS |
||
|
|
Post-weaning |
NS |
||
|
Interaction |
NS |
|||
Trypanosome infection and reproductive performance
Trypanosome infection in the cow during 6 months post-partum, but not during 3 months pre-partum, significantly delayed subsequent calving (Table 7). There was a tendency for cows with low average PCV during 6 months post-partum to have longer intervals (Table 8).
Table 7. Effect of number of parasitaemic months pre- and postpartum on subsequent calving interval (days), Avetonou.
|
No. of parasitaemic months |
No. |
Mean |
s.e. | |
|
During 3 months pre-partum | ||||
|
|
0 |
130 |
423 |
14.9 |
|
|
1 or more |
15 |
426 |
26.0 |
|
During 6 months post-partum | ||||
|
|
0 |
116 |
397 |
19.9 |
|
|
1 or more |
29 |
452 |
23.5 |
|
Significance | ||||
|
|
3 months pre-partum |
NS | ||
|
|
6 months post-partum |
* | ||
|
|
Interaction |
NS | ||
*P<0.05
Table 8. Effect of average PCV during 6 months post-partum on subsequent calving interval (days), Avetonou.
|
Average PCV during 6 months post-partum |
No. |
Mean |
s.e. |
|
<29 |
29 |
419 |
17.0 |
|
29-31 |
34 |
422 |
19.1 |
|
32-34 |
47 |
407 |
17.3 |
|
>34 |
24 |
396 |
20.9 |
|
Significance |
|
NS |
|
Trypanosome infection during 4 months post-partum and average PCV during the same period did not affect subsequent lambing interval in Avetonou. Neither did Trypanosome infection during gestation affect lamb litter size, but ewes with the highest average PCV during gestation tended to have the largest litters.
Trypanosome infections and liveweights.
Liveweights of cows and their calves were not affected by number nor intensity of parasitaemic months during the gestation and pre-weaning periods. PCV was not related to liveweights in cows nor in calves, pre- or post-weaning, but the lowest PCV class of cows tended to have the lightest weights. Ewe and lamb weights were not depressed by Trypanosome infection in the ewe, but sheep with the lowest PCV tended to have the poorest performance.
Trypanosome infection and ewe productivity
Trypanosome infection in the ewe depressed the ewe productivity indices, litter weight per ewe per year, per unit weight of ewe and per unit metabolic weight, by 15-18%, but the differences did not reach statistical significance (Table 9). Ewes with the highest PCV during lactation tended to have the highest estimates of productivity.
Table 9. Effect of number of parasitaemic months during lactation of the Djallonke ewe on her productivity, Avetonou.
|
No. of parasitaemic months |
No |
PI1 (kg) |
PI2 (kg) |
PI3 (kg). |
|||
|
Mean |
s.e. |
Mean |
s.e. |
Mean |
s.e. |
||
|
0 |
150 |
15.4 |
1.26 |
0.77 |
0.608 |
1.64 |
0.136 |
|
1 or more |
19 |
13.0 |
2.37 |
0.59 |
0.115 |
1.36 |
0.256 |
|
Significance |
NS |
NS |
NS |
||||
PI1 Weight of weaner lamb produced per ewe per year, kg.
PI2 Weight of weaner lamb produced per kg of ewe per year.
PI3 Weight of weaner lamb produced per kg metabolic weight of ewe per year.
Trypanosome infection at these sites was caused predominantly by T. vivax. Variation between years, locations, livestock species and age groups were important influences on the level of trypanosome parasitaemia, and variation between management systems/locations gave large differences for the intensity of T. vivax parasitaemia. Trypanosome infection depressed PCV of these trypanotolerant cattle and sheep and depressed the reproductive performance of cattle but not of sheep. Liveweights in cattle and sheep were not affected by trypanosome infection. Despite the small effect of trypanosome infection on the individual production characters of Djallonke ewes and their lambs, total ewe productivity was depressed by 15 to 18%.
While trypanosomiasis was not apparently a major factor affecting individual production characters, aggregate and long-term effects may be important constraints on the livestock productivity even of these trypanotolerant populations.
ILCA. 1986. The ILCA/ILRAD Trypanotolerance Network: Situation Report, December 1985. Proceedings of a Network Meeting held at ILCA, Nairobi. International Livestock-Centre for Africa, Addis Ababa.
Murray, M., J.C.M. Trail, D.A. Turner and Y. Wissocq. 1983. Livestock Productivity and Trypanotolerance. Network Training Manual. Addis Ababa: ILCA.
![]()
![]()
![]()