![]()
![]()
![]()
P. ITTY, S. CHEMA, G.D.M. d'IETEREN, J. DURKIN, S.G.A. LEAK, J.H.H. MAEHL, S.H. MALOO, F. MUKENDI, S.M. NAGDA, J.M. RARIEYA, W. THORPE and J.C.M. TRAIL
Introduction
Description of study
Cost-benefit analysis of chemoprophylaxis
Cost-benefit analysis of cattle production
Conclusion
References
Appendix 1. Costs of production inputs
Appendix 2. Cost-benefit analysis results of cattle production
A study assessing the effects of trypanosomiasis on the health and productivity of East African Zebu cattle was carried out at Muhaka, Coast Province, Kenya from 1982 to 1986. The study had two phases, the first from June 1982 to April 1984 for the collection of baseline data, and the second, from April 1984 to October 1986, for the estimation of the effects of a prophylactic trypanocidal drug regime. The baseline study has been described by Maloo et al. (1985) and the results reported by ILCA (1986). The health and productivity results of the experimental phase are reported by Maloo et al. in article 29 of these Proceedings, while this paper presents results of a cost-benefit analysis of the chemoprophylaxis regime and of the cattle production sector as a whole.
The Muhaka area lies in the coconut/cassava agro-ecological zone of the Coast Province (Jaetzold and Schmidt, 1983). Within the agricultural sector, crops are more important than livestock and cattle more numerous than small ruminants. All cattle are grazed on communal land and trypanosomiasis is the main disease. Herd mean monthly trypanosome prevalence ranged from 1.2 to 6.8% during the period of this study.
Three ethnic groups are settled in the region. The Digos are found on the coastal strip; they are fishermen and farmers and cattle represent first a means of investment and a source of cash income and, second, a source of milk and meat. Towards the interior are the Kambas, farmers who keep cattle mainly as a source of traction, then as a source of cash income and then of milk and meat. In the hinterland the Duruma tribe are herders.
Some 700 East African Zebu in 17 herds were included in the baseline study and 16 herds were present throughout the experimental phase. The herds were representative of those on the 15 km coastal strip, most of them belonging to Digos and a few to Kambas. Herds were composed of animals of several owners, each owner placing his animals with different friends or relatives, mainly to spread the risks in case of diseases, drought etc. At the beginning of the chemoprophylaxis experiment in April 1984, approximately 2/3 of adults and 2/3 of young stock within each herd were allocated to the trypanocidal prophylactic drug treatment group, with the remaining 1/3 maintained as controls. A system of allocation of new born calves was implemented, with those selected for prophylaxis receiving their first treatment when they reached 60 kg body weight (at, on average, 8 to 9 months of age). In the prophylactic groups Isometamidium chloride (Samorin) treatments took place in April, July and October each year at a dosage of 0.5 mg a.i./kg liveweight and Diminazene aceturate (Berenil) treatments each January at a dosage of 3.5 mg/kg liveweight. Animals of either group detected as parasitaemic or showing clinical symptoms were therapeutically treated with Berenil at the same prescribed dosage.
For the biological and economic analyses some herds were merged because of the small numbers of animals in individual herds. The mainly Kamba herds situated towards the interior were grouped, as were two neighbouring herds nearer the coast. As a result ten rather than sixteen herds were considered in the analyses, their size ranging from 41 to 128 head of cattle.
The cost-benefit analyses were carried out using ILCA's Microcomputer Herd Model (von Kaufmann et al., 1987) after some modifications were made to the model to allow the more detailed consideration of health interventions and to adapt the model to the specific requirements of the Muhaka study. The following data were required for the model, the herd structure, the biological productivity data, the production inputs and the costs of these as well as the price of outputs; these are presented for each herd in Appendices 1 and 2. The model calculates on a yearly basis over a 10-year period the evolution of the herd structure and the inputs and outputs. A cost-benefit analysis is then performed with the three following outputs being considered in economical terms: liveweight, milk sales and added herd value. For the various analyses of this study, the model's automatic culling rule was used. By choosing this option the number of breeding cows does not increase above its initial level which in turn stabilizes the herd structure after a few years.
The analyses were comparisons between the prophylactic and the non-prophylactic groups (with and without intervention) within each herd.
Table 1. Number of prophylactic trypanocidal drug treatments given according to weight category per year and per animal in the prophylactic group for all herds.
|
Weight category |
<60 kg |
>60 kg |
|
Samorin |
0 |
3 |
|
Berenil |
0 |
1 |
Table 2. Overall annual number of therapeutic Berenil treatments required per animal by age class and trypanocidal drug regime.
|
Trypanocidal drug regime |
Age class |
||
|
0-1 yr |
1-3 yrs |
>3 yrs |
|
|
Non-prophylactic |
0.25 |
0.38 |
0.72 |
|
Prophylactic |
0.23 |
0.17 |
0.26 |
All the parameters were considered by herd and prophylactic regime except for the mortality rates, which were mean values for each drug regime and the offtake rates, which were calculated on a herd basis. The production inputs considered in this analysis were only the trypanocidal drug requirements according to each regime; this assumes that other inputs were similar for both regimes (Tables 1 and 2 and Appendix 2, Table 2.1). At the 1987 exchange rate (US$1 = KSh.17), the 1986 and 1987 prices for Berenil were KSh.6.75 and 10.0/1.05g and for Samorin were Ksh.2.75 and 3.80/5g. The prices for meat and milk were KSh.5/kg liveweight and KSh.5/litre milk, respectively, and the interest (discount) rate was 12%. The production results show that the main overall difference between the non-prophylactic and the prophylactic groups was the lactation yield: 158 and 196 litres, respectively.
Results
Table 3 gives the results of the chemoprophylaxis cost-benefit analysis in terms of benefit/cost ratios (B/CR) and net present values (NPV). The internal rates of return (IRR) could not be used here because they can only be calculated if the initial investment is important and then is recovered during the following years, which is not the case for drug treatments which bring low but continuous costs.
Out of the ten herds, eight yielded positive NPVs (or B/CR greater than the break-even value of 1) at a 12% discount rate. The average performance amounted to a NPV of KSh.200, 302 (or USS11,782) and a B/CR of 3.7.
The rank order of the herds for the B/CR is exactly the same as that for the increase in lactation yield in the prophylactic group compared to the non-prophylactic group within each herd (Table 4). This clearly shows that the lactation-yield response to the use of Samorin was the key factor determining the results of the cost-benefit analysis.
Table 3. Benefit/Cost Ratios and Net Present Values by herd for chemoprophylactic compared to non-chemoprophylactic regime.
|
Herd No. |
Benefit/Cost Ratio |
Net present value (KSh.) |
Net present value (US$) |
|
1 |
-3.2 |
-17,258 |
-1,015 |
|
8 |
-0.1 |
-5,411 |
-318 |
|
9 |
1.4 |
7,510 |
442 |
|
6 |
2.0 |
6,620 |
389 |
|
3 |
5.2 |
24,369 |
1,433 |
|
2 |
5.3 |
18,742 |
1,102 |
|
5 |
6.0 |
27,055 |
1,591 |
|
4 |
6.3 |
51,719 |
3,042 |
|
7 |
7.0 |
34,320 |
2,019 |
|
10 |
10.8 |
26,943 |
1,585 |
Note: 1987 exchange rate: 1 US$ = KSh.17
Table 4. Comparison between the increase in lactation yield and the Benefit/Cost Ratio of the prophylactic groups within each herd.
|
Herd No. |
Lactation yield increase (%) |
Benefit/Cost Ratio |
|
1 |
27.3 |
-3.2 |
|
8 |
-10.9 |
-0.1 |
|
9 |
-5.6 |
1.4 |
|
6 |
9.6 |
2.0 |
|
3 |
28.8 |
5.2 |
|
2 |
27.6 |
5.3 |
|
5 |
45.6 |
6.0 |
|
4 |
60.6 |
6.3 |
|
7 |
54.9 |
7.0 |
|
10 |
101.2 |
10.8 |
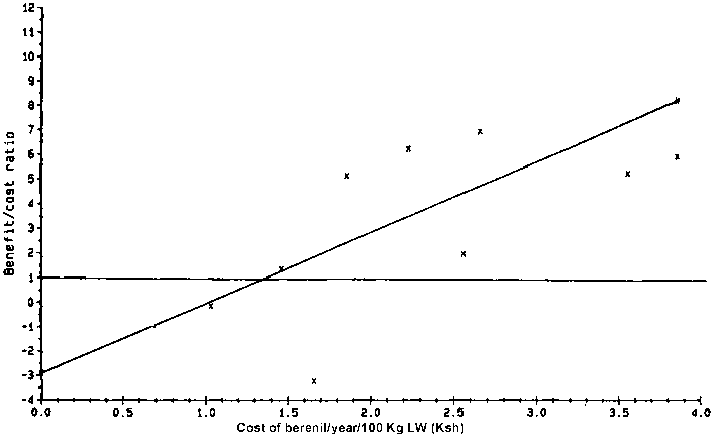
The two negative results, herds 1 and 8, reflect the higher biological performance (milk yield in particular) achieved by these herds under the non-prophylactic regime. The absence of a positive response to the prophylactic regime in those herds could possibly be explained by the fact that they had the lowest trypanosome prevalence during the study: 1.2% on average compared to the rest of the herds which ranged from 3.0 to 6.8%. This was further substantiated by the significant relationship (P<0.05) between the cost of Berenil treatments required in the non-prophylactic group of each herd and the B/CR of the prophylactic regime of these (Figure 1). This would indicate that the use of chemoprophylaxis is favourable only above a certain level above a certain level of trypanosomiasis risk.
Sensitivity analyses
Four sensitivity analyses were performed to examine the effects of the following situations:
1) increases in costs of Samorin due to higher requirements in frequency of administration or in dosage,2) increases in prices of trypanocidal drugs due to the decreasing strength of the Kenya shilling compared to European currencies,
3) increase in the meat price paid to the producers in Muhaka who receive a very low price at the moment, and
4) no response in lactation yield due to the use of chemoprophylaxis.
Effect of frequency of administration and dosage of Samorin
Table 5 shows that with an increase in frequency of Samorin administration to once every 2 months (+66% in costs of Samorin), or even with a doubled dosage of 1 mg a.i./kg liveweight (+ 100% in costs of Samorin) the overall outcome remained positive with a NPV of KSh.135, 094 for the latter. These higher doses of Samorin are already given in East African situations. It was assumed for this sensitivity analysis that the increase in Samorin administration would not lead to changes in productivity when compared to the present level of utilization of Samorin.
Table 5. Effect of frequency of administration and dosage of Samorin on Benefit/Cost Ratio and Net Present Value.
|
|
Benefit/Cost Ratio |
Net Present Value (RSh.) |
|
Samorin given 3 times/year at 0.5 mg a.i./kg LW |
3.70 |
200,302 |
|
Samorin given 5 times/year at 0.5 mg a.i./kg LW |
2.33 |
156,830 |
|
Samorin given 3 times/year at 1 mg/a.i./kg LW |
1.96 |
135,094 |
Effect of prices of Samorin and Berenil in Kenya shillings
Between 1986 and 1987 the prices of Samorin and Berenil recorded a 38 and 48% increase, respectively, in terms of Kenya Shillings. This was due to the decline in the Kenya Shilling relative to the British and German currencies. Table 6 shows the effect of this increase and of any further similar increase after 1987. Although the results are still largely positive (NPV: KSh.170, 982 if further increases were to be recorded) this illustrates the need for re-appraisals with regard to currency fluctuations.
Table 6. Effect of prices of Samorin and Berenil in KSh. or Benefit/Cost Ratio and Net Present Value.
|
|
Berenil price 1,05g |
Samorin price 5g |
Benefit/Cost Ratio |
Net Present Value (KSh.) |
|
1986 |
6.75 |
2.75 |
5.13 |
221,430 |
|
1987 |
10.00 |
3.80 |
3.70 |
200,302 |
|
Future |
14.81 |
5.25 |
2.64 |
170,982 |
Effect of output prices
The liveweight price of meat received by the herd owners of the study was very low: KSh.5/kg. The official producers' price, as set by the Kenya Government in 1986 for Kwale District where Muhaka is situated, was fixed at KSh.10/kg liveweight. In 1987 a deregulation of meat prices was introduced and these now follow market forces. The farmers in the study received a low price because their meat was sold only to friends and neighbours, thus not entering the commercial market. The market was supplied by animals sold by the herdsman from the hinterland, the Durumas.
A first sensitivity analysis was carried out with a meat price of KSh.10/kg liveweight which is the current market price paid by butchers. In the second sensitivity analysis the price of milk was increased from KSh.5 to KSh.7 per litre, the latter being the price received by producers who are able to deliver a regular supply of milk to the tourist industry of the Kenya south coast where the project is situated. Since there is a large shortage of fresh milk at the coast, there is a ready market for fresh milk in Mombasa, 35 km away and nearby at the hotels.
The results show (Table 7) that a meat price increase of 100% would yield a 16% increase in NPV (KSh.232,622) whereas the 40% increase in milk price would trigger off a NPV increase of 48% (KSh.294,414). The sensitivity to milk prices was thus far greater than to meat prices.
Table 7. Effect of producers' meat and milk prices on Benefit/Cost Ratio and Net Present Value.
|
Meat price/kg LW: |
KSh.5 |
KSh.10 |
KSh.5 |
|
Milk price/1: |
KSh.5 |
KSh.5 |
KSh.7 |
|
Benefit/Cost Ratio |
3.7 |
4.1 |
5.0 |
|
Net Present Value KSh. |
200,302 |
232,4622 |
297,414 |
Effect of lactation yield
If the lactation yield had remained at 158 litres instead of having increased to 196 litres, the returns to chemoprophylaxis would have hardly been positive B/CR:1,06; NPV: KSh.4,270. This indicates that virtually all the response to chemoprophylaxis in terms of productivity was through the milk yield which again shows the importance of milk and of the accuracy of its recording.
For this analysis, all the production parameters considered are those recorded for the prophylactic regime which showed superior results in the majority of cases. In order to look at the overall picture of cattle production in our survey herds, we had to simulate the veterinary services provided to the farmers since the existing veterinary inputs included a strong research component. (Details of costs and accounting used in this paper can be obtained from ILCA, P.O. Box 46847, Nairobi).
The veterinary service simulated provides a routine monthly visit and emergency visits to herds totalling 1500 head of cattle within a 35 km radius of the laboratory situated at Ukunda. During the monthly visit all animals are sampled for blood parasites, blood packed cell volume is estimated and trypanosome detection by the dark ground/phase contrast method is performed. The following items are to be accounted for:
|
a) Personnel:
|
1 Veterinarian (1/4 time*) |
|
1 Animal Health Assistant (1/2 time*) |
|
|
2 Junior Animal Health Assistants |
|
|
(1 full time, 1 1/2 time*) |
|
|
1 Driver (1/2 time*) |
|
|
*The remaining time could be spent working on other similar set-ups in the vicinity of this station. |
|
|
b) Laboratory:
|
Building and basic furniture |
|
Microscope (with phase contrast) |
|
|
Centrifuge (for capillary tubes) |
|
|
Electricity and water charges. |
|
|
c) Transport:
|
4 wheel drive double cabin (1/2 time*) |
|
Fuel |
|
|
*Half time used in another station. |
|
|
d) Acaricidal dip: Construction and maintenance. |
|
|
e) Material for blood examination in the field and treatments: |
|
|
|
1 Power generator |
|
Fuel |
|
|
Glassware |
|
|
Ear-tags |
|
The distribution of costs for veterinary services is given in Table 8. The total annual average cost per head of cattle over a 10-year period amounts to KSh.160.
Table 8. Distribution of costs for veterinary services
|
Personnel |
38.8% |
|
Field examination of blood* |
21.4% |
|
Transport* |
30.6% |
|
Microscope and centrifuge* |
4.8% |
|
Laboratory |
2.2% |
|
Dip |
1.8% |
*Items to be mainly accounted for in foreign currency.
Costs could be reduced by 19% (KSh.129 per head per year) if it was decided that only 1/3 of all the animals would need blood sampling every month, which is realistic particularly if chemoprophylaxis is adopted as a general policy. The accounting of the costs of these services was done rather expensively so as to remain on the conservative side.
The production input level at Muhaka was very low. Apart from the veterinary services, which are provided by the Government, the livestock owners only pay for drugs and, in some cases, for herdsman. The breakdown of the overall costs is as follows: Samorin 42%, Berenil 15.4%, acaricides 22.1% (dipping was performed every 2 weeks), anthelmintics 16.6% (all animals below 100 kg liveweight were drenched every three months) and other drugs (mainly antibiotics and vitamins) accounting for the remaining 3.9%. The average cost per animal per year totals KSh.35.
Although tick borne diseases do not seem to play a major role at the current dipping frequency, it might well be that in the future this would be increased to once a week as recommended by the veterinary services (especially if other breeds are going to be introduced). In this case the costs per head per year would increase by 22%, amounting to KSh.43. Out of the ten herds, six were looked after by herdsmen employed by the owners who paid them KSh.6,600 per year. In the other cases the size of the herds did not always justify the employment of a herdsman and therefore household members would take care of the cattle. Because of the difficulty in evaluating the time spent in the small herds to take the animals to pastures, to tether them, etc. and of the difficulty determining an opportunity cost of the family labour, these were not accounted for. Similarly, the costs of the local material (palms, wood, etc.) used in the construction of the kraals were not taken into account. Thus only the items which were actually paid for were priced.
Considering finally the total costs of production inputs required in Muhaka, 67.3% are due to the veterinary services, 17.6% to herding costs and 15.1% to veterinary drugs. This totals to an. average of KSh.223 per animal per year.
Results
The overall results are given in Table 9; returns were positive for all herds when no costs of veterinary services were taken into consideration. This is the situation as it appears to the producer since he does not pay for these services. Even when taking the costs of veterinary services into account, including the animals' blood sampling every month, the returns remain positive, indicating that from the Government and policy makers point of view, it does pay to provide these services to the livestock owners in Muhaka. On a herd basis, three herds yielded negative returns (B/CR: 0.88, 0.91, 0.98) when 100% of the animals provided blood samples, whereas when only 33% of the animals were sampled for blood, only one herd had a slightly negative result (B/CR at 0.99).
Table 9. Overall cost-benefit analysis results for cattle production
|
|
Benefit/Cost Ratio |
Internal Rate of Return |
Net Present Value |
|
|
KSh. |
US$ |
|||
|
No costs of veterinary services |
2.23 |
46.1 |
943,439 |
55,496 |
|
With costs of veterinary services, 100% of animals blood sampled |
1.12 |
18.1 |
183,500 |
10,794 |
|
With costs of veterinary services, 33% of animals blood sampled |
1.24 |
23.1 |
332,286 |
19,546 |
Sensitivity analyses
Sensitivity analyses were performed to see how the overall results would be affected by changes in drug costs due to higher usage of acaricides and trypanocidal drugs, in exchange rate and in lactation yield.
Effect of frequency of acaricidal dip and Samorin dosage
As Table 10 shows, the outcome would remain positive from the viewpoint of both the producer and the Government, even if the acaricidal dip frequency increased to once every week and the dosage of Samorin increased to 1 mg a.i./kg liveweight (in other words this corresponds to a doubling in costs of acaricides).
Table 10. Effect of frequency of acaricidal dip and Samorin dosage on overall cost-benefit results.
|
Acaricidal dip performed every week, Samorin dosage: 1 mg a.i/kg liveweight |
Benefit/Cost Ratio |
Internal Rate of Return |
Net Present Value (KSh.) |
|
No costs of veterinary services |
1.97 |
42.5 |
842,392 |
|
With costs of veterinary services, 100% of animal blood sampled |
1.05 |
14.8 |
82,454 |
Table 11. Effect of foreign exchange costs on overall cost-benefit results.
|
|
Foreign Exchange Costs |
|||
|
15% increase |
30% increase |
|||
|
B/CR |
NPV KSh. |
B/CR |
NPV KSh. |
|
|
No costs of veterinary services: |
2.17 |
919,307 |
2.10 |
894,942 |
|
With costs of veterinary services, 100% of the blood sampled: |
1.06 |
90,028 |
1.00 |
-2,159 |
Note: IRR could not be calculated for the technical reasons explained earlier.
Effect of foreign exchange costs on overall cost-benefit results
Since the Kenya shilling has been steadily losing ground in comparison to leading foreign currencies, sensitivity analyses were carried out to see the impact of a 15 and a 30% increase in costs incurred when buying foreign goods. Table 11 indicates that there would be a 5% reduction of the NPV to the producers due to a 30% increase of drug costs, whereas this would bring a very slightly negative NPV when seen from the Government's viewpoint. The larger reduction in the latter NPV is due to the fact that a rise in costs of foreign exchange would affect not only the drug costs but also those of the field examination of blood, transport, microscope and centrifuge. With the present trend of lower exchange rates for the Kenya shilling (up to -30% per annum compared to European and Japanese currencies), this shows that periodic reappraisals will be needed.
Effect of lactation yield on overall cost-benefit results
Table 12 shows that with the present meat price, the farmers would produce at a loss if their cattle were sold only for beef. In the Government's view it would be necessary to maintain a lactation yield of 196 litres to pay for the veterinary services. The values of 106 and 238 litres for milk lactation yield are the extreme mean results achieved by the survey herds and 196 litres is the overall mean result for the 10 herds. If the producers in Muhaka received a meat price of KSh.10/kg liveweight, they would break even without producing milk, whereas from the Government's perspective a lactation yield of 106 litres would be required. This again stresses the importance of milk production in the region.
Table 12 Effect of lactation yield on overall Net Present Values (Ksh.) of cost-benefit analyses.
|
|
Lactation yield, litres |
||||
|
0 |
106 |
196 |
238 |
||
|
Meat price: KSh.5/kg LW |
|||||
|
|
No costs of veterinary services |
-74,110 |
476,282 |
943,439 |
1,167,133 |
|
|
With costs of veterinary services, 100% of the blood sampled |
-834,049 |
-283,657 |
183,500 |
407,195 |
|
Meat price: KSh.10/kg LW |
|||||
|
|
No costs of veterinary services |
214,492 |
764,884 |
1,232,040 |
1,455,735 |
|
|
With costs of veterinary services, 100% of the blood sampled |
-545,447 |
4,945 |
472,102 |
695,796 |
Cattle production in the Muhaka area, where livestock are exposed to low- to medium-trypanosomiasis risk, was more profitable when cattle were treated prophylactically with trypanocidal drugs rather than when merely receiving therapeutic treatments. The prophylactic regime was still economical even if expenditure on the prophylactic drug, Samorin, was doubled.
On an individual herd basis, the superiority of the prophylactic drug regime was directly related to the increase in lactation yield and gave indications that the use of Samorin was economically favourable only above a certain level of trypanosomiasis risk.
The results presented in the study indicated the importance of milk production, both in terms of lactation yield and producer prices. Exchange rates were also important. Consequently the accurate recording of milk production should be an important component of similar studies, which should be also evaluated periodically to take account of fluctuating exchange rates.
Cattle production yielded positive rates of return to the producer and also covered the costs of veterinary services provided by the Government, even with a doubling of expenditure for Samorin and acaricides.
It thus appears that there is in this area, good prospects for development of cattle production with emphasis on milk, using trypanosomiasis prophylaxis. The Kenyan Government has already taken steps in this direction with the establishment of an artificial insemination unit which will introduce exotic dairy genes. The good economic performance presented here will have to be reassessed in the future because the situation will change in that the exotic crossbreds would possibly need more inputs in comparison to the present very low input levels and because, in the medium term, competition for land between crops and livestock will definitely increase. Opportunity cost of land will then have to be taken into account, whereas, for the moment, land is not a major constraint.
ILCA. 1986. Proceedings of a Network meeting held at ILCA, Nairobi, December 1985. ILCA, Addis Ababa, Ethiopia.
Jaetzold, R. and H. Schmidt. 1983. Farm management handbook of Kenya. Vol. II C. East Kenya. Ministry of Agriculture in collaboration with GAT of GTZ Nairobi, Kenya.
Maloo, S.H., P.G. Kimotho, S. Chema, J. Koskey, J.C.M. Trail and M. Murray. 1985. Health and productivity of East African Zebu under village management in a tsetse-infested area on the coast of Kenya. ISCTRC, 18th meeting, Harare, No. 113, pp. 182-186.
Von Kaufmann, R., J. McIntire, P. Itty and Edjigayehu Seyoum. 1987. User's Manual for ILCA's Microcomputer Herd Model. Addis Ababa: ILCA.
Table 1. Costs of veterinary services (KSh.) (All costs of imported goods are tax freer.
|
a) Personnel: | ||
|
Title |
Kenya Government civil service job group |
Annual gross salary* |
|
Veterinarian |
K |
87,760 |
|
Animal Health Assistant |
F |
36,940 |
|
Junior Animal Health Assistant |
C |
21,220 |
|
Driver |
C |
21,220 |
*Include housing allowance, pension scheme and food emoluments.
|
b) Laboratory: | |||
|
Item designation |
Purchase costs |
Lifetime |
Recurrent costs |
|
Building + basic furniture |
30,000 |
10 yrs |
3,000 every 4 yrs |
|
Microscope |
47,000 |
5 yrs |
4,700 per yr |
|
Centrifute |
12,000 |
5 yrs |
1,200 per yr |
|
Electricity charges |
|
|
3,000 per yr |
|
Water charges |
|
|
1,200 per yr |
|
c) Transport: | |||
|
Item designation |
Purchase costs |
Lifetime |
Recurrent costs |
|
4 Wheel drive double cabin |
286,000 |
5 yrs |
|
|
Fuel + wear & tear* |
|
|
24,000 per yr |
*Standard costs used by the Kenya Government for 4 WD vehicles: 3 KSh./km. 70 km covered per day for 114 days per year at this station.
|
d) Acaricide dip: | ||
|
Construction cost |
Lifetime |
Recurrent costs |
|
120,000 |
20 yrs |
3000 every 6 yrs |
|
e) Material for blood examination in the field and for treatments: | ||||
|
Item designation |
Purchase cost |
Lifetime |
Recurrent costs | |
|
Power generator |
8,000 |
5 yrs |
| |
|
Fuel and oil |
|
|
1000 per yr | |
|
Glassware, etc. | ||||
|
|
Syringe |
140 |
3 mths |
|
|
|
Needle |
0.80 |
1/10 injections |
|
|
|
Capillary tube |
0.75 |
1 per sample |
|
|
|
Slide |
0.62 |
1 per sample |
|
|
|
Cover slip |
0.47 |
1 per sample |
|
|
|
Vacutainer holder |
3 |
1 yr |
|
|
|
Vacutainer tube |
2.9 |
recycled 3 times |
|
|
|
Vacutainer needle |
2.2 |
recycled 1 time |
|
Glassware costs per animal and per year: KSh.46.
Ear-tags: KSh.5.3 per animal (all animals tagged in year 1 and all new born thereafter).
Table 1.2 Annual cost of treatment in Kenya shillings per 100 kg liveweight by age class and herd.
|
Herd No. |
0-1 yr |
1-3 yrs |
>3 yrs. |
|
1 |
15.9 |
30.9 |
16.8 |
|
2 |
16.4 |
29.8 |
16.5 |
|
3 |
15.6 |
30.0 |
15.7 |
|
4 |
15.8 |
30.3 |
16.0 |
|
5 |
15.7 |
29.5 |
16.1 |
|
6 |
15.3 |
31.2 |
16.6 |
|
7 |
15.7 |
30.9 |
15.7 |
|
8 |
16.4 |
30.3 |
15.2 |
|
9 |
17.1 |
31.6 |
17.3 |
|
10 |
15.9 |
32.0 |
18.0 |
|
Overall |
15.9 |
30.5 |
16.6 |
Annual cost of acaricides per animal (chemical only): KSh.7.8
Table 1.3 Annual average treatment costs expressed per animal and per 100 kg liveweight* (KSh.) with herd structure in Year 1 taken as basis.
|
Herd No. |
Cost/animal |
Cost/100 kg liveweight |
|
1 |
30.88 |
26.75 |
|
2 |
32.31 |
24.80 |
|
3 |
33.53 |
25.50 |
|
4 |
34.85 |
23.95 |
|
5 |
36.06 |
23.90 |
|
6 |
35.14 |
25.65 |
|
7 |
31.09 |
25.09 |
|
8 |
33.51 |
24.40 |
|
9 |
39.16 |
25.75 |
|
10 |
36.52 |
26.05 |
|
Overall |
35.36 |
25.3 |
*Note: Since some drug costs are per weight and others per head, a single measurement of treatment costs is not possible.
Table 1.4 Distribution and total of average annual costs per animal and herd.
|
|
Percentage of costs incurred by |
|||
|
Herd No |
Total average annual costs per head (KSh.) |
Veterinary services |
Treatment drugs |
Herding costs |
|
1 |
185.9 |
83.3 |
16.7 |
0.0 |
|
2 |
237.0 |
89.6 |
10.4 |
0.0 |
|
3 |
258.7 |
57.6 |
12.3 |
30.1 |
|
4 |
284.0 |
73.6 |
9.1 |
17.3 |
|
5 |
272.0 |
54.9 |
13.3 |
31.8 |
|
6 |
257.3 |
59.0 |
12.7 |
28.3 |
|
7 |
255.8 |
58.6 |
12.3 |
29.1 |
|
8 |
182.8 |
82.6 |
17.4 |
0.0 |
|
9 |
190.1 |
80.1 |
19.9 |
0.0 |
|
10 |
217.6 |
68.0 |
15.3 |
16.7 |
|
Overall |
222.7 |
67.3 |
15.1 |
17.6 |
Table 2.1 Cost benefit analysis results of cattle production by herd, no costs of veterinary services.
|
Herd No. |
Benefit/Cost/Ratio |
Internal Rate of Return |
Net Present Value (KSh) |
|
1 |
2.21 |
37.2 |
35,853 |
|
2 |
3.77 |
69.4 |
97,221 |
|
3 |
2.13 |
53.0 |
86,150 |
|
4 |
2.39 |
52.8 |
136,196 |
|
5 |
1.84 |
40.4 |
65,535 |
|
6 |
2.05 |
48.1 |
90,714 |
|
7 |
1.80 |
39.2 |
63,827 |
|
8 |
2.06 |
32.9 |
36,842 |
|
9 |
2.93 |
53.1 |
230,659 |
|
10 |
2.64 |
58.0 |
207,831 |
|
Overall |
2.23 |
46.1 |
943,439 |
Table 2.2 Cost-benefit analysis results of cattle production by herd, with costs of veterinary services, 100% of the blood sampled.
|
Herd No. |
Benefit/Cost Ratio |
Internal Rate of Return |
Net Present Value (KSh) |
|
1 |
0.91 |
n.a. |
-6,422 |
|
2 |
1.41 |
36.1 |
43,512 |
|
3 |
1.17 |
22.3 |
23,283 |
|
4 |
1.21 |
23.3 |
39,993 |
|
5 |
1.06 |
15.4 |
8,397 |
|
6 |
1.13 |
19.7 |
20,950 |
|
7 |
0.98 |
n.a. |
-2,798 |
|
8 |
0.88 |
n.a. |
-9,982 |
|
9 |
1.35 |
27.1 |
91,408 |
|
10 |
1.29 |
27.6 |
75,168 |
|
Overall |
1.12 |
18.1 |
183,500 |
n.a. = Not available because of more than one change of sign in the annual aggregate cash flows over the 10-year period.
Table 2.3 Cost-benefit analysis results of cattle production by herd, with costs of veterinary services, 33% of the blood sampled.
|
Herd No. |
Benefit/Cost Ratio |
Internal Rate of Return |
Net Present Value (KSh) |
|
1 |
1.03 |
13.1 |
1,689 |
|
2 |
1.69 |
41.7 |
54,099 |
|
3 |
1.28 |
27.6 |
25,650 |
|
4 |
1.34 |
28.6 |
59,171 |
|
5 |
1.16 |
19.9 |
19,639 |
|
6 |
1.24 |
24.6 |
34,487 |
|
7 |
1.08 |
16.0 |
10,262 |
|
8 |
0.99 |
n.a. |
-851 |
|
9 |
1.51 |
31.5 |
118,379 |
|
10 |
1.44 |
33.0 |
101,386 |
|
Overall |
1.24 |
23.1 |
332,286 |
n.a. = Not available because of more than one change of sign in the annual aggregate cash flows over the 10-year period.
![]()
![]()
![]()