![]()
![]()
![]()
by
Kofi Manso Essuman
Fish processing consultant, Integrated
Development of Artisanal Fisheries Project
Yeji, Ghana
|
Abstract Fresh, smoked and salted/dried Tilapia and Chrysichthys sp. were purchased from landing sites on the Volta Lake and market at Yeji to determine the heavy metal content in the fish samples. Initial results from the Nogouchi Memorial Institute for Medical Research showed very high levels of mercury. Consequently, similar fish samples were presented to the laboratories of the Ghana Atomic Energy Commission and the Societé Générale de Surveillance (SGS) for verification. Results from these laboratories however indicated very low levels of mercury in the fish samples. One interesting trend that was observed from the results was the relatively high heavy metal content in salted dried fish, suggesting that salt and other chemicals used for curing may be the source. |
1. INTRODUCTION
The Integrated Development of Artisanal Fisheries Project (IDAF-II-GHA/93/008) was in collaboration between the Government of Ghana and the UNDP/FAO. The main objective of the project was to improve the living conditions of over 50 000 people whose livelihood depends on the Volta Lake. The project aimed at increasing fish supply from the lake, as a means of satisfying national protein needs and creating employment opportunities.
The first phase of the project commenced in January 1989 and concluded in November 1992. One of the major activities of the second phase which, started in 1996 and ended in December 1999, was the construction of a Community Fisheries Centre (CFC) with processing facilities, training and social services to meet the needs of fishermen and fish processors. The evaluation of the nutrient composition and heavy metal content in fresh and processed fish was to be carried out during the second phase of the project as part of fish handling and processing activities to monitor the quality of fresh and processed fish from Yeji.
2. MATERIALS AND METHODS
The fish samples were analysed at the laboratories of the Ghana Atomic Energy Commission (GAEC), the Nogouchi Memorial Institute for Medical Research (NMIMR) and Societé Générale de Surveillance (SGS), all in Accra. These institutions were contracted to determine mercury, arsenic, lead and cadmium in the various fish samples. Smoked and salted/dried fish were purchased from the Yeji market.
Fresh fish was purchased from fishermen at the landing sites in Yeji and kept chilled in ice during transport from Yeji to the laboratories in Accra. Tilapia and Chrysichthys, the two major fish species caught in the lake were selected for the test. At the laboratory, the fresh fish were kept frozen in a deep freezer till required. The flesh of the fish was manually separated for analysis. GAEC and SGS determined heavy metal content using Atomic Absorption Spectroscopy. NMIMR determined metal content by chemical analysis.
3. RESULTS
Mercury
The results of the analysis by NMIMR of the mercury content in fresh and processed fish indicated very high levels of mercury. The fresh samples reported levels ranging from 10 to 30 ppm. The salted/dried and smoked Tilapia contained 40-44 and 21-30 ppm of mercury respectively. Corresponding values for salted Chrysichthys were 23-28 ppm, and 16-23 ppm for smoked samples.
The mercury level in the third batch of processed fish samples was also high, ranging from 14 ppm for smoked Tilapia to nearly 53 ppm in salted Tilapia. The mercury content in fresh Tilapia in this batch was however significantly low (4.0 ppm) compared to the earlier samples. The level in fresh Chrysichthys was too low to be detected.
Mercury was not detected in any of the fresh, salted and smoked fish samples analysed at the Ghana Atomic Energy Commission in December 1996 and the results of the analysis at SGS laboratories in June 1997 indicated that the level of mercury in the samples was below 0.01 ppm. Table 1 further shows that all the analysis for mercury carried out by SGS in March, June and September 1998 indicated levels below 0.20 and 0.25 ppm for all the fresh and processed fish presented.
The limits for mercury in fish varies from 0.01 ppm with 0.5 ppm as the value frequently quoted. Problems of mercury poisoning may occur if the concentration in fish reaches 5 ppm. This may occur in very heavily polluted waters. The results from SGS and GAEC seem plausible and suggest that there is very little or no mercury in fresh and processed fish. Mercury in salted fish was relatively higher than in fresh samples. This suggests that if mercury is present at all then the salt used for curing could be a major source.
Table 1. Heavy metal concentration in fish
|
Sample identity |
NMIMR |
GAEC |
SGS 1 |
SGS 2 |
SGS 3 |
SGS 4 |
||
|
Aug 96 |
Mar 97 |
Mar 97 |
Dec 96 |
Jun 97 |
Mar 98 |
Jun 98 |
Sep 98 |
|
|
Mercury (Parts per million-ppm) |
||||||||
|
Fresh Tilapia |
20.00 |
30.00 |
4.00 |
ND |
< 0.01 |
< 0.25 |
< 0.20 |
< 0.20 |
|
Fresh Chrysichthys |
10.00 |
21.33 |
TLD |
- |
- |
< 0.25 |
< 0.20 |
< 0.20 |
|
Smoked Tilapia |
21.00 |
30.00 |
13.71 |
- |
< 0.01 |
< 0.25 |
< 0.20 |
< 0.20 |
|
Smoked Chrysichthys |
16.70 |
23.33 |
20.57 |
ND |
- |
< 0.25 |
< 0.20 |
< 0.20 |
|
Salted Tilapia |
40.66 |
44.67 |
52.57 |
ND |
< 0.01 |
< 0.25 |
< 0.20 |
< 0.20 |
|
Salted Chrysichthys |
23.30 |
28.10 |
29.71 |
- |
- |
< 0.25 |
< 0.20 |
< 0.20 |
|
Lead (Parts per million-ppm) |
||||||||
|
Fresh Tilapia |
0.70 |
1.03 |
0.89 |
- |
< 0.01 |
< 2.5 |
< 2.00 |
< 2.00 |
|
Fresh Chrysichthys |
0.50 |
1.44 |
0.80 |
- |
- |
< 2.5 |
< 2.00 |
< 2.00 |
|
Smoked Tilapia |
1.00 |
2.67 |
1.24 |
- |
< 0.01 |
< 2.5 |
< 2.00 |
< 2.00 |
|
Smoked Chrysichthys |
1.60 |
6.31 |
1.76 |
- |
< 0.01 |
< 2.5 |
< 2.00 |
< 2.00 |
|
Salted Tilapia |
1.90 |
4.89 |
2.80 |
- |
< 0.01 |
< 2.5 |
< 2.00 |
< 2.00 |
|
Salted Chrysichthys |
2.80 |
4.62 |
1.96 |
- |
< 0.01 |
< 2.5 |
< 2.00 |
< 2.00 |
|
Arsenic (Parts per million-ppm) |
||||||||
|
Fresh Tilapia |
20.50 |
1.69 |
TLD |
ND |
< 0.01 |
<0.25 |
<0.20 |
<0.20 |
|
Fresh Chrysichthys |
21.00 |
TLD |
TLD |
- |
- |
<0.25 |
<0.20 |
<0.20 |
|
Smoked Tilapia |
17.50 |
TLD |
TLD |
ND |
< 0.01 |
<0.25 |
<0.20 |
<0.20 |
|
Smoked Chrysichthys |
18.00 |
TLD |
TLD |
- |
- |
<0.25 |
<0.20 |
<0.20 |
|
Salted Tilapia |
45.00 |
3.04 |
2.00 |
ND |
< 0.01 |
<0.25 |
<0.20 |
<0.20 |
|
Salted Chrysichthys |
23.30 |
TLD |
4.22 |
- |
< 0.01 |
<0.25 |
<0.20 |
<0.20 |
|
Cadmium (Parts per million-ppm) |
||||||||
|
Fresh Tilapia |
0.08 |
0.23 |
0.05 |
- |
< 0.01 |
< 2.5 |
< 2.00 |
< 2.00 |
|
Fresh Chrysichthys |
0.07 |
0.17 |
0.04 |
- |
- |
< 2.5 |
< 2.00 |
< 2.00 |
|
Smoked Tilapia |
0.08 |
0.06 |
0.09 |
- |
< 0.01 |
< 2.5 |
< 2.00 |
< 2.00 |
|
Smoked Chrysichthys |
0.08 |
0.09 |
0.09 |
- |
< 0.01 |
< 2.5 |
< 2.00 |
< 2.00 |
|
Salted Tilapia |
0.18 |
TLD |
0.12 |
- |
0.68 |
5.00 |
< 2.00 |
< 2.00 |
|
Salted Chrysichthys |
0.15 |
0.05 |
0.10 |
- |
- |
5.00 |
< 2.00 |
< 2.00 |
Lead
The concentration of Lead in the first and third batches of fresh and processed fish samples analysed by NMIMR varied from 0.7 to 2.8 ppm. This closely agrees with the results from SGS who also reported that the lead concentration was less than 0.01, 2.0 and 2.5 ppm for all the batches analysed. The lead content in the second batch of fresh Tilapia, Chrysichthys and smoked Tilapia that were analysed by NMIMR was also below 3 ppm. However, the level of lead in salted Tilapia, Chrysichthys and smoked Chrysichthys ranged from 4.6 to 6.3 ppm, which are higher than the SGS values.
Arsenic
Arsenic is one of the heavy metals that can be toxic in food if present in high amounts. The NMIMR results of tests carried out on the first batch of fresh and processed fish samples indicated levels ranging from approximately 18 ppm in smoked fish to 45 ppm in salted Tilapia. These values are seemingly high. Arsenic was however not detected in most of the second and third samples analysed in March 1997 except in salted Tilapia and Chrysichthys which recorded 3 ppm and 4 ppm respectively. These results are comparable to data from SGS.
The high levels found in salted products suggest that common salt could be the source of arsenic. From the results of SGS, arsenic content in first samples of fresh and processed Tilapia analysed in 1997 was below 0.01 ppm. For the three samples tested in 1998 Arsenic concentration was less than 0.25 ppm.
Cadmium
The concentration of cadmium reported by NMIMR was low ranging from 0.04 ppm to 0.18 ppm. These values compare favourably with the results of SGS who reported concentrations below 0.01 ppm and 2.5 ppm for the 1997 and 1998 samples respectively. It is interesting to note from the SGS data that the arsenic content in all the fish samples analysed in June 1997 was below 0.01 ppm except salted Tilapia, which recorded 0.68 ppm. Again for samples analysed in March 1998, the cadmium content was below 2.5 ppm except for salted Tilapia and Chrysichthys which contained 5.0 ppm. It can be inferred from this observation that common salt probably contributed to the reported high level of arsenic in the cured fish.
A summary of the results of analysis issued by the 3 laboratories is shown in Table 1.
4. CONCLUSIONS
- From the reports of NMIMR, SGS and GAEC, the concentration of cadmium in fish samples analysed was generally low. NMIMR reported significantly high levels of mercury and arsenic. In the case of mercury, the concentrations were far in excess of the toxic limits. These results are therefore doubtful. The results from the 4 batches of fish analysed by SGS and GAEC however suggest that the concentration of heavy metals in fresh and processed fish is low.
- In general the results tend to suggest that the crude salt used for curing may be a good source of some of the heavy metals which were detected in the salted/dried samples. The heavy metals may also come from some of the unapproved insecticides commonly used for curing.
5. RECOMMENDATIONS
- Assessment of heavy metal content in fresh and processed fish harvested from the Volta Lake should be continued. This should be done twice annually. The analysis should be limited to mercury, lead, arsenic and cadmium. Fish samples from other strata of the Volta Lake especially fish from Akosombo and Kpong should be included in the assessment.
- Samples of water from the various strata of the Volta Lake as well as crude salt used for salting should be analysed to determine their heavy metal content.
by
H.D.J. Mrosso
Tanzania Fisheries Research
Institute
Mwanza, Tanzania
Kenneth Werimo
Kenya Marine and Fisheries Research
Institute
Kisumu, Kenya
|
Abstract This document reports on a fish poisoning study conducted in Lake Victoria waters of Tanzania, Kenya and Uganda. The study was mainly by aquarium experiments and, to a smaller extent, by experimental fishing. An inventory of poisons used at the time in catching fish in the three countries was established through interviews and surveys along the lake shores. The findings of the study show that among the riparian countries Tanzania was the most affected in terms of the variety of poisons used and extent of the illegal fishing. The most commonly used poisons in Tanzania were the pesticides Thiodan and Diazinon. Poisonous plants were also used such as Euphorbia tirucalli and Tephrosia vogelli. Kenya followed Tanzania in fish poisoning but it was found from the surveys that pesticides were virtually not used in catching fish. Poisonous plants used in Kenya were Cassia fallacina, Cassia didymobotra and Albizia gummifera. There was no information from Uganda on fish poisoning. The concentrations used for pesticides were not clearly defined but about 2 litres of the pesticide concentrate were applied on an area of 500 metres long and 20-50 metres wide from the shores with varying depths. The concentrations of the plant poisons used were almost uniform for all plants used whereby 5 kg were applied on an area 90, metres long and 20-50 metres wide from the shores with depths of about 2 metres. From the aquarium experiments MLC and LC50 values of the studied poisons were estimated when applied on Alestes, Oreochromis nilotica and Haplochromis sp. Susceptibility of different sizes of Oreochromis nilotica was established and it was found that smaller sizes were more susceptible. Susceptibility of different species varies with the applied poisons. In general Cassia fallacina is more effective than Albizia gummifera and among the pesticides Thiodan is more effective than Diazinon. Noticeable differences were observed between poisoned and non-poisoned fish in biological and organoleptic characteristics. Each poison had a generally different pathological manifestation on different fish species. Among the processing techniques, smoking and salting had the greatest buffering effect against deterioration due to poisoning. |
1. INTRODUCTION
Fish poisoning as a method of fishing is known to have been practised in China as early as 2200 B.C. using chemicals originating from plants. The practice also occurred in North and South America, Europe and Asia (Brandt, 1972). Along the Lake Victoria shores, fish poisoning is said to have been practised for the last 100 years (Tengo, 1997). The poisons used were essentially originating from plants, which were harvested, crushed, cut to pieces or pulverised and sprinkled in the water. This practice also used to be applied in rivers draining into the lake and fish were caught at the river mouths either by hand or baskets/traps as they floated.
A huge and fast-growing human population in both urban and rural areas surrounds Lake Victoria. The urban centres produce a lot of industrial and domestic wastes with varying impacts on the lake environment. Some of the industrial effluents are pollutants, which may not only affect the lake water quality but also organisms living in there. The rural sources of pollution are mainly agricultural applications of pesticides, fertilisers as well as erosion of the tilled land.
Apart from the urban and rural sources of pollution fish poisoning using pesticides may add chemicals directly into the lake water. These include organochlorines and organophosphorus compounds among others. Persistence (DT50, time taken for 50% of the chemical to degrade) of some organochlorines in the environment has been documented (Akerblom, 1995). Dieldrin and akirin degrade to half the original concentration after 4-7 years while hexachlorobenzene (an insoluble fungicide) is known to take many years. Organophosphorus compounds are known to be less persistent in the environment (DT50 for etrimofos is 0.5-2 weeks and fenamiphos is 17 weeks (residual activity).
When present in non-lethal concentrations, traces of the organochlorines in aquatic environment tend to accumulate in living organisms. As the food chain builds up, the higher trophic level animals tend to concentrate the chemical in their body tissues many fold the concentrations found in the lower trophic levels and of course the water. Eventually man who occupies the topmost trophic level accumulates the chemicals to the highest concentrations in the body.
It is known that a rise of 10°C of water temperature doubles the rate of accumulation of organochlorines in the body of fish living in contaminated water (Edgren et al, 1979). By virtue of being a tropical lake, the water temperature of Lake Victoria is considerably high (23°C-26°C average annual temperature) (Lowe-McConnel, 1994). This should be a cause for alarm for areas where fish poisoning is practised. Fish from Lake Victoria may contain high levels of the pesticides and thus every possible effort should be made to prevent the practice from being common in the lake especially in connection with organochlorines. Edgren et al (1979) asserted that temperature differences have no observable influence on the elimination rate from the fish body and thus further emphasising that organochlorines tend to bio-accumulate irreversibly in the fish body.
Ongoing stock assessment has revealed that the introduction of Nile perch in the lake led to a decrease in population of many indigenous fish species (e.g. Nile tilapia, Haplochromines, Brycinus sadleri, Clarias, etc). These species are not, however, exported; they are rather fished for local consumption. The non-selective fish poisoning carried out in shallow waters may further decrease the population of the threatened species.
The use of pesticides in fishing has been taken up by fishermen because of various factors, some of which are:
Decline in plant species previously used as fish poisons
Ready availability of agrochemicals in the lake basin
High cost of conventional fishing gears
High efficiency of fish poisons
High demand coupled with low catch per unit effort using conventional gears
Fish caught by poisoning find their way to local markets thus posing a health risk to consumers. The respective authorities of the three riparian states are concerned about this. Thus there is need to institute appropriate management and legal measures to stop the practice. To do this, basic information on the practice is required before corrective measures can be put in place. However, due to lack of information on the types of poisons used and characteristics of the poisoned fish there has been difficulty in prosecuting the offenders due to lack of evidence. There is also need to know the impact of the poison on the aquatic environment.
The objectives of this study, therefore, are to:
Take inventory of chemicals and poisonous plants used in fishing and the concentrations used.
Describe the effect of the poisons on the affected fish at raw state and after being processed (cooked, dry-salted, sun-dried, fried and smoked).
Determine the minimum lethal concentration (MLC), lethal concentration of poison in the water at which 50% of test fish die (LC50) for three fish species (Haplochromis sp., Oreochromis sp. and Brycinus sadleri) and thus determine their susceptibility to the poisons.
Determine effect of the poison on organisms other than the targeted fish.
Describe the effect of different fish poisons on water quality characteristics.
2. MATERIALS AND METHODS
Inventory of poisons used for fishing
The inventory of the poisons was compiled through oral interviews of fishermen on what types of poisons they used in fishing. Since poison fishing is illegal, the authors were introduced to the practising fishermen with the help of local residents of the fishing villages. The fishermen were asked where and how they get the poisons, the concentrations used, how they get the fish and who their markets/customers are, among other questions.
Experimental fishing
Experimental fish poisoning was carried out at selected and isolated sites around the Lake Victoria shores. Local authorities were informed and their consent given. The fishing was carried out using a multi-mesh gillnet (about l00 metres long) set 20 - 30 metres from and parallel to the weedy/rocky fringes of the lake against the direction of the waves and currents. A motorised canoe was used. The chemical poison (500 ml of concentrate) and poisonous plant material (l kg of dry/mashed material) were applied up front to ensure the poison is washed towards the net. The concentrations were applied on the basis of information from experienced fishermen in the fish poisoning practice (Section 3:1). After 30-60 minutes the gillnet was lifted. The floating fish were collected using scoop nets. The fish were taken to the laboratory for analysis. Effect on other organisms was examined on the field.
Aquarium experiments
Live fish samples were collected by gillnetting from the lake and stocked in glass aquarium tanks. Other specimens of live fish were obtained from fishermen who were contracted to deliver live specimens of Nile tilapia (Oreochromis niloticus), Brycinus sadleri (syn. Alestes sp.), and Astateotilapia (syn. Haplochromis). The live fish samples were kept in aquarium tanks filled with lake water that was constantly aerated.
The chemicals (Thiodan and Diazinon) used in catching fish were purchased from local agricultural stores. The poisonous plant materials (Cassia fallacina and Albizia gummifera) were harvested, dried and later used in aquarium experiments.
Aquarium experiments were conducted in glass tanks, each filled with 40 litres of fresh lake water and continuously aerated. Varying weights of the crushed plant poison materials were separately added to the tank. From stock solutions of the chemical poisons (350 mg/L Endosulfan and 600 mg/L Diazinon) appropriate aliquots were drawn and added to different tanks. The different fish species were then introduced simultaneously in each tank. After 35 minutes the number (and hence the percentage) of killed fish was noted for each species. MLC and LC50 were estimated from a plot of concentration vs percentage killed. The lowest concentration that resulted in a lethal effect on the fish was taken as the MLC i.e. the x-intercept (on the concentration axis). The concentration value corresponding to 50% of fish killed was taken as the LC50.
The effects of different poisons at known concentrations on Oreochromis niloticus of different sizes were determined by comparing time taken for each size of fish to collapse/die.
The activity of the poison in water was determined by setting an aquarium tank with known concentration of the poison in water and putting a fish species in the tank at time intervals of 0, 6, 12, 24 and 48 hours. The time taken for the fish to collapse/die was taken as an indication of the activity. Due to unavailability of equipment physicochemical parameters such as dissolved oxygen, pH and conductivity were not determined.
Post-harvest characteristics
Post-harvest characteristics were observed on poisoned fish from aquarium tanks, experimental fishing and suspected poisoned fish bought from fishermen. The effects of the poisons on the fish at ambient temperature and after processing were noted. The preservation and processing methods applied were cooking, dry-salting, sun-drying, frying and smoking. Cooking was carried out by boiling the fish in water. For dry-salting, fish samples varying in size from 29 g to 150 g were gutted, washed, salted and dried under the sun. Fish samples of sizes 20-200 g were de-scaled, gutted, washed, drained and sun-dried for 2-3 days. For frying, fish were de-scaled, gutted, washed and drained then deep-fried at l50-200°C for 3-5 minutes. Smoking was carried out using a traditional smoking oven (60 cm by 60 cm with a height of 61.5 cm) at an approximate temperature of more than 70°C for l-3 hours depending on the size of fish. All the fish were gutted, washed and drained before smoking. Changes under ice storage could not be observed due to lack of ice and ice handling facilities. Palatability tests were carried out by feeding cats/dogs and chicken (test animals) with the fish samples.
Biological assessment of fish
Biological assessment was done on the external features and by dissecting the poisoned and un-poisoned fish for examination of characteristic changes in the viscera, muscles and status of blood.
3. RESULTS AND DISCUSSION
The study found that various poisons were used in capturing fish in the waters of Lake Victoria. Data was collected on the poisons used and the extent of use more or less in the lake region. It was established that the poisons used kill the fish and where the concentration is not high enough to kill, the fish is irritated and swims away from its hiding where it is trapped by a gillnet which was usually set against the water currents/winds. Usually the gillnet was set before applying the poison. This type of fishing was carried out in shallow lake waters (where fish are bound to hide in such areas as rocks and crevices), along rivers and river mouths. The chemical poison was put in a plastic container with l or 2 holes (loosely stoppered with cotton wool) and a string attached to it. Sometimes it was loosely packed with a spongy material to slow the release of the chemical. It was immersed in the lake water and dragged by the string along for the poison to be released. For plant-based poisons the plant material was soaked in water in a bucket and poured in the lake water. The fish were affected after 30 to 40 minutes and caught in the net while some float and were scooped up. Most of these activities would take place at night. The surveys conducted along the Lake Victoria shores revealed that two types of poisons were used for fishing. These are agro-chemicals and plant-based poisons. A list of the poisons inventoried is presented below, though a detailed inventory was made.
A. Agrochemicals
I. Thiodan (35% w/v Endosulfan)
II. Diazinon (60% w/v)
III. Triatix (35% w/w Amitrax)
B. Plant based poisons
I. Cassia fallacina
II. Cassia didymobotra
III. Albizia gummifera
IV. Euphorbia tirucalli
V. Tephrosia vojelli (fish beans)
In the aquarium experiments for each of the poisons tested Cassia fallacina, Albizia gummifera, Thiodan (Endosulfan, Diazinon), the study obtained detailed information on the following:
Behavioural and biological characteristics of poisoned fish
Estimation of MLC and LC50 of poison on fish
Relationship between size (body weight) of Oreochromis niloticus with concentration of poison
Post-harvest characteristics of poisoned fish, including the effects of processing the poisoned fish
Effect of poison on water quality characteristics
Activity (persistence) of poison in water with time.
From the study it was established that this practice was taken up by fishermen, mainly due to high costs of conventional fishing gear and the quick returns got by using the poisons as less effort is used in getting equally high catches using conventional fishing gear. It is also shown that the practice mostly occured along rivers draining into Lake Victoria such as rivers Sio, Nzoia, Yala, Usigu, Sondu-Miriu and around Karungu Bay. Fish poisoning done around Karungu Bay occurred in shallow waters of Lake Victoria, 2 metres deep. When plant-based poisons were used, the practice was mostly at subsistence level.
The catches obtained by using agro-chemicals were not able to reach distant markets as the chemicals shorten the shelf life of the fish to less than 10 hours after landing. However, it was established that fishermen, who use agro-chemicals were normally contracted by buyers who purchase for export plants the fish immediately it is landed.
The chemicals affected all aquatic living organisms. This practice therefore, drastically affected the ecological balance of the rivers and the lake. Gastro-intestinal problems arising from the consumption of fish caught by these poisons were reported by the local people. The study found that if the fish were processed (dry-salting, frying and smoking) within 10 hours after catch no noticeable difference in quality is detected and there was no immediate harmful effect to the consumer. However, this depends on the quantity of the poison that the fish had ingested. The fact that there was no harmful effect to the consumer would probably suggest that processing (dry-salting, frying and smoking) reduces the toxicity in the fish as previously reported [Noguchi et al 1980] who noted that there was a significant reduction of toxicity in scallops after processing. It is probable that processing results in the thermal reduction of the poison. This however, needs further investigation to establish whether processing indeed reduces toxicity. From the pathological manifestations of the poison it is probable that Cassia fallacina is neurotoxic, whereas Albizia gummifera is haemotoxic. However, this also needs to be further studied to determine the mode of action of these poisons. Diazinon is known to be a chemical acetylcholine esterase inhibitor.
The use of herbs in catching fish has a longer history than that of industrially manufactured chemicals (Tengo, 1997; Sululu, 1997). Despite the fact that some herbs have been found to be strongly poisonous to fish, other aquatic organisms and man, they degrade easily into harmless substances. This stems from their being purely natural plant materials.
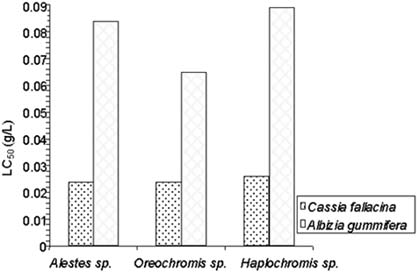
In the present study Cassia fallacina was found to be more poisonous than Albizia gummifera. The LC50 values (0.024 - 0.026 g/L) of Cassia fallacina were found to be lower than half those of Albizia gummifera (0.065 - 0.089 g/L) applied on the three studied fish species. These concentrations indicate that the active components of the crude plant material were thrown into the water, not all of the active component was extracted out into the water. However, when we consider the fact that plant materials are easily biodegradable, hence are less persistent, in the environment we may consider the herbal poisons to be less evil than the agro-chemicals.
The results of this study indicate that all of the four (4) poisons studied did not deteriorate for as least 48 hours in the water when the respective experiments were terminated. The activity of the poisons measured as the percentage of fish killed at a defined concentration and time of exposure remained constant. This observation was made possible for the simple reason that the water volume in the aquarium tanks remained constant and that it was all uniformly mixed. The situation in the lake water is too different for similar results to be expected. The lake is a huge water body and when the poison is applied at some point the dilution of the poison tends to proceed to infinity. No two points in time will the concentrations of the poison in the lake water be the same. As such if one had the means to determine the concentration and hence persistence of the poison applied on the lake after 48 hours the water would be found apparently fresh and free from the poison. However, this needs experimental confirmation. In fact it was established in this study that even after 40 minutes the applied poison on the lake water was detected with difficulty. This observation led us to question whether it is the poison that killed the fish or did it just irritate them to the extent that they were more easily caught in the pre-set gillnet.
The 30-40 minutes duration allowed in the lake water after poison application is therefore quite a different condition from the 35 minutes allowed in our laboratory experiments. We then postulate that in the practical situation, poisoned fish die essentially due to the entanglement in the gillnet. The fish found floating one day after poison application in a given area might be only those, which had come into direct contact with the poison during the application process.
Among the three fish species studied Orechromis niloticus was found to be most susceptible to both Diazinon and Albizia gummifera but least susceptible to Thiodan. The susceptibility of Oreochromis niloticus to Cassia fallacina was the same as that of Brycinus sadleri but slightly lower than that of Haplochromis sp. Although Oreochromis niloticus was the most resistant to Thiodan it was on average the most susceptible among the studied species. This partly accounts for the large proportions of tilapia in poison catches. The high resistance of Brycinus sadleri to Diazinon, Albizia gummifera and Cassia fallacina puts it at the position of being generally the most resistant among the studied fish species. However, this seems to be an accidental event because Brycinus sadleri is physically the most delicate of the three species.
4. CONCLUSIONS AND RECOMMENDATIONS
4.1 Conclusions
Rampant fish poisoning takes place along the shores of Lake Victoria with the use of both agro-chemicals and plant based poisons specifically along rivers, river mouths and shallow bays of the lake. The fishing is usually done at night to avoid detection.
The most commonly caught fish species are Oreochromis niloticus, Brycinus sadleri, Labeo victorianus, Synodontis afrofischeri, S. victoriae, Clarias gariepinus and Lates niloticus. However, other aquatic organisms are also affected.
Thiodan, Diazinon and Amitrax were found to be the most commonly used agrochemicals. Plant based poisons are from Cassia fallacina, C. didymobotra, Albizia gummifera, Euphorbia tirucalli and Tephrosia vojelli. However, the catches do not gain access to industrial processing
It is not evident that the lethal concentrations can be maintained in the lake water for long enough to be the actual cause of reported fish deaths. As such it can be asserted than gillnets are inevitably used for the purpose of catching the irritated fish with ease.
The fish caught by poisoning have noticeably short shelf life compared to the non-poisoned fish, as the chemicals tend to hasten the deterioration of viscera and muscles. Due to this short shelf life the fish are only available for local and nearby consumers. The main markets for such fish are restaurants and local population who process the fish within a period of l0 hours after catch. Some fishermen have specific customers who make orders and take delivery immediately the fish is landed.
No significant difference was observed between poisoned and non-poisoned fish if processed within 8-l0 hours after catch. However, safety cannot be guaranteed when such fish is consumed.
Of the studied pesticides Thiodan has been found to be more lethal than Diazinon while among the plant poisons Cassia is more lethal than Albizia gummifera.
Oreochromis niloticus is the most resistant to Thiodan but it is on average the most susceptible among the studied species. This partly accounts for the large proportions of tilapia in poison catches.
4.2 Recommendations for future study
1. Further study should be conducted to determine the effect of the poisons on the physico-chemical parameters of the water. These will provide information on the impact of the poisons on water quality.
2. A detailed study should be undertaken to determine and compile the organoleptic and biochemical changes that occur in a poisoned fish to be used in inspection purposes and evidence for prosecution of the offenders.
3. A study should be undertaken to identify and quantify the amount of residual chemical in the water. This information will give a clue on what concentrations actually kill the fish and supportive evidence on the use of the particular poisons.
4. A study be undertaken to quantify the amount of residual poison in fish tissues before and after processing. This information will give a clue on what levels may be ingested by the consumer, with what effect and will assist in assessing the health risks associated with consumption of poisoned fish.
5. The quality of the poisoned fresh fish at ambient temperature deteriorates very fast and it is recommended that a further study be conducted on shelf-life using ice or when frozen.
4.3 Recommendations to prevent poison fishing
1. The relevant Fisheries authorities to enlighten the fishermen/consumers on the dangers the poisons pose to the environment and consumers. The campaigns should be through mass media, community-based organizations and NGOs involved in environmental conservation.
2. Fisheries Officers involved in enforcing the law against this method of fishing should undertake refresher course on the ecological impact of these poisons on the environment (one fisheries officer classified this practice as a petty crime implying that he was ignorant of the ecological and health impacts of poison fishing).
3. Corruption among the fisheries officers should be stopped as some of them are compromised by the offenders.
4. Regular patrols by fisheries scouts to be made possible by availing patrol boats and other necessary gadgets.
5. District fisheries officers should be trained as prosecutors to be able to conduct quick and independent prosecutions (Tanzania has this process in place).
6. Legal personnel be made aware of the negative ecological effects of these poisons so as to offer stiff penalties - custodial sentences of up to seven (7) years.
7. Quality control laboratories should be equipped with modern and rapid analytical capacity for quick confirmation of any contamination of fish by poison. These laboratories should be based at the Lake Victoria shores to avoid delays of confirmation of the type of chemical used and thus quicken prosecution of offenders.
5. ACKNOWLEDGEMENTS
This study was originally formulated by the Lake Victoria Research Project (LVFRP) Management Committee and financed by the same project. We are indebted to our TAFIRI and KMFRI directors for offering us the opportunity and facilities to undertake the study. We would like to extend our appreciation to Mr. Sululu, R.S.M. (a tutor at Nyegezi Fisheries Training Institute (T)) and Mzee Tengo of Busia (K) for their generous technical assistance and advice. We should also mention with special thanks Mr. George P. of LVFRP for his kind assistance in repairing and setting the aquarium aeration pumps. Our sincere appreciation should also go to Messrs Wandera of FIRI (U), James Ogari of KMFRI (K), Msuku B.S. and Nsinda P.E. of TAFIRI (T) for their critically valuable contribution on the biology of the indigenous fish species. It could not be possible to mention all those who helped us to accomplish this task but we hope they will accept our genuine thanks.
6. REFERENCES
Akerblom, M. (1995) (for SADC ELMS). Guidelines for Environmental Monitoring of Pesticides in the SADC Region (Draft Manuscript), Appendix 3.
Brandt, Andres von. (1971). Fish catching methods of the world.
Loing, P.C., Hamzah, W.P. and Murugan, V. (1988). Toxicity of some pesticides towards freshwater fishes. Malasian Agricultural Journal 54: 147 - 156.
Lowe-McConnell, R.H. The changing ecosystem of Lake Victoria, East Africa; in Jones, J.G. and Sutcliffe, D.W. (Editors), Freshwater forum, Vol. 4(2), pp 76- 89, 1994. Published by Freshwater Biology Association, Ferry House.
Mishima (1980). Reduction of toxicity of highly PSP - infected scallops during canning process and storage. Bull Jan Soc. Sci. Fish 46: 1339 - 1344
Noguchi, T.Y., Veda, Y., Onoue, Kono, M., Koyam, K., Hasimoto, K., Seno, Y. and S. Sululu, M.S. (1997). Personal communication.
Tengo, O. (1997). Personal communication.
7. APPENDIX
Table 1. Percentages of fish killed after 35 minutes of exposure at different concentrations of Cassia fallacina
|
Concentration (mg/L) |
Percentage killed after 35 minutes |
||
|
Alestes sp. |
Oreochromis niloticus |
Haplochromis sp. |
|
|
0.02 |
33 |
33 |
25 |
|
0.032 |
80 |
75 |
75 |
|
0.04 |
100 |
80 |
80 |
Table 2. Relationship between size of Oreochromis niloticus and time taken for the fish to die at 0.043 g/L of Cassia fallacina
|
Total length (cm) |
Weight (g) |
Time to die (minutes) |
|
20.3 |
110.0 |
13 |
|
14.7 |
59.0 |
13 |
|
8.9 |
18.5 |
14 |
|
6.6 |
4.4 |
11 |
|
5.5 |
2.5 |
8 |
|
4.7 |
2.l |
5 |
Table 3. Percentages of fish killed after 35 minutes of exposure at different concentrations of Albizia gummifera
|
Concentration (g/L) |
Percentage killed after 35 minutes |
||
|
Alestes sp. |
Oreochromis nilotica |
Haplochromis sp. |
|
|
0.06 |
25% |
37% |
0% |
|
0.09 |
50% |
80% |
25% |
|
0.11 |
100% |
100% |
100% |
Table 4. Time taken for different sizes of Oreochromis nilotica to die in 0.12 g/L of Albizia gummifera
|
Total length (cm) |
Weight (g) |
Time to die (min) |
|
4.2 |
2.3 |
15 |
|
5.3 |
2.5 |
18 |
|
7.5 |
8.0 |
22 |
|
8.0 |
11.0 |
27 |
|
11.1 |
19.7 |
32 |
|
16.6 |
78.6 |
29 |
|
17.5 |
95.2 |
29 |
|
19.4 |
100.6 |
29 |
Table 5. Percentages of fish killed after 35 minutes of exposure at different concentrations of Thiodan (Endosulfan)
|
Concentration (mg/L) |
Percentage killed after 35 minutes |
||
|
Alestes sp. |
Oreochromis nilotica |
Haplochromis sp. |
|
|
0.15 |
20 |
n.d. |
20 |
|
0.20 |
n.d. |
n.d. |
30 |
|
0.25 |
80 |
n.d. |
n.d. |
|
0.35 |
n.d. |
30 |
n.d. |
|
0.50 |
100 |
60 |
n.d. |
|
0.65 |
n.d. |
80 |
80 |
Table 6. Time taken for different sizes of Oreochromis niloticus to die in 1.0 mg/L of Thiodan (Endosulfan)
|
Total length (cm) |
Weight (g) |
Time to die (min) |
|
13.5 |
47.5 |
23 |
|
9.7 |
19.1 |
23 |
|
15.0 |
58.0 |
28 |
|
14.9 |
59.1 |
30 |
|
16.2 |
74.0 |
34 |
Table 7. Percentages of fish killed after 35 minutes of exposure at different concentrations of Diazinon
|
Concentration (mg/L) |
Percentage killed after 35 minutes |
||
|
Alestes sp. |
Oreochromis niloticus |
Haplochromis sp. |
|
|
6.0 |
n.d. |
20 |
33 |
|
7.0 |
20 |
n.d. |
n.d. |
|
7.5 |
n.d. |
40 |
50 |
|
10.0 |
n.d. |
60 |
60 |
|
10.5 |
60 |
n.d. |
n.d. |
|
15.0 |
80 |
n.d. |
n.d. |
Table 8. Time taken for different sizes of Oreochromis niloticus to die in 10 mg/L of Diazinon
|
Total length (cm) |
Weight (g) |
Time to die (min) |
|
5.2 |
2.1 |
22 |
|
7.8 |
10.0 |
29 |
|
8.5 |
13.6 |
32 |
|
10.1 |
20.5 |
35 |
|
17.0 |
84.3 |
38 |
|
22.1 |
138.0 |
38 |
Table 9. Minimum lethal concentrations (MLC) and concentrations that kill 50% of test fish (LC50) for different poisons applied on three species of fish
|
Poison |
MLC |
LC50 |
||||
|
Alestes sp. |
Tilapia |
Haplochromis sp. |
Alestes sp. |
Tilapia |
Haplochromis sp. |
|
|
Cassia fallacina |
0.010 (g/L) |
0.012 (g/L) |
0.015 (g/L) |
0.024 (g/L) |
0.024 (g/L) |
0.026 (g/L) |
|
Albizia gummifera |
0.035 (g/L) |
0.030 (g/L) |
0.062 (g/L) |
0.084 (g/L) |
0.065 (g/L) |
0.089 (g/L) |
|
Thiodan |
0.12 (mg/L) |
0.21 (mg/L) |
0.09 (mg/L) |
0.180 (mg/L) |
0.455 (mg/L)* |
0.390 (mg/L) |
|
Diazinon |
6.2 (mg/L) |
5.0 (mg/L) |
4.5 (mg/L) |
9.5 (mg/L) |
8.6 (mg/L) |
7.5 (mg/L) |
* 24 hours LC50 for tilapia is 0.013 mg/L (Loing et al 1988)
Figure 1. Comparison of LC50 values for Thiodan and Diazinon applied on different fish species
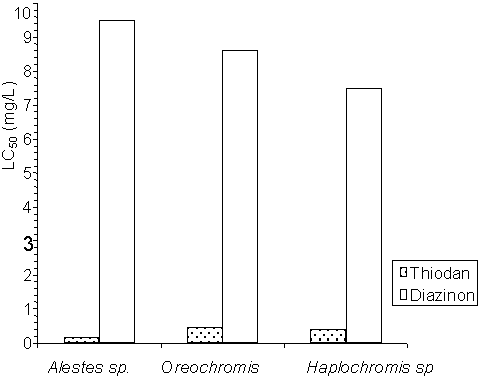
Figure 2. Comparison of LC50 values for Cassia fallacina and Albizia gummifera applied on different fish species
![]()
![]()
![]()