![]()
![]()
![]()
by
N.K. Gitonga, L. Okal and E. Mutegi
Fisheries
Department
Nairobi, Kenya
|
Abstract Kenya produces on average 200 000 tonnes of fish annually, valued at KShs 6.5 billion. Lake Victoria contributes over 90% of the total annual fish production in Kenya, with Nile perch dominating the landings. Over 30% of the country's annual fish production is supplied to export based processing establishments, the majority of which are heavily dependent on Nile perch landings. Kenya's fish export market has in the recent past been the main driving force in the rapid growth of the fisheries sub-sector. Fish exports have created employment opportunities to many, earned the country substantial foreign exchange, generated income for the Government, in addition to supporting a large number of auxiliary industries. Up to 1996 the countries of the European Union (EU) have been the main destination for Kenya's fish exports, taking over 70% of the quantity of its total exports of fish and fishery products. Between 1996 and 1999 the country's export trade has been severely affected by three fish export bans imposed by the EU. The bans have had very negative impact on Kenya's fisheries. This paper discusses the effects of the EU fish export bans on the Kenyan fish and fisheries products, highlighting the impact on the fisheries sub-sector and the role of the Fisheries Department in facilitating the sale of the fish and fishery products. |
1. INTRODUCTION
Kenya produces approximately 170 000 tonnes of fish and fishery products per year valued at about Kshs 6.5 billion. This amount is produced by 40 000 fishermen, operating mainly at artisanal level about 11 000 fishing boats in the inland lakes and marine waters of Kenya. The majority of the fishing boats are not motorised and are, therefore, propelled manually. However, on average, six (6) modern fishing vessels trawl for prawns in the Kenyan 12-mile territorial waters, producing annually approximately 715 tonnes out of the total production of 1 500 tonnes of crustaceans and molluscs that the country produces.
Foreign fishing vessels who pay royalties to the Government operate in Kenya's EEZ. One processing establishment located on the Kenyan Coast, in Mombasa produces tuna products harvested from the EEZ. The processed tuna loins are exported to the European Union (EU). Out of 19 fish processing establishments in Kenya, 7 are factory vessels, which harvest and pack frozen crustaceans.
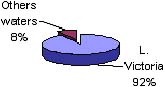
Figure 1: Lake Victoria contribution to national fish production
|
|
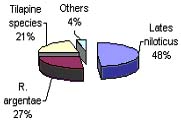
Figure. 2: Contribution of Nile perch to L. Victoria fisheries production
|
|
Over 50 000 tonnes (30%) of the total annual production are fed into the export based fish processing industries. Upon processing, approximately 18 000 tonnes of fish products are exported, earning the country about KShs 4 billion. Nile perch fillets constitute over 80% of the total exports in quantity.
The Lake Victoria fishery
Kenya's portion of Lake Victoria is 6% of the total area, from which approximately 160 000 tonnes of fish valued at about KShs. 6.2 billion at landing, is produced annually. The lake thus, contributes 92% of the country's total annual fish production (Figure 1).
The Nile perch fishery
The production of Nile perch contributes about 50% of L. Victoria's total production (Figure. 2), and about 47% of the total fish production in Kenya. The Nile perch industry earns the fisherfolk over KShs 6 billion and the country foreign exchange in the region of KShs. 4 billion. It supports about 10 large fish processing establishments and many small-scale businesses.
The contribution of Nile perch to the fisheries sub-sector and the national economy cannot, therefore, be ignored. This important industry needs to be given due attention for it to grow to the desired levels and contribute in the reduction of the poverty of the large population dependent on it.
2. THE SIGNIFICANCE OF THE EXPORT MARKET TO THE KENYAN FISH INDUSTRY
There is a need for the expansion and sustainable development of Kenya's fish export market due to the important benefits that are derived from it by the population that depend on the fish industry. The export market creates employment opportunities to many Kenyans; supports auxiliary industries such as packaging, boat building, net making etc; earns the country substantial foreign exchange; and generates income for the Government.
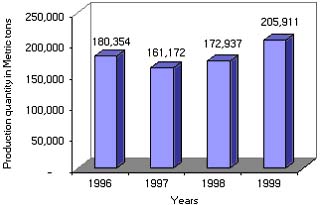
There are 19 export based fish processing establishments in Kenya, 10 of which are dependent on the Nile perch fishery. The communities and the national economy have benefited positively from the rapid growth of the fisheries sector brought about by the export marketing activities. However, these export marketing activities are quite fragile and whenever fish exports are affected such as would happen in an export ban, the communities that are dependent on the fishing activities suffer severe consequences, a large number of persons losing jobs, incomes and livelihoods. This is the current situation in Kenya, caused by the present ban on fish export to the EU resulting from suspicion of high pesticide residue levels in fish from Lake Victoria. Many factories have been operating below capacity and others have closed down. The ban on fishery products from Lake Victoria, by the EU has, therefore, highlights the dangers of single market dependency, especially for the large workforce dependent on the industry. A decreased demand contributed substantially to the decline in Nile perch production during the 1997 and 1998 EU ban on fishery products from Lake Victoria (Figure 3), subsequently affecting the national fish production (Figure 4).
3. THE EFFECTS OF THE FISH EXPORTS BAN ON KENYAN FISHERY
First ban (Salmonella)
Figure 3: Effect of fish ban on Nile perch production
|
1966 (before the banS)
|
|
1997 and 1998 (during the ban)
|
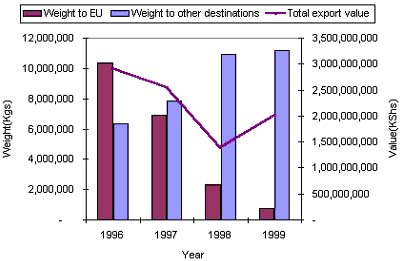
Kenya, until 1996, relied heavily on the EU market for her fish exports. The EU imported 70% of Kenya's fish exports, with Spain being the main importing country. A ban was imposed on Kenyan fish exports by Spain and Italy, on the 27th November, 1996, based on a claim of the presence of Salmonellae in the fish. Other EU member States, were however, not influenced by the ban and, therefore, continued to import fish from Kenya on bilateral agreements. As a result of the ban, both production and export of fish dropped significantly, negatively affecting the livelihoods of the fishing communities. The effects of the ban were felt in 1997, during which there was a drop of 13.1% in the foreign exchange earnings (Figure 5). This was occasioned by a drop of 33% in quantity of fish exported to the EU in 1997, compared to the previous year (Figure 3). The quantity of Kenyan fish exports to Spain declined by 86% in 1997 compared to 1996 exports. This ban has not been lifted to date.
|
Figure 4: Total fish production in Kenya 1996-1999
|
|
Figure 5: Nile perch export by (processed) weights to EU and other destinations vs. respective total export value 1996 - 1999
|
Second ban (Cholera)
On 23rd December, 1997, a ban on fish from East African countries and Mozambique was imposed by the EU as a result of Cholera outbreak in these countries. This ban affected only fresh chilled fish exports. This decision by the EU was unfortunate, because curative and preventive measures had already been put in place to curb the spread in Kenya, even before the ban was imposed. A cholera outbreak in a community is only indicative of poor hygiene standards of a community. The WHO came to the rescue of the four countries with the reassurance that Cholera could not be transmitted to humans through fish that has undergone hygienic processing. The ban was, therefore, lifted on 30th June, 1998. The decision to lift the ban required that an amendment be made on the Health Certificates of the exporting countries to indicate that 'any person handling fishery products must have satisfactorily undergone medical supervision'.
The cholera ban greatly affected Nile perch exports to the EU, a drop of 66% of the quantity exported in 1998, compared to the previous year (Figure 5). The overall effect of the ban on Kenyan export market was a 24% drop in total quantity of fish exports, accompanied by a 32% drop in value of foreign exchange. The EU is a valued market for Kenyan fish and though exports to other destinations continued to grow, the ban significantly affected both the fishers and foreign exchange earnings as evidenced by the decline in quantity and foreign exchange. The rise in quantities of fish exports to other destinations has, therefore not been accompanied by corresponding rise in the financial value realised for the exports made (Figure 5). It should be noted that this is because the EU market offers better prices than other export markets for Kenyan fish.
The ban was lifted on 30th June 1998.
Third ban (bad fishing methods)
On 26th March, 1999, another ban was imposed on fish from Lake Victoria affecting the three riparian states. This ban was imposed due to alleged use of chemicals by fishers to harvest fish. The Government of Kenya imposed a two week ban on fishing and marketing of Lake Victoria fish, to ascertain that the illegal fishing activity is eliminated and that fish from the lake is safe for consumption. During this time, cross-border meetings between Kenya and Uganda took place and vigilante groups were formed (still in existence) to ensure that the activity is stamped out.
After the two weeks, the Government of Kenya lifted the ban, having been satisfied that fish from the lake was safe for consumption.
The Competent Authority (CA) in Kenya, though financially constrained, embarked on a monitoring programme to collect and analyse samples of fish and water, aimed at ensuring that the fish products were free from pesticide residues. Results of the analysis were submitted to the EU in May 1999, but the Commission was not satisfied.
A EU delegation of three (3) inspectors visited Kenya in August 1999 on a mission to:
- assess the capacities and resources of the Competent Authority in relation to pesticide residues in fish.
- assess the reliability of the system of certification for freedom from pesticide residue in fish.
During the debriefing meeting of the mission, the EU inspectors advised the CA to develop a sampling plan for pesticide residue in fish, water and sediments, and use the Kenya Plant Health Inspection Service (KEPHIS) laboratory for analysis. KEPHIS has the capacity and capability for accurate pesticide residue analysis.
The sampling and analysis has been proceeding on monthly basis since then, and all the results have not shown pesticide residues at the levels of detection. Though these results have been transmitted to EU, the ban has not been lifted to date.
The effect of the current ban has impacted negatively on the fishermen and foreign exchange earnings of the country. The quantity of Nile perch exports to the EU dropped by 68% in 1999 compared to the previous year. The market has diversified a little with quantities exported to other destinations increasing slightly by 2%, though without equivalent financial gains. The EU pays higher prices than other export market of Kenyan fish.
Some of the effects of the ban, which were experienced in the same year were:
- 68% drop in quantity of Nile perch export to EU.
- 2% rise in quantity of Nile perch exports to other destinations.
- 16% rise in value of Nile perch exports compared to the previous year, which was nevertheless 31% less than the value before the bans in 1996.
4. CONCLUSION
It is important that the Department takes a lead role in ensuring the marketing of fish and fishery products, as this is one of its functions. To achieve this, the following activities have been planned and are being implemented.
Landing beaches
The improvement of the landing beaches is being implemented through community/stakeholder participation. Ten strategic landing sites have been earmarked, with the first phase aiming at:-
Fencing
Paving reception area
Improvement of drainage system
Provision of insulated fish boxes
Improvement of the sorting sheds
These activities are progressing well.
The second phase of improvement of the landing beaches will include the following developments:-
Provision of electricity and water
Construction of landing jetties
Modernization of fish reception
Improvement of access roads
Analytical laboratories
Capacity building for both chemical and microbiological analyses of fish and the environment (water and sediments), is essential to help develop the databases that would be used to assure consumers of the safety and quality of Kenya's fish. To this end, the construction and renovation of laboratories in Kisumu, Nairobi and Mombasa are being given priority. The laboratories will be used for routine analysis of the necessary parameters, which will provide the database that would be the reference point for fish safety and quality assurance.
Training
The training and refresher courses for fish inspectors and the industry quality managers is an on-going, programme aimed at upgrading fish quality in the country.
The Department is planning to conduct training for trainers on fish quality control to build training capacity. This is expected to assist in upgrading fish quality control through training of frontline fish inspectors, fish handlers, and quality managers. The trained trainers on quality assurance will therefore, be instrumental for enhancing fish product marketability.
Collaborative approach
The need to collaborate with local and international fisheries researchers is being emphasised and several Memoranda of Understanding have been prepared and signed to this effect. Demand driven research and survey are being promoted to improve information flow and database for better management of fishery resources. The same approach is being developed for all stakeholders in the fish industry, with fisheries taking the lead role.
Fisheries legislation
Fisheries regulation (Quality control) 2000 has been developed to ensure hygienic fish handling and processing, in order to assure safety of Kenyan fishery products to consumers.
5. REFERENCES
Fisheries Annual Statistical Bulletins, 1996, 1997, 1998 and 1999. Fisheries Department, Nairobi
by
A.I. Ikeme and C.S.Bhandary
Department of Food Science
and Technology
University of Nigeria, Nsukka.
|
Abstract Two experiments were conducted to determine the effectiveness of garlic paste or garlic and ginger spice mixture at 0%, 1%, 2%, 3% and 4% levels (per gram of fish) in retarding lipid oxidation and on the organoleptic quality of hot-smoked mackerel. In the various studies, fish samples (frozen) were thawed, cut, eviscerated, cleaned and dipped in 15% brine for 3 minutes. They were then divided into five batches and coated with appropriate paste at concentration of 1.0%, 2.0%, 3.0% and 4.0% by weight of samples, smoked at 80 - 85°C for 5 hours, cooled, stored at room temperature (25°C-30°C) for 20 days and used for physical, chemical, microbial and sensory evaluation studies. Untreated samples served as control. The results of this research indicated that samples treated with garlic paste, or mixture of garlic and ginger paste (1:1 ratio) were microbiologically more stable than the control samples as these had longer shelf-life and were not covered by visibly mouldy mass of mycelium during a 20-day storage period. The anti-oxidant activity of garlic, or garlic and ginger spice mixture was evident from lower TBA and peroxide values of treated samples relative to untreated (control) samples. Results of sensory evaluation revealed a general preference for spice-treated samples. |
1. INTRODUCTION
Fish is an excellent source of high quality protein. Fish protein compares favourably with that of eggs, milk and meat in its amino acid composition, and in fact has higher levels of essential sulphur-containing amino acids such as cysteine, methionine and lysine which are limiting in some legumes and most cereal-based diets (Borgstrom, 1962). In Nigeria, fish has remained a major source of animal protein, probably because of its relative cheapness when compared to meat.
Nevertheless, fish is an extremely perishable food commodity and in the tropical climate of most developing countries, it undergoes spontaneous spoilage within 24 hours unless it is subjected to some form of processing (Ames et al, 1991). Only a negligible proportion of the fish caught in rivers and lakes of Nigeria is marketed fresh. A greater proportion is preserved by smoking and sun-drying. Dried fish spoilage was characterised by Sen and Lahiry, (1964) as commonly consisting of a reddening, browning or other discoloration, mould attack, and the development of rancidity or off-flavour.
The use of synthetic antioxidants has been very effective in controlling rancidity. However, synthetic antioxidants are not available to the public and have been prohibited in many countries of the world because of its undesirable effect on the enzymes of the liver and lung (Inatani et al, 1982). This has paved way for the extensive use of natural antioxidants such as spices in the prevention of rancidity in smoked fish (Watts, 1962). Spices are edible plant materials that possess anti-oxidative, antiseptic and bacterio-static properties. They are added to foods to delay the onset of deterioration such as rancidity. They also function as seasonings to the foods as well as impart flavour to the foods (Lafont, et al, 1984). The purpose of this study is to determine the effectiveness of garlic, garlic and ginger spice mixture in controlling oxidative rancidity and on the organoleptic quality of smoked mackerel. Garlic and ginger were chosen because they are often used as added ingredients in many Nigerian cooked foods.
2. MATERIALS AND METHODS
Collection and treatment of samples.
For each experiment, frozen fish (Scromber scombrus) was purchased from a local cold store, thawed at room temperature (29°C-30°C), eviscerated and prepared into " butterfly cuts" according to the method of Roger et al, (1975). The sides were washed, brined by dipping in 15% sodium chloride solution for 3 minutes, drained and then divided into 5 batches. Fresh ginger (Zingiber officinalae) and garlic (Allium sativum) rhizomes, respectively were bought and the outer coat scrapped off. They were cleaned, ground properly into fine pastes and applied as garlic paste, or garlic and ginger (1:1) spice mixture at 0%, 1%, 2%, 3%, or 4% levels per gram of fish. The cleaned, brined and spiced fish samples were transferred to the smoke house, pre-treated for 30 minutes, placed on smoking trays with the split surfaces facing upwards. Hardwood and sawdust were used for firing. Initial smoking temperature was low to prevent surface drying of the fish samples. A temperature of about 70°C to 80°C was attained and this was maintained by either withdrawing or adding of wood. Samples were removed after 5 hours of smoking. Samples were re-dried on the 11th day of storage to retard spoilage by yeast/mould.
Fish storage and sampling
Smoked samples were cooked, packaged individually in polythene bags and stored at ambient temperature (28°C-30°C) for 4 weeks. Samples were subsequently subjected to visual observation, chemical and microbiological analyses and sensory evaluations.
Chemical analysis
Protein, lipid, moisture content of smoked products were determined according to (A.O.A.C., 1995) procedures. Peroxide value was determined according to the method of Lee (1971). TBA values were determined according to the method described by Tarladgies et al. (1960). Water activity (AW) was determined according to the method reported by Lupin (1988).
Microbiological analysis
Mould counts were determined according to standard procedures (Speck, 1976). Visual examination of the products was carried out daily. Products with visibly mouldy mass of mycelium were removed on observation to prevent contamination of products.
Panel evaluation of product quality
Subjective evaluation of product quality was carried out by an experienced panel composed of 10 students and staff of our Department of Food Science and Technology. Quality attributes studied include appearance, juiciness, saltiness, rancidity (off flavour), flavour and general acceptability. For evaluation, products were rinsed with water for one minute, covered with aluminium foil, heated in an oven at 250°F for 30 minutes and allowed to cool at room temperature before presentation to the panel. Panel members scored all factors on a 5-point Hedonic Scale.
Statistical analysis
Analysis of variance was applied to the treatment values obtained. Duncan's Multiple Range test method (1955) was then used to determine significant differences between means.
3. RESULTS
The effects of different concentrations of Ginger and Garlic pastes on various quality indices of smoked mackerel are shown in Tables 1-6.
The weight measurement of fish samples used in the 2 different studies indicated sizes approximately between 300 gm and 350 gm.
The relative humidity of the environment approximated to 75% at an ambient storage temperature of 28°C-30°C.
The results show that the samples had an average of 20% protein, 10% fat and about 55% moisture. Fishes with more than 5% fat are generally regarded as fatty (Stanley and Cline, 1950). Smoking decreased moisture content while concentrating the other nutrients.
The data obtained showed a decrease in protein content with a corresponding increase in fat content during storage. A consistent decrease in moisture and AW (percentage-wise) was observed in all treatments. The results showed that there was a steady increase in TBA values during the 20-day storage period and a corresponding increase in peroxide values for a period 2 weeks but later followed by a decrease in peroxide values in all treatments.
There was a steady increase in yeast and mould count as storage progressed. In all 2 studies lower counts were obtained for spice-treated samples. Untreated samples were covered by mouldy mass of mycelium by the 7th day of storage.
Taste panel ratings of all smoked fish samples during a 20-day storage period showed that treated samples were rated better than untreated in all parameters studied. Samples treated with 3% and 4% spice mixture were generally preferred over others.
4. DISCUSSION
Proximate composition
Similar values were reported by Ikeme and Uwaegbute (1988) for fresh (frozen) and smoked mackerel and Lawal, Talabi and Sorinmade (1985) for fresh mackerel. The smoking process had a drying effect in fish samples, hence the lower moisture content of smoked fish and corresponding increase in the protein and fat contents relative to fresh fish. Fish samples used in this research could be classified as fatty fish. Fish samples with more than 5% fat are generally regarded as fatty (Stanley and Cline, 1950).
Moisture content and water activity
The moisture content (AW) of the smoked fish samples decreased progressively during the 20-day storage period. The untreated samples (control) had the lowest rate of decrease while 4% spiced samples recorded the highest rate of decrease. The reduction in moisture content during storage can be attributed to protein denaturation and consequent loss of water-holding capacity of the proteins of the fish samples. Also, protein cross linkage which occurs during prolonged storage must have led to further moisture loss eventually resulting in the extended shelf life of the smoked fish samples.
Microbiological analysis
The results of the microbiological analysis are in agreement with Ikeme, (1985) who reported that mackerel dipped in 15% brine and subsequently smoked were considered unacceptable by the 5th day of storage. The observation of visibly mouldy mass of mycelium only on the control sample by the 7th day of storage under ambient condition indicated the effectiveness of spices as anti-fungal agents and hence the extended shelf life of spice-treated samples.
Thiobarbituric acid (TBA) and peroxide value
The samples were affected by the storage period and spice treatments. It appears that differences existed between spice-treated and untreated samples.
TBA and peroxide values for spice treated smoked samples were consistently lower than those of the control samples. All samples showed increased TBA and peroxide values with time.
It appears that higher concentrations of spice-treatment were more effective in retarding rancidity. Hence lower peroxide and TBA values were obtained in 3% and 4% spice-treated samples when compared to the control.
This is in agreement with the reports of Pratt and Watts, (1964) and Lee et al, (1986) who indicated that ginger and garlic pastes were very effective in retarding the development of rancidity in foods such as fish, pork and beef. Also, Saito et al, (1976) and Lee et al, (1986) had reported that the effectiveness of spices as antioxidants is directly related to their concentration.
Sensory panel evaluation
Table 1. Effect of different concentrations of ginger and garlic spice mixture on moisture content of smoked mackerel during a 20-day storage
|
Storage period |
Moisture content (%) |
||||
|
F0 |
F1 |
F2 |
F3 |
F4 |
|
|
1 |
49.50 |
47.70 |
41.50 |
38.40 |
34.90 |
|
3 |
45.60 |
41.10 |
38.00 |
34.70 |
32.70 |
|
5 |
41.70 |
36.10 |
33.50 |
32.50 |
29.40 |
|
7 |
37.50 |
32.50 |
30.50 |
29.20 |
26.80 |
|
9 |
32.60 |
28.30 |
28.10 |
27.10 |
25.10 |
|
11 |
27.70 |
24.80 |
23.90 |
23.10 |
21.50 |
|
13 |
23.30 |
21.00 |
19.40 |
18.60 |
17.80 |
|
15 |
19.90 |
19.00 |
17.70 |
16.20 |
15.60 |
|
17 |
16.40 |
16.50 |
14.30 |
13.00 |
12.20 |
|
19 |
12.20 |
12.60 |
10.30 |
9.10 |
8.40 |
F0 = Smoked Fish without spice (control); F1 = Smoked fish with 1.0% spice; F2 = Smoked fish with 2.0% spice; F3 = Smoked fish with 3.0% spice; F4 = Smoked fish with 4.0% spice
Analysis of variance showed that treatments significantly (P<0.05) influenced appearance, saltiness, rancidity and general acceptability during the 20-day storage period of fish samples. The control samples received the least panel scores than the spice-treated samples with regards to rancidity and general acceptability. The detection of rancidity in the control sample was as a result of increase lipid oxidation rate and this affected general acceptability scores. The spice-treated samples showed no significant differences (p<0.05) among panellist ratings and virtually no detectable rancidity.
Table 2. Effect of different concentrations of ginger and garlic paste on water activity values (aw) of smoked mackerel during a 20-day storage period.
|
Storage period |
Water activity (%) |
||||
|
F0 |
F1 |
F2 |
F3 |
F4 |
|
|
1 |
0.89 |
0.88 |
0.87 |
0.86 |
0.85 |
|
3 |
0.88 |
0.87 |
0.86 |
0.85 |
0.84 |
|
5 |
0.87 |
0.86 |
0.85 |
0.85 |
0.83 |
|
7 |
0.86 |
0.84 |
0.85 |
0.83 |
0.82 |
|
9 |
0.85 |
0.84 |
0.83 |
0.82 |
0.81 |
|
11 |
0.85 |
0.82 |
0.81 |
0.80 |
0.79 |
|
13 |
0.83 |
0.81 |
0.80 |
0.79 |
0.77 |
|
15 |
0.80 |
0.78 |
0.77 |
0.75 |
0.74 |
|
17 |
0.78 |
0.76 |
0.75 |
0.73 |
0.72 |
|
19 |
0.75 |
0.73 |
0.72 |
0.70 |
0.68 |
F0 = Smoked fish without spice (Control); F1 = Smoked fish with 1.0% spice; F2 = Smoked fish with 2.0% spice; F3 = Smoked fish with 3.0% spice; F4 = Smoked fish with 4.0% spice
Spices are edible plant materials that possess anti-oxidative, antiseptic and bacteriostatic properties. They could be added to food to delay the onset of deterioration such as rancidity. They also function as seasonings to the food as well as impart flavour to the foods. According to Inatani et al, (1982) the use of synthetic antioxidants as food additives is now prohibited in many countries of the world because of their undesirable effects on the enzymes of the liver and lung. Hence the use of natural antioxidants which are considered relatively safe. A measure of the anti-oxidative effect of spices revealed that spices belonging to the family, Habitae exhibit strong anti-oxidative activity. They include: ginger, garlic, onion, rose mary, tumeric, nutmeg and sage.
The bacteriostatic properties of spices are also useful in extending the shelf-life of the smoked fish. Sharma et al, (1979) reported that some onion and ginger extracts could inhibit aflatoxin-producing fungi in smoked food products thus extending their shelf-life. An extract identified as the lachrymatory factory (LF) has been implicated. This factor known as thiopropanol-5-oxide has been found to have potent anti-fungal and anti-oxidative activities.
Hot water extracts of plant tissues are complex mixtures containing several classes of compounds that might contribute to their antioxidant activity. In addition, to phenols, aromatic amines, sulphydril compounds and others may function as primary antioxidants.
The study has shown that ginger and garlic, two available spices in Nigeria, when used singly or as combination, as paste, in smoking mackerel exhibit antioxidant and anti-fungal properties especially at 3% and 4% concentration (per weight of fish).
Table 3. Effect of different concentrations of ginger and garlic pastes on TBA values of smoked mackerel during a 20-day storage period.
|
Storage period |
TBA values |
||||
|
F0 |
F1 |
F2 |
F3 |
F4 |
|
|
1 |
0.30 |
0.20 |
0.17 |
0.13 |
0.10 |
|
2 |
0.34 |
0.22 |
0.19 |
0.15 |
0.11 |
|
3 |
0.37 |
0.26 |
0.21 |
0.19 |
0.14 |
|
4 |
0.41 |
0.33 |
0.24 |
0.22 |
0.17 |
|
5 |
0.46 |
0.37 |
0.27 |
0.25 |
0.20 |
|
6 |
0.50 |
0.40 |
0.31 |
0.29 |
0.23 |
|
7 |
0.53 |
0.44 |
0.35 |
0.33 |
0.26 |
|
8 |
0.57 |
0.49 |
0.40 |
0.38 |
0.29 |
|
9 |
0.60 |
0.54 |
0.44 |
0.42 |
0.32 |
|
10 |
0.63 |
0.59 |
0.49 |
0.47 |
0.34 |
|
11 |
0.69 |
0.65 |
0.55 |
0.52 |
0.37 |
|
12 |
0.73 |
0.70 |
0.60 |
0.58 |
0.40 |
|
13 |
0.78 |
0.74 |
0.64 |
0.63 |
0.44 |
|
14 |
0.84 |
0.80 |
0.70 |
0.69 |
0.48 |
|
15 |
0.89 |
0.85 |
0.75 |
0.74 |
0.52 |
|
16 |
0.95 |
0.91 |
0.80 |
0.79 |
0.54 |
|
17 |
0.98 |
0.96 |
0.86 |
0.85 |
0.58 |
|
18 |
1.02 |
0.99 |
0.89 |
0.90 |
0.60 |
|
19 |
1.10 |
1.05 |
0.94 |
0.93 |
0.64 |
|
20 |
1.13 |
1.08 |
0.96 |
0.98 |
0.68 |
F0 = Smoked fish without spice (Control); F1 = Smoked fish with 1.0% spice; F2 = Smoked fish with 2.0% spice; F3 = Smoked fish with 3.0% spice; F4 = Smoked fish with 4.0% spice
Table 4: Effect of different concentrations of ginger and garlic pastes on peroxide values of smoked mackerel during a 20-day storage period.
|
Storage period |
Peroxide values |
||||
|
F0 |
F1 |
F2 |
F3 |
F4 |
|
|
1 |
9.00 |
8.60 |
7.40 |
6.80 |
6.10 |
|
2 |
10.20 |
9.70 |
8.90 |
8.40 |
7.60 |
|
3 |
11.60 |
11.20 |
10.80 |
10.40 |
10.00 |
|
4 |
13.00 |
12.50 |
11.80 |
11.00 |
10.40 |
|
5 |
14.30 |
13.60 |
12.90 |
12.10 |
11.30 |
|
6 |
15.70 |
15.30 |
14.80 |
14.30 |
13.70 |
|
7 |
17.00 |
16.40 |
15.70 |
15.20 |
14.40 |
|
8 |
18.40 |
17.90 |
19.20 |
16.60 |
15.90 |
|
9 |
20.00 |
19.40 |
18.70 |
18.10 |
17.40 |
|
10 |
21.70 |
21.00 |
20.40 |
19.70 |
19.00 |
|
11 |
23.50 |
23.00 |
22.50 |
22.00 |
21.50 |
|
12 |
25.20 |
24.50 |
23.80 |
23.00 |
22.20 |
|
13 |
27.00 |
26.10 |
25.20 |
24.30 |
23.40 |
|
14 |
28.80 |
27.60 |
26.40 |
25.20 |
24.20 |
|
15 |
30.00 |
28.00 |
27.00 |
26.00 |
25.00 |
|
16 |
29.90 |
27.90 |
26.90 |
26.00 |
24.00 |
|
17 |
29.90 |
27.80 |
26.80 |
25.90 |
24.50 |
|
18 |
29.80 |
27.80 |
26.80 |
24.70 |
24.40 |
|
19 |
27.30 |
26.60 |
26.00 |
23.90 |
23.20 |
|
20 |
25.20 |
24.70 |
24.20 |
21.20 |
20.20 |
F0 = Smoked fish without spice (Control); F1 = Smoked fish with 1.0% spice; F2 = Smoked fish with 2.0% spice; F3 = Smoked fish with 3.0% spice; F4 = Smoked fish with 4.0% spice
Table 5. Effect of different concentrations of ginger and garlic pastes on mould counts of smoked mackerel during a 20-day storage period.
|
Storage period |
Mould count (colonies/g) |
||||
|
F0 |
F1 |
F2 |
F3 |
F4 |
|
|
1 |
2.6x10⁴ |
1.9x10⁴ |
1.5x10⁴ |
1.2x10⁴ |
1.0x10⁴ |
|
5 |
4.5x10⁴ |
2.7x10⁴ |
3.2x10⁴ |
2.6x10⁴ |
2.8x10⁴ |
|
10 |
6.8x10⁴ |
4.4x10⁴ |
3.4x10⁴ |
2.8x10⁴ |
4.3x10⁴ |
|
15 |
12.5x10⁴ |
6.0x10⁴ |
5.0x10⁴ |
3.9x10⁴ |
5.2x10⁴ |
F0 = Smoked fish without spice (Control); F1 = Smoked fish with 1.0% spice; F2 = Smoked fish with 2.0% spice; F3 = Smoked fish with 3.0% spice; F4 = Smoked fish with 4.0% spice
Table 6. Treatment means and standard error of taste panel rating of smoked mackerel during a 2-day storage period
|
Treatment |
Appearance |
Juiciness |
Saltiness |
Rancidity |
Flavour |
General |
|
F0 |
3.53±0.24a |
3.07±0.24 |
2.80±0.19a |
3.53±0.24a |
2.93±0.35 |
2.73±0.32a |
|
F1 |
4.13±0.14ab |
3.53±0.15 |
3.30±0.12b |
4.10±0.15ab |
3.07±0.18 |
3.20±0.21ab |
|
F2 |
4.20±0.18ab |
3.73±0.16 |
3.5±0.11b |
4.13±0.14ab |
3.30±0.19 |
3.50±0.17ab |
|
F3 |
4.47±0.11b |
3.07±0.41 |
3.20±0.12b |
4.37±0.16b |
3.37±1.01 |
3.80±0.12b |
|
F4 |
4.30±0.12b |
3.9±0.18 |
3.43±0.15b |
4.50±0.10b |
3.93±0.17 |
3.87±0.16b |
F0 = Smoked fish without spice (Control); F1 = Smoked fish with 1.0% spice; F2 = Smoked fish with 2.0% spice; F3 = Smoked fish with 3.0% spice; F4 = Smoked fish with 4.0% spice
5. REFERENCES
A.O.A.C. (1996). Official Methods of Analysis, 4th ed. Association of Analytical Chemists. Washington D.C.
Ames, F., Clucas, I. and Paul, S.S. (1991). Post Harvest losses of fish in the tropics. Natural Research Institute. ODA, 23 pp.
Borgstrom, G. (1962). Fish in World Nutrition, pages 267-360. In fish as food. BORGSTROM, G. ed. Academic Press, New York.
Duncan, D.B. (1955). Multiple range and multiple f-tests. Biometrics, 11: 1-42.
Ikeme, A.I. and Uwaegbute, A.C. Effect of Different methods of Hot-Smoking on the Proximate composition and Acceptability of loan and Fatty Fish. Proceedings of the FAO Expert Consultation on Fish Technology, in Africa, Abidjan, Cote d'Ivoire, April 35-28, 1988, pp. 113-123.
Ikeme, A. I. (1985). Extending the shelf-life of Smoked Mackerel. Proc. of the FAO Expert Consultation on Fish Technology in Africa. Lusaka, Zambia, 21-25 January, 1985. pp. 144-148.
Inatani, R., Nakatani, W., Fuwa, H. and Saito, H. (1982). Anti-oxidative Effect of the Constituents of Rosemary and their derivation. Agric. Biol./Chem. Vol. 46., p. 1661.
Lafont, J., Jacquant, P., Raymond, A. and Sarfaji, J. (1984). Some biological effects of spices, aromatic condiments and other plants products on bacteria and mycromycetes, Microbial Aliments. Nutr. 2 (3), pp. 239-246.
Lawal, A.O., Talabi, S.O. and Sorinmade, S.O. (1985). Effect of salting on the storage and quality characteristics of smoked croaker. Proceedings, FAO Expert Consultation on Fish Technology in Africa, Lusaka, Zambia.
Lee, A. (1971). Laboratory Handbook of methods of food analysis. Leonard Hill; London, pp. 138-145.
Lee, Y.B., Kim, Y.S. and Ashmore, C.R. (1986). Antioxidant property of ginger rhizome and its application to meat products. J. Food Sci. 5, (1); pp. 20-23.
Lupin, H.M. (1988). Water activity in preserved products in cured fish products in the tropics. Proc. of a Workshop on the Production of cured fish. University of the Phillipines in the Visayas, Diliman, Quezon City. Phillipines, 14-25 April, 1986. pp. 16-55.
Pratt, D.E. and Watts, B.M. (1964). The antioxidant activity of vegetable extracts. In: flavone aglycones. J. Food Sci. 29(1) 27-32.
Roger, J.F., Cole, R.C. and Smith (1975). An illustrated guide to fish preparation: Tropical Product Institute, London (83), 46-49.
Saito, Y., Komura, Y. and Sakamoto, T. (1976). Studies on the antioxidation properties of spices. III. the antioxidative effects of petroleum ether soluble and insoluble fractions from spices. Eryotoshokuryo, 29(9), 504.
Sen, D.O. and Larhiry, N.L. (1964). Studies on the production of better quality salt-curved and sun-dried Mackerel (Rastreliger Ykanagruta), Food Technol. 18, pp. 107-110.
Sharma, A., Tewari, G.M. and Shikande, A.J. (1979). Inhibition of aflatoxin - producing fungi by Onion extracts. J. Food Sci., 44. pp. 1545 - 1548.
Speck, M.L. (1976). Compendium of methods for the Microbiological examination of food. Amer. Publ. Health Ass,m Washington, D.C.
Stanley and Cline (1950). Foods - Their selection and preparation. Res. ed., pp. 322-330. Boston, Fin. & Co.
Tarladgis, B.G., Watts, B.M. and Younathan, M.T. (1960). A distillation method of quantitative determination of malonaldehyde in rancid foods. J. Am. Oil Chemists Soc. 37: 44-48.
Watts, B.M. (1962). The role of Lipid Oxidation in lean tissues in flavour deterioration of meat and fish. In: Proc. of flavour Chemistry Symposium. pp. 83. Campbell. Soup. Co. Campden; N.J.
APPENDIX Sample Score Sheet Used by Taste Panel
Sample No.:............................................................
Score:...............................................................
Date:.................................................................
You are provided with (5) samples S00, S10, S20, S30 and S40. Different score sheets are to be used for different samples. Evaluate them according to the intensity of the quality of Appearance, Juiciness, Saltiness, Rancidity, Flavour and General Acceptability. Test the sample in the following order - 4, 3, 2, 1, 0 score in the sample scoring sheet provided.
|
Factor |
1 |
2 |
3 |
4 |
5 |
|
Appearance |
Extremely Bad |
Moderately Bad |
Neither good nor bad |
Moderately Good |
Extremely Good |
|
Juiciness |
Extremely dry |
Moderately dry |
Neither juicy nor dry |
Moderately Juicy |
Extremely Juicy |
|
Saltiness |
Extremely Bland |
Moderately Bland |
Neither salty nor bland |
Moderately salty |
Extremely salty |
|
Rancidity |
Extremely rancid |
Moderately rancid |
Medium rancid |
Slight detectable rancidity |
No detectable rancidity |
|
Flavour |
Extremely undesirable |
Moderately undesirable |
Neither desirable nor undesirable |
Moderately desirable |
Extremely desirable |
|
General Acceptability |
Extremely unacceptable |
Moderately unacceptable |
Neither acceptable nor unacceptable |
Extremely acceptable |
|
by
M. Masette, M. Muganwa, J.F. Nakavuma and I.
Wanyenya
Food Science Research Institute (FOSRI)
Kampala, Uganda
|
Abstract Different contact surfaces at six (6) landing sites, five (5) fish factories and one (1) exit route (Entebbe Airport) along the fish handling chain from capture to dispatch were sampled using 10 cm 2 template swabbing method. In addition, duplicate 5 ml water samples from various points between shoreline and fishing ground were aseptically collected. Using the pour plate method, all samples were homogenized, serially diluted and then inoculated on appropriate media. Plate count agar and violet red bile agar were used for determining total plate (TPC) and Coliform counts respectively. All samples were incubated aerobically for 24 hrs at 37°C. Generally, the results underpinned the influence of unsanitary status of landing sites, and/or nature of contact surfaces and practices of fish handlers on the microbial load. The highest microbiological load (109 cfu/cm2) was detected on wooden contacted surfaces namely wooden platforms and fishing boats while the lowest load (102.5 cfu/cm2) was observed at the fishing grounds. The inappropriate practice of batch washing also registered a load of 107cfu/cm2. The presence of Coliforms at most of the points sampled was indicative of a high risk of contamination of fish by pathogenic microbes, hence a risk to public health and international fish trade. The probable points for effective intervention were found to be the landing sites, boats, batch washing method at plant reception and fish handlers. |
1. INTRODUCTION
The Ugandan portion of L. Victoria constitutes 43% of the total lake surface area. It supports the livelihood of an estimated one million individuals involved in various fishery and other allied activities. In the wake of the private-led economy in the late 1980s, a significant portion of artisanal fisheries activities were upgraded to handle fish intended for industrial processing. Most of the fish processing plants varied from small to medium scale and were engaged in primary processing of chilled as well as frozen Nile perch Lates niloticus fillets for the export market. The major lucrative market was the European Union (EU), followed by Middle East, United States of America (USA), S.E. Asia and Australia in terms of quantity and value. Currently, fish exports contribute 2% of the GDP (MFED 2000) and earn the country close to US$ 62 million annually (New Vision, 2001).
Unfortunately, this lucrative export trade has not been without setbacks. On several occasions, its flow has been interrupted because of non-compliance to international quality and safety standards. In mid 1990s the EU imposed a ban on fish products from Uganda because of unacceptable microbiological contamination. Later in 1999, there was a self-imposed ban due to the unorthodox method of fish capture using a pesticide that rendered fish unfit for consumption. During the two bans, which lasted approximately 2 years in total, the country lost Shs. 800 million per week (UFPEA, 1999). As expected, government had to intervene. However, before remedial measures could be put in place, it was deemed necessary to carry out a situation analysis of the handling and processing chain from capture to dispatch. Among the many bottlenecks identified was the insufficient knowledge about the microbiological load along the chain, hence the need for this study.
The then artisanal route from capture to market, which provided raw materials for the industrial sector, was characterized by inappropriate handling facilities and practices that were inadvertently enhancing microbial proliferation. In addition, the method of fishing, the size of fishing vessels, the handling of miscellaneous cargo aboard transport boats, and the unhygienic/unsanitary landing sites collectively contributed to the increase of the microbiological load. However, the actual load at each of the identified points in the chain had not been quantified. This study was therefore designed to establish the levels of microbial load and subsequently use the information as a basis for instituting cost effective intervention measures.
The objectives of the study were:
to quantify microbial load along the handling and processing chain
to identify critical points for subsequent remedial interventions.
2. MATERIALS AND METHODS
Materials used included microbiological media viz. nutrient agar, MacConkey agar, ethanol, sodium thiosulphate, saline water (0.85% NaCl) sterile cotton swabs, 10 cm2 plastic template, vials, insulated portable box, balance, hand colony counter, incubators and oven.
Sampling points along the distribution chain from capture to the exit port were randomly picked including most of the processing plants were included in the study. Samples from contact surfaces were collected using Harrigan and Maclane (1990) swabbing method. Water samples were collected in sterile vials. Duplicate samples were then transported under chilled temperatures to the Faculty of Veterinary Medicine - Microbiology Laboratory. Plate and Coliform counts were carried out using the pour plate method ISO - 4833 (MacCauce and Harrigan 1990).
3. RESULTS
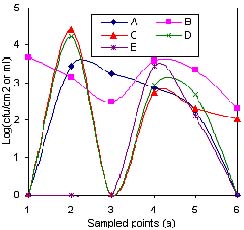
Fig 1: Microbiological load on contact surfaces along the fish handling chain from capture to exit port.
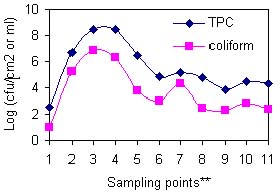
** 1 = At fishing ground; 2 = On fishing boat; 3 = Onshore; 4 = On platform; 5 = On insulated truck; 6 = At plant before offloading; 7 = Washed at reception; 8 = Filleting; 9 = Skinning; 10 = Trimming; 11 = Packaging
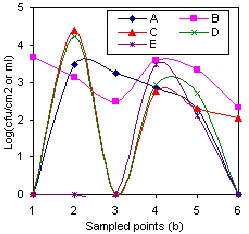
Fig 2: Microbiological load on fish surface between capture and packaging.
*** 1 = Offshore water (2 Km); 2 = Onshore water (shoreline); 3 = Wooden platform surface; 4 = Wooden fishing boat; 5 = Insulated truck floor; 6 = Ice in truck at landing site.
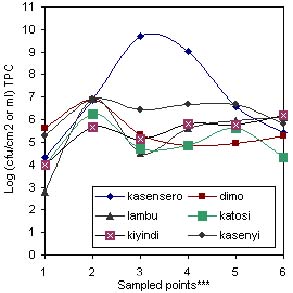
Fig: 3(a) Total plate count (TPC) along handling chain between offshore and various landing sites.
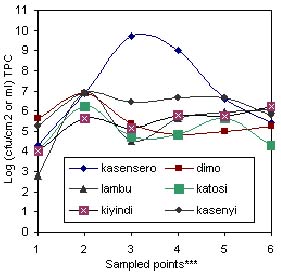
*** 1 = Offshore water (2 Km); 2 = Onshore water (shoreline); 3 = Wooden platform surface; 4 = Wooden fishing boat; 5 = Insulated truck floor; 6 = Ice in truck at landing site.
Fig: 3(b). Coliform counts along handling chain between offshore and various landing sites.
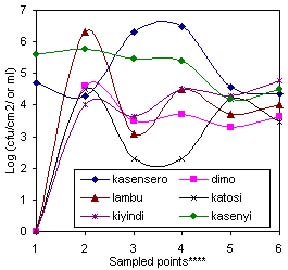
1 = Tap water; 2 = Water in batch washing tub; 3 = Ice; 4 = Filleting surfaces; 5 = Hands of workers;6 = Packaging material
Fig.4(a) Total plate count (TPC) of critical items in five fish processing plants
1 = Tap water; 2 = Water in batch washing tub; 3 = Ice; 4 = Filleting surfaces; 5 = Hands of workers;6 = Packaging material
Fig.4(b) Coliform counts of critical items in five fish processing plants
1 = Tap water; 2 = Water in batch washing tub; 3 = Ice; 4 = Filleting surfaces; 5 = Hands of workers;6 = Packaging material
4. DISCUSSION
Generally, the microbial load decreased from capture to dispatch although the load was quite low at fishing ground and high in the batch washing water (Figure 1). A similar trend was observed in (Figure. 2) which was in agreement with Shewan (1977), Liston (1980), Gram (1989) and Huss (1990) who noted that the microflora on the surface of a live or freshly caught fish was a reflection of their presence in the environment. As Woyewoda et. al. (1984) observed, the assertion may also be extended to cover the contact surfaces with which the post harvest catch may come into contact as demonstrated in Figure.2. The low microbial load (102.5 cfu ml-1 for TPC and 101 cfu ml-1 for Coliform) at most fish grounds sampled was probably due to the dilution factor and distance from the main sources of contaminants. In Figure. 3(a) and (b), the dilution factor brought about by topographical differences at various landing sites has been illustrated. Kasensero and Kasenyi landing sites have a shallow bay whereas Dimo and Lambu have a deep bay. Hence the dilution factor may have been lower at former sites than the latter. Furthermore, Kasensero is enclosed by a fast moving Kagera river and an expanse of a wide sandy beach, which inevitably decreases the dilution factor in the bay, hence accumulation of microbes (Okurut, pers. comm.). In addition, at the time of the study February - March 1997, this landing site lacked basic sanitary facilities and the handling practices were quite poor. Accordingly, the risk of contamination with pathogenic microorganisms as indicated in Figure 3(b) was quite high whereas in the offshore waters off Dimo, Lambu, Katosi and Kiyindi landing sites, there was no such risk. As far as Thatcher (1973) Connell (1990) and Huss (1994) were concerned, the presence of Coliforms was indicative of the risk of contamination with enteric pathogenic organisms. Though unreported in this study due to scope of this paper, several pathogenic organisms were detected at sampling points with high Coliform counts. In addition, Banwart (1979) regarded Coliforms as indicators of general poor sanitation. Generally, the microbial load between offshore waters and landing sites studied varied between 104 cfu ml-1and 106 cfu ml-1 (TPC) except for Kasensero near the Ugandan-Tanzania border, whose shoreline water indicated a much higher load of 109 cfu ml-1(TPC) and 106 cfu ml-1 Coliform than at other sites.
The high loads detected on platforms and fishing boats quantified as 109 cfu cm-2 and 107 cfu cm-2 respectively, were attributed to the porous nature of their wooden surfaces, which provided an ideal niche for microbial proliferation (Adams and Moss 1995; Johnson and Clucas 1996). Previous work by Huss (1995) concluded that fish kept in dirty wooden boxes had a higher bacterial load than fish kept in clean boxes.
The gradual decrease in load observed on surfaces 6, 7 and 8 in Figure. 1, was probably due to change in temperature from ambient (26-30oC) to temperature of melting ice (0oC), which indicated that most of the microbes present were the surviving pschrotrophs (Adams and Moss 1995). On the other hand, sampling point 9 exhibited quite high loads (107). This was presumably due to accumulation of microbes as result of washing over 1000 fish with an initial microbial load of 105 cfu cm-2, in 1m3 tub water and for a retention period of 20 minutes. However, in Figure 2 the high load was not reflected on the surface of the fish probably due to the low temperature of the water (2.4oC) and the limited 20-minute contact time. The wide variation observed in Figure 4(a) between the various plants with regard to microbial load in batch washing water (TPC) was probably due to variation in tub size and contact time. On the contrary, the small variation in Coliform observed in Figure. 4(b) was probably indicative of the prevalence of Coliforms at fairly low temperatures of tub water, a survival characteristic exhibited by Coliform group of bacteria (Frazier and Westhoff, 1988). Plant E had individual fish washing method in place as opposed to batch washing. Although most of the contact surfaces numbered 10-13 within the processing plants (Figure 2) had microbial load within acceptable limits (ICMSF, 1986), the filleting, skinning, trimming and packaging operations increased the risk of cross-contamination from workers' hands (Thatcher 1973; Castell 1973; Huss 1994 and Adams and Moss 1995). In this study, workers' hands that had 105 cfu cm-2 TPC and 102 cfu cm-2 Coliform on average, probably influenced the high microbial load observed during the aforementioned operations. Generally, the TPC on workers' hands in all processing plants (Figure. 4 (a)) were similar. However, the Coliform counts (Figure 4(b)) varied widely indicating the different supervisory regimes, available sanitary facilities and layout in various plants studied. For example, at the time of this study Plant B had an inadequate number of supervisors, unsanitary facilities and a poor layout. Equally, Plant D had relaxed supervisory regimes and untidy sanitary facilities. Another point of cross-contamination by workers was quite evident with the ice. Whilst the ice within the processing plants was hygienically acceptable with an average TPC of 103 cfu ml-1 and Coliforms below 102.5cfu ml-1, upon reaching thelanding sites, the contamination almost doubled to 106 cfu ml-1 for TPC and 10 4.5 cfu ml-1 Coliforms. The increase was attributed to the poor practices of plant workers who co-opted untrained fish handlers at landing sites to load their fish consignment onto insulated trucks or doling out ice to their respective fishermen or agents. In the process, the co-opted workers would tread on ice with un-sanitized gumboots, which had previously passed through places with high microbial loads. The workers were also a likely source of contamination of the packaging material especially in Plant B and D where the Coliform counts exceeded the acceptable limits (ICMSF, 1986) According to Marriott (1989) factory employees are the largest source of contamination.
The final point of concern was the undercarriage container at the exit port- Entebbe that registered a microbial load of 104 cfu cm-2 and 103 cfu cm-2 for TPC and Coliform counts respectively. It was noted that the container handled an assortment of goods without due diligence. As such, it posed a risk of cross-contamination to inappropriately packaged or mishandled and exposed fishery products during loading aboard a carrier.
5. CONCLUSION
The microbial load along the handling and processing chain in the Uganda portion of L. Victoria was influenced by the sanitary and topographical status of landing sites, porous nature of handling facilities and handling practices of fish handlers and/or workers. Generally, microbial loads decreased from capture to dispatch although they were unbelievably low at fishing grounds and exceptionally high at landing sites. The risk of fish contamination by pathogens as indicated by the presence of Coliforms was highest at landing sites and within the processing plants.
Remedial measures therefore entailed improvement of sanitary and hygienic facilities at landing sites and ensuring that fish handlers are trained in appropriate handling and manufacturing practices.
6. BIBLIOGRAPHY
Adams, M.R. and Moss, M.O. (1995). Food Microbiology. Publisher-The Royal Society of Chemistry. Cambridge, UK.
Banwart, G.J. (1979). Basic Food Microbiology. Abridged edition. The AVI Publishing Company INC. Westport. Connecticut, USA.
Bramsnaes, F. (1965). Handling of fresh fish. In: Fish as Food (Ed.), Borgstrum, G. Vol. 4 p. 1-60
Castell, C.H. (1973). Raw Fin Fish: Microbiological considerations. In: Microbial Safety of fishery Products.
Ed. Chichester, C.O. and Graham, H.D. Academic Press New York. Pg. 80-83.
Connell, J.J (1990). Control of fish Quality. 3rd Edition. Fishing News Books LTD., Farnham, UK.
EEC Council Directive (91/493/EEC). Laying down the health conditions for the production and placing on the market of fishery products.
Frazier, W.C and Westhoff, D.C. (1988). Food Microbiology. 4th Edition. Pg. 56. McGraw-Hill Book Company- Singapore.
Gram, L. (1989). Identification, Characterization and Inhibition of Bacteria isolated from Tropical fish. PhD Thesis. Royal Veterinary and Agricultural University, Lyngby, Denmark.
Liston, J. (1980). Microbiology in fishery science. In: Connell J.J (ed.) Advances in fishery science and technology. Fishing News Books LTD, Farnham, UK.
Harrigan, W.F. & MacCane, M.E. (1990). Laboratory Methods in Food and Dairy Microbiology, 8th. Edition, Academic Press Inc, San Diego. Pp 132, 136, 165, 166.
Hobbs, G. (1985). Changes in Fish after Catching. In: Fish Handling and Processing. eds. Aitken, I.M. Mackie, J.H. Merrit and M.L. Windsor Crown, Edinburgh, Scotland.
Huss, H.H. (1995). Quality and quality changes in fresh fish. FAO Fisheries Technical paper 348. Rome pp. 35-56, 68-76.
ICMSF (International Commission on Microbiological Specifications for Foods) (1998). Micro-organisms in foods: Microbial ecology of food commodities. Blackie Academic & Professional, London.
Jay, J.M. (1990). Modern Food Microbiology. 4th Edition. Van Nostrand Reinhold, New York. Pp 221 - 225, p 76
Johnson, S.E. and Clucas I.J. (1996). Maintaining Fish Quality: an Illustrated Guide. Chatham, UK: Natural Resources Institute (NRI)
Marriott, N.G. (1989). Principles of food Sanitation. 2nd Edition, Van Nostrand Reinhold, New York.
MFED (Ministry of finance and Economic Development) (2000) Background to the Uganda Government Budget.
New Vision (2001). Article "Fish exports hit $5.2 m" dated 17th July.
Shewan, J.M. (1977). The bacteriology of fresh and spoiling fish and the chemical changes induced by bacterial action. Proceedings of the conference on Handling Processing and Marketing of Tropical Fish, 51-66, Tropical Products Institute (present NRI), UK.
Thatcher, F.S (1973). Objectives and requirements for marketing of safe and wholesome fish and fishery Products. In: Ed. C.O. Chichester and H.D. Graham. Academic Press, New York.
UFPEA (Uganda Fish Processors and Exporters Association (1999). Annual report.
Woyewoda, A.D., Shaw S.J., Ke P.J. and Burns B.G. (1986). Recommended Laboratory methods for assessment of Fish Quality. Can. Tech. Rep. Fish. Aquat.Sci. No. 1448 fisheries and Oceans, Canada.
APPENDIXES
Table: 1(a) Total plate counts (TPC) (cfu/cm2 or ml) between offshore and landing sites.
|
Area sampled |
Kasensero |
Dimo |
Lambu |
Katosi |
Kiyindi |
Kasenyi |
Average |
|
Offshore water |
2.0x10⁴ |
4.2x10⁵ |
6x10² |
1x10⁴ |
1x10⁴ |
1.9x10⁵ |
5.035 |
|
Onshore water |
7x10⁶ |
7.48x10⁶ |
8.48x10⁶ |
1.69x10⁶ |
4.5x10⁵ |
8.24x10⁶ |
6.74 |
|
Platform surface |
4.92x10⁹ |
2.22x10⁵ |
3.2x10⁴ |
5x10⁴ |
1.4x10⁵ |
2.68x10⁶ |
8.91 |
|
Fishing boat |
1.05x10⁹ |
6.8x10⁴ |
4.2x10⁵ |
7x10⁴ |
6.5x10⁵ |
4.84x10⁶ |
8.25 |
|
Insulated truck floor |
3.87x10⁶ |
9.28x10⁴ |
8.95x10⁵ |
4.1x10⁵ |
5.7x10⁵ |
4.84x10⁶ |
6.25 |
|
Ice at landing site |
2.71x10⁵ |
1.92x10⁵ |
1.23x10⁶ |
2.0x10⁴ |
1.57x10⁶ |
6.3x10⁵ |
5.81 |
() Log. of TPC
Table: 1(b) Coliform counts (cfu/cm2 or ml) between offshore and landing sites.
|
Area sampled |
Kasensero |
Dimo |
Lambu |
Katosi |
Kiyindi |
Kasenyi |
Average |
|
Offshore water |
5.0x10⁴ |
nil |
nil |
nil |
nil |
4.0x10⁴ |
4.26 |
|
Onshore water |
2.0x10⁴ |
4x10⁴ |
2.0x10⁶ |
3x10⁴ |
1.0x10⁴ |
5.6x10⁵ |
5.54 |
|
Platform surface |
2.0x10⁶ |
3.12x10³ |
1.2x10³ |
2x10² |
4.3x10³ |
2.9x10⁵ |
5.58 |
|
Fishing boat |
3.0x10⁶ |
5.0x10³ |
3.2x10⁴ |
2x10² |
3.0x10⁴ |
2.4x10⁵ |
5.74 |
|
Insulated truck floor |
2.7x10⁴ |
2x10³ |
5x10³ |
1.6x10⁴ |
2x10⁴ |
1.6x10⁴ |
4.16 |
|
Ice at landing site |
2.31x10⁴ |
4.3x10³ |
1x10⁴ |
Nil |
6.0x10⁴ |
3.0x10⁴ |
4.33 |
() Log. of Coliform counts
Table 2 (a) Total Plate Counts (TPC) (cfu/cm2) on fish from plant reception to packaging.
|
Sampling Frequency |
||||||||
|
Sampling points |
1 |
2 |
3 |
4 |
5 |
6 |
7 |
Average |
|
Reception |
5.0x10⁴ |
6.1x10⁵ |
4.4x10⁴ |
1.9x10⁵ |
5.8x10⁴ |
4.6x10⁵ |
1.1x10⁵ |
5.12 |
|
Post wash |
4.2x10² |
3.0x10⁴ |
3.7x10³ |
1.6x10⁴ |
2.0x10⁴ |
4.7x10³ |
2.4x10³ |
3.74 |
|
Filleting |
2.0x10³ |
8.0x10⁴ |
4.6x10³ |
1.9x10⁴ |
3.0x10⁴ |
2.4x10⁵ |
1.1x10⁴ |
4.74 |
|
Skinning |
1.0x10³ |
5.8x 10⁴ |
1.6x10³ |
3.0x 03 |
1.2x10⁴ |
9.0x10³ |
4.0x10³ |
3.87 |
|
Trimming |
1.2x10⁵ |
1.3x10³ |
9.1x10² |
1.1x10⁴ |
2.1x10⁴ |
3.0x10⁴ |
6.0x10³ |
4.43 |
|
Final Product |
1.07x10⁴ |
5.15x10⁴ |
1.7x10⁴ |
4.22x10⁴ |
4.6x10³ |
6.7x10³ |
5.6x10³ |
4.30 |
Table: 2(b) Coliform counts (cfu/cm2) on fish from plant reception to final product.
|
Sampling Frequency |
||||||||
|
Sampling points |
1 |
2 |
3 |
4 |
5 |
6 |
7 |
Average |
|
Reception |
6.8x10³ |
4.0x10² |
6.0x10² |
4.0x10² |
1.6x10² |
1.3x10³ |
2.5x10² |
3.15 |
|
Post wash |
1.3x101 |
4.0x101 |
1.0x101 |
3.0x101 |
1.1x10² |
zero |
zero |
1.46 |
|
Filleting |
zero |
6.0x10² |
4.0x10² |
8.0x101 |
1.2x10² |
8.4x10² |
1.6x10² |
2.50 |
|
Skinning |
zero |
6.6x10² |
2.0x10² |
zero |
4.2x10² |
2.0x10² |
2.1x101 |
2.33 |
|
Trimming |
4.0x10³ |
5.8x10² |
- |
4.0x101 |
1.8x10² |
2.4x10² |
2.5x10² |
2.88 |
|
Final product |
1.3x10³ |
5.2x101 |
1.0x10² |
3.0x101 |
4.0x101 |
3.0x101 |
zero |
2.35 |
Table 3 (a) Total Plate Counts (TPC) (cfu/cm2 or ml) of critical items in fish plants.
|
Fish processing plants |
||||||
|
Item |
Gomba |
Byansi |
Marine & |
Hwan Sung |
Clovergem |
Average |
|
Tap water |
nil |
1.03x10⁵ |
3x10³ |
nil |
nil |
4.33 |
|
Batch wash water |
6.9x10⁵ |
2.4x10⁶ |
4.6x10⁷ |
5.7x10⁷ |
NA |
7.41 |
|
Ice |
1.7x10⁴ |
1x10³ |
1x10³ |
4x10³ |
2.8x10³ |
3.71 |
|
Filleting table/surface |
4x10³ |
1.72x10⁵ |
2x10³ |
6x10³ |
4.8x10⁴ |
4.67 |
|
Fish operatives |
2.56x10⁵ |
3.17x10⁴ |
2.75x10⁴ |
7.3x10⁴ |
1.9x10⁴ |
4.91 |
|
Packaging material |
2x10³ |
1.79x10³ |
7.4x10³ |
3.4x10² |
6x10³ |
3.54 |
Table 3 (b) Coliform counts (cfu/cm2or ml) of critical items in fish plants.
|
Fish processing plants |
||||||
|
Item |
Gomba |
Byansi |
Marine & |
Hwan Sung |
Clovergem |
Average |
|
Tap water |
nil |
4.7x10³ |
nil |
nil |
nil |
2.97 |
|
Batch wash water |
2.9x10³ |
1.4x10³ |
2.6x10⁴ |
1.7x10⁴ |
NA |
4.07 |
|
Ice |
1.8x10³ |
3x10² |
nil |
nil |
nil |
2.92 |
|
Filleting table/surface |
7.41x10² |
3.8x10³ |
5.62x10² |
8.71x10² |
2.9x10³ |
3.20 |
|
Fish operatives |
1.88x10² |
2.18x10³ |
2x10² |
5x10² |
1.3x10² |
2.81 |
|
Packaging material |
nil |
2.1x10² |
1.1x10² |
nil |
nil |
1.81 |
Table 4 (a) Microbiological load on contact surfaces of exit port handling facilities at Entebbe.
|
Contact surface |
TPC |
N log |
Coliform count |
(N Log) |
|
Undercarriage container |
2.75x10⁴ |
4.44 |
2x10³ |
3.30 |
|
Polyethylene sheeting |
1x10⁴ |
4.0 |
2x10³ |
3.30 |
|
Overall |
1.86x10⁴ |
4.27 |
2x10³ |
3.30 |
Table 4 (b): Microbiological load on contact surfaces along handling chain from capture to exit port.
|
Sample |
Point along handling chain |
TPC |
Coliform |
|
1 |
Water at fishing ground |
2.53 |
1.0 |
|
2 |
Offshore water |
5.04 |
4.88 |
|
3 |
Onshore water |
6.74 |
5.54 |
|
4 |
Wooden platform at landing site |
8.91 |
5.58 |
|
5 |
Inner surface of a fishing boat |
8.25 |
5.74 |
|
6 |
Floor of plant insulated truck at landing |
6.25 |
4.79 |
|
7 |
Ice in truck at landing site |
5.81 |
4.33 |
|
8 |
Tap water for washing at plant reception |
4.33 |
2.97 |
|
9 |
Water in tub for batch washing |
7.41 |
4.07 |
|
10 |
Filleting tables/polystyrene boards |
4.67 |
3.20 |
|
11 |
Palm of plant workers or operatives |
4.85 |
2.81 |
|
12 |
Ice in processing hall or line |
3.71 |
2.92 |
|
13 |
Packaging material i.e..styro foam boxes |
3.54 |
1.81 |
|
14 |
Undercarriage containers at exit port |
4.44 |
3.30 |
Table 5: Microbiological load on fish surface between capture and packaging.
|
Sampling pt. |
Total Plate count (cfu/cm2) |
Coliform counts (cfu/cm2) |
||
|
Average |
loge of average |
Average |
loge of average |
|
|
At fishing ground |
3.4x10² |
2.53 |
1.0x101 |
1.0 |
|
On boat |
4.7x10⁶ |
6.68 |
1.59x10⁵ |
5.20 |
|
Onshore |
3.10x10⁸ |
8.49 |
6.5x10⁶ |
6.81 |
|
On platform |
2.95x10⁸ |
8.47 |
2x10⁶ |
6.30 |
|
On insulated truck |
2.99x10⁶ |
6.477 |
6.2x10³ |
4.16 |
|
At plant before offloading |
6.64x10⁴ |
4.82 |
1.03x10³ |
3.01 |
|
Washed at reception |
1.46x10⁵ |
5.16 |
1.93x10⁴ |
4.29 |
|
Filleting |
5.50x10⁴ |
4.74 |
3.16x10² |
2.50 |
|
Skinning |
7.41x10³ |
3.87 |
2.13x10² |
2.33 |
|
Trimming |
2.69x10⁴ |
4.43 |
7.59x10² |
2.88 |
|
Final product |
2x10⁴ |
4.30 |
2.24x10² |
2.35 |
Summary of Table 5
|
Sample code |
Sampling point |
TPC |
Coliform |
|
1 |
At fishing ground |
2.53 |
1.0 |
|
2 |
On boat |
6.68 |
5.20 |
|
3 |
Onshore |
8.49 |
6.81 |
|
4 |
On platform |
8.47 |
6.30 |
|
5 |
On insulated truck |
6.48 |
3.79 |
|
6 |
At plant before offloading |
4.82 |
3.01 |
|
7 |
Washed at reception |
5.16 |
4.29 |
|
8 |
Filleting |
4.74 |
2.50 |
|
9 |
Skinning |
3.87 |
2.33 |
|
10 |
Trimming |
4.43 |
2.88 |
|
11 |
Final product |
4.30 |
2.35 |
![]()
![]()
![]()