by
AUSTIN B. WILLIAMS
University of North Carolina Institute of Fisheries Research
Morehead City, North Carolina 28557, U.S.A.
Abstract
Commercial catches of penaeid shrimps in the southeastern United States fluctuate seasonally and annually in patterns indicating dependence on warm environment. Evaluation of annual catch-effort indexes from North Carolina, South Carolina, Georgia, and Texas (states in which species composition is mixed), treated as dependent on summation of coastal air temperatures expressed as net heating degree days, indicates an apparent association of warm years with good catches and cold years with poor catches. This relation is statistically significant for states at the geographic extremes and for all states combined. Annual catch-effort indexes treated as dependent on four types of heat summation, calendar year, calendar year plus preceding six months, heating year (1 July to 30 June), and preceding six coldest winter months, all show similar results. Real differences exist among the four geographic levels reflected in highly significant statistical differences. Use of winter temperatures as predictors for the succeeding annual catch may be possible when better estimates of effort are available.
RAPPORT APPARENT ENTRE CAPTURES DE PENAEIDAE ET SOMMES DE TEMPERATURES
Résumé
Les captures commerciales de Penaeidae dans le Sud-Est des Etats-Unis d'Amérique manifestent des fluctuations saisonnières et annuelles dont la courbe indique qu'elles sont liées à la chaleur du milieu. D'après une étude des indices annuels prises/effort de pêche de la Caroline du Nord, de la Caroline du Sud, de la Géorgie et du Texas (Etats dans lesquels la composition par espèces est mélangée), rapprochés du bilan des températures de l'air (à des stations côtières) exprimé en “degrés-jours” nets, les années chaudes semblent correspondre à de bonnes prises et les années froides à de mauvaises. Ce rapport est statistiquement significatif pour les Etats situés aux extrêmes géographiques et pour l'ensemble de tous les Etats. Les indices annuels prises-effort, étudiées par rapport à quatre bases de bilan des températures: année civile, année civile augmentée des 6 mois précédents, “année de chauffage” (1er juillet - 30 juin), et les 6 mois les plus froids de l'hiver précédent, donnent tous des résultats analogues. Il existe des différences réelles entre les quatre niveaux géographiques, qui se reflètent dans des différences statistiques hautement significatives. Il sera peut-être possible d'employer les températures d'hiver comme indicateurs des captures de l'année suivante lorsqu'on disposera de meilleures estimations de l'effort de pêche.
LA CAPTURA DE PENEIDOS Y LA SUMA TOTAL DE CALOR: RELACION APARENTE
Extracto
Las capturas comerciales de peneidos en el sudeste de los Estados Unidos fluctúan estacional y anualmente, con características que indican que hay dependencia de un ambiente cálido. La evaluación de los índices de captura-esfuerzo anuales de Carolina del Norte, Carolina del Sur, Georgia y Texas (Estados en los que está mezclada la composición por especies), tratados como dependientes de la suma de las temperaturas del aire en la costa, expresadas como días con un grado de calentamiento neto, indica que existe una relación aparente de años cálidos con buenas capturas y años fríos con malas capturas. Esta relación tiene importancia estadística para los Estados en los extremos geográficos y para todos los Estados juntos. Los índices de captura-esfuerzo anuales, tratados como dependientes de cuatro tipos de suma de calor, o sea, ano civil, año civil más los seis meses anteriores, año calórico (1 julio – 30 junio) y los precedentes seis meses del invierno más fríos, todos dan resultados análogos. Existen diferencias reales entre las cuatro zonas geográficas que se revelan como diferencias estadísticas de gran importancia. Cuando se disponga de mejores estimaciones del esfuerzo, será posible emplear las temperaturas del invierno para predecir la captura anual sucesiva.
Three species comprising the bulk of commercial shrimp catches in southeastern United States (Penaeus setiferus (Linn.), white shrimp; P. duorarum Burkenroad, pink or spotted shrimp; and P. aztecus Ives, brown shrimp) are broadly understood with respect to details of life history, ecology, and geographic distribution (Williams, 1965). They are of paramount economic interest (Kutkuhn, 1962), have been tabulated in “Fishery Statistics of the United States” for years, and are subjects for active biological investigations.
Commercial catches of Penaeus species in the southeastern United States vary annually in patterns reflecting life cycles and suggesting apparent relationships to population density. Primarily tropical and subtropical in distribution, the apparent northern breeding limit is Cape Hatteras in the western North Atlantic near the 35th parallel in waters influenced to some degree by the northward flowing Gulf Stream. The pattern of geographic distribution shows dependence of these species on warm environments, and the discussion following indicates possible evaluation of this adaptation in accounting for apparent levels of abundance.
North Carolina shrimp catches, from the northern extreme of the fishery, are among the smallest for any state involved and because of climatological associations may be indicators for a fundamental factor in year-class success. Between 1950 (earliest year in which reliable catch records are available) and 1964, annual shrimp catches from North Carolina (Fig. 1) showed a seesaw variation with a mean of about 4 million lb or 1.8 million kg (headless). The first 8 yr of this period included catches mostly exceeding this level, but catches since then have fallen short.1 The greatest catch occurred in one of the warmest years, 1953; poorest catches were in the cold years, 1958, 1961 and 1963. Such patterns support the idea that temperature may influence catch, and there is ample evidence to document destructive effects of low winter temperatures on overwintering shrimp (Gunter and Hildebrand, 1951; Lindner and Anderson, 1956; Joyce, 1965). The relation shown in Fig. 1 further suggests that warm years may be as beneficial as cold years are deleterious, warm years at the northern extreme of breeding range tending toward optimal environmental temperatures for the species, hence reflecting higher yield.
U.S. Department of Interior, Fish and Wildlife Service, Bureau of Commercial Fisheries. North Carolina Landings, Annual Summary, 1964, pp 1–10.
Ten years ago, the author attempted to correlate temperature with shrimp catch in North Carolina (Fig. 2) during the early 1950's by using average monthly air temperatures from five land-based weather stations along the coastal counties. Air temperatures were chosen because adequate water temperature records were not available; however, temperatures in the shallow coastal embayments closely follow air temperatures (Roelofs and Bumpus, 1953; Williams, 1955), an effect commonly recognized elsewhere. Results were inconclusive and analysis was deferred until more data were available. After the winter of 1958, when ice covered much of the North Carolina sounds for the first time since 1918, and after the somewhat different but colder than normal winters of 1961 and 1963 (Carney, 1958; Hardy, 1961; 1963), data representing extreme as well as more normal years began to be available for analysis.
Averages do not adequately represent extremes, since they tend to mask duration or intensity. A method which would give weight to these factors and yield easily analyzed measurement of temperature was offered by the U.S. Weather Bureau summation of heating degree days. This type of summation, evaluated by Allee, et al. (1949), and Andrewartha and Birch (1954), seemed adaptable to the present problem.
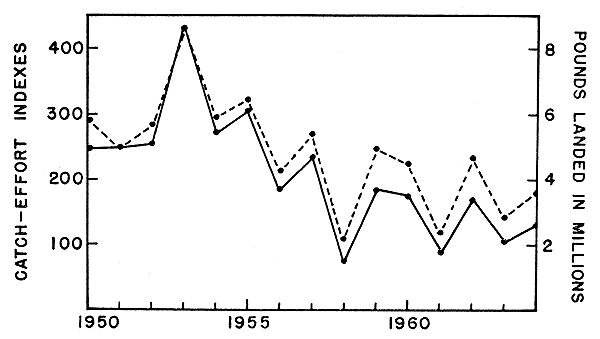
Fig. 1 Annual shrimp catch in North Carolina from 1950 to 1964 based on headless poundage (weight of edible abdomens only). Solid line represents catch-effort indexes. Broken line represents millions of pounds landed.
In this summation, the base temperature for calculation is 65°F (18.3°C).2 Average of maximum and minimum temperature for a 24-hour period is computed, and, if below 65°F, is recorded as heating degree days. (Example: max 65°F (18.3°C), min 55°F (12.8°C); x = 60°F (15.5°C) = 5 heating degree days). The Weather Bureau sums these for each heating year, 1 July to 30 June, at selected stations. By using Weather Bureau data from an appropriate near-shore weather station, suitable cold weather data for shallow water areas are available when actual water temperature records are inadequate or nonexistent. For warmer days, the converse of Weather Bureau heating degree days can be computed as negative heating degree days. (Example: min 65°F (18.3°C), max 75°F (23.9°C); x = 70°F (21.1°C) = -5 heating degree days). In this analysis, any arbitrary scale will serve equally well. Net heating degree days were computed from daily temperatures for 1950–64 on a monthly basis (U.S. Weather Bur., 1950–64).
Cape Hatteras weather station was chosen as the reference for North Carolina temperature data. The station is located centrally on the coast near shrimp fishing grounds in Pamlico Sound and immediate coastal waters.
Although preliminary correlation of net heating degree days with total catch in North Carolina appeared promising, some indication of fishing effort was thought necessary, in order to reduce error. From published statistics, only “yards trawl at mouth” gives any indication of effort. Therefore, total pounds (headless) landed annually divided by yards trawl at mouth for that year can provide a rough catch-effort index (Fig. 1). This index is the dependent variable in the following analyses. However, the quantity, pounds landed, almost parallels the indexes and in this case would serve as well. No weight is given to such factors as “standard fishing days”, as this refinement is beyond our ability to estimate at present.
With temperature and catch-effort data in hand, the following four postulated relationships may be evaluated, each based on annual life cycles of the three species of shrimp.
(1) Annual catch may depend on net heating degree days for the calendar year during which the catch was made. Certainly, activity of shrimp during the fishing season may depend on such.
(2) If net heating degree days have any possible connection with a year's catch and are meaningful, temperatures for a calendar year plus the preceding six months must be considered, in order to evaluate effects of temperature on autumnal recruits harvested the following spring.
(3) Again, some shrimp caught in one calendar year are spawned during the last half of the preceding year. If effect of temperature is most pronounced during early life, a valid relationship may be that one calendar year's catch is dependent on net heating degree days accumulated during the preceding heating year.
(4) Cold of winter may have more direct and indirect effects on catch than warm periods of the year. Therefore, catch for a calendar year may depend on net heating degree days during the coldest preceding six months, e.g. November to April of the preceding winter.
With these propositions (independent variables) set forth, data for a series of regression analyses of North Carolina catches were prepared for analysis by the University of North Carolina Computation Center. Similar catch-effort data from the following areas were subjected to similar analyses: South Carolina (temperature records from Charleston), Georgia (temperature records from Savannah) and Texas (temperature records from Galveston); the wide separation of Texas from the other areas should be noted. If any of the propositions proved to be statistically valid for North Carolina (Fig. 2), where effects of temperature might be most pronounced, they might be statistically valid for milder areas having shrimp populations composed of the same species; however, it is granted that error might be introduced by latitudinal differences in recruitment time and proportional differences in species composition.
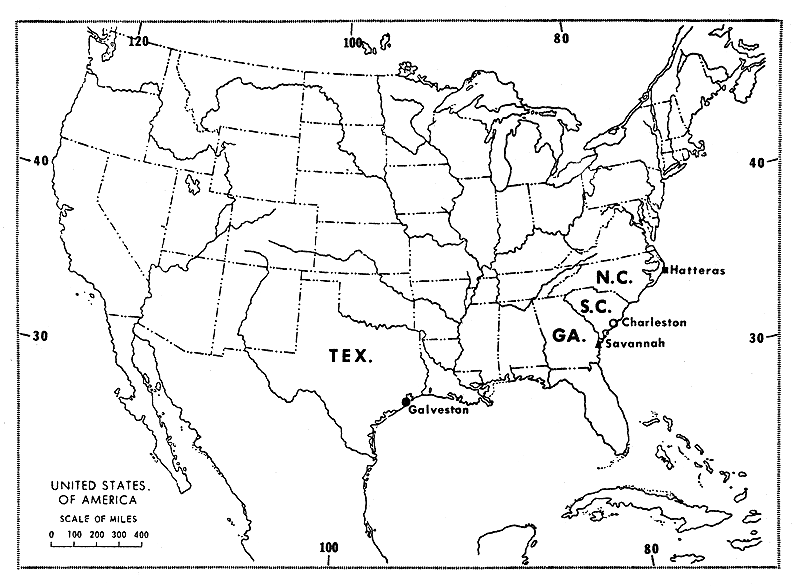
Fig. 2 Map of United States of America showing four states, North Carolina, South Carolina, Georgia, and Texas, with reference points for temperature data, Hatteras, Charleston, Savannah, and Galveston.
Individual regression analyses at each geographic level and combined geographic levels were made for each proposition. Finally, each proposition was subjected to covariance type analysis giving a common slope to each geographic level but a different intercept to each.
When data from all geographic locations are considered together, large numbers of negative net heating degree days (warm temperatures) tend to be associated with large catches, and, conversely, large numbers of positive net heating degree days (cool temperatures) tend to be associated with small catches (Figs. 3, 4, 5, 6). Moreover, this trend is apparent within each of the four geographic levels, although upper and lower limits of each level are necessarily more restricted than the total. Texas shows the largest catches, and these are associated with the largest totals of negative heating degree days. At the opposite end of the trend, North Carolina shows the smallest catches, and these are associated with the largest totals of positive heating degree days. An indifferent and rather broad scatter of points characterizes the intermediate levels, South Carolina and Georgia.
Results of analyses in accordance with the four propositions are summarized in Table I. All regressions for Hatteras are statistically significant. Those for Galveston are also significant (P <.05), with the exception of catch dependent on calendar year (P <.10). Regressions for South Carolina and Georgia are not statistically significant. However, the scatter of points is such that combined geographical data for each proposition is highly significant.
An analysis of covariance type adjustment in which the intercepts are different for the four geographic levels while the slope remains constant for all is summarized in Table II. For each proposition there are real differences among geographic levels reflected in highly significant statistical differences. This fact seems obvious, because the regression lines reflect geographic distributional patterns with a southern center of dispersal and peripheral, less dense populations to the north. Though the trends support such an idea, order of elevation of the intercepts appears contradictory. It would appear that there should be an orderly low to high progression of intercepts from Hatteras to Galveston.
Distribution of marine organisms along coasts of the United States may be governed by optimum temperatures for reproduction and growth to maturity, as suggested for certain molluscs (Hall, 1964). Also, as Gunter (1957) pointed out, the temperature norm for most species is a set of varying conditions and this set may represent an optimum. Nevertheless, fluctuations in apparent population size among well-known species occur where temperatures vary and where optimal sets of conditions are as yet unassessed.
Fluctuations in shrimp production, as reflected in annual catches, have been attributed to both rainfall and temperature. Effects of rainfall analyzed statistically (Hildebrand and Gunter, 1953; Gunter and Hildebrand, 1954) suggested that catches of P. setiferus could be positively correlated with rainfall in Texas. Although such relationship has not proved statistically significant in North Carolina (based on the years 1950 to 1955), effect of heavy rainfall on movements of estuarine, juvenile, and subadult shrimp is well known (Tabb and Jones, 1962; personal observations). Effects of temperature are also recognized. Hildebrand and Gunter (1953) considered such data too nebulous for fruitful discussion, but felt that demonstrable relationships merely awaited amassing sufficient data.
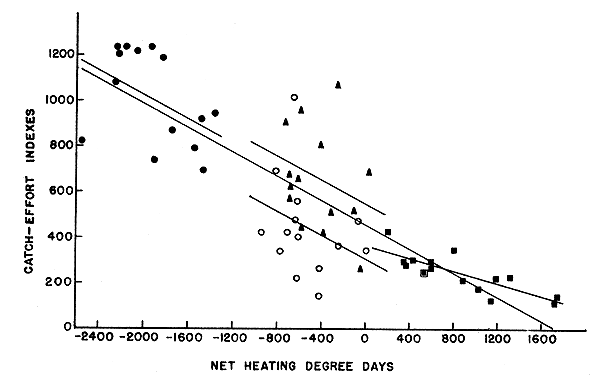
Fig. 3 Annual shrimp production as catch-effort indexes plotted against net heating degree days per calendar year. Four geographic levels represented by four short regression lines: Hatteras ■ (1950–64); Charleston o, Savannah ▲, Galveston • (1950–63). Long line represents pooled data.
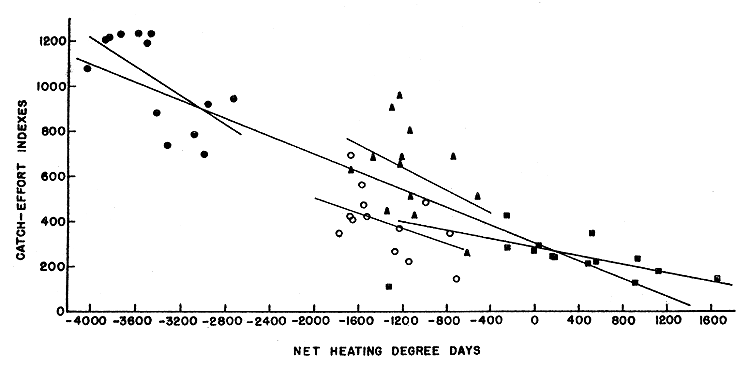
Fig. 4 Annual shrimp production as catch-effort indexes plotted against net heating degree days for calendar year plus preceding six months, Four geographic levels represented by four short regression lines: Hatteras ■ (1950–64); Charleston o, Savannah ▲, Galveston • (1950–63). Long line represents pooled data.
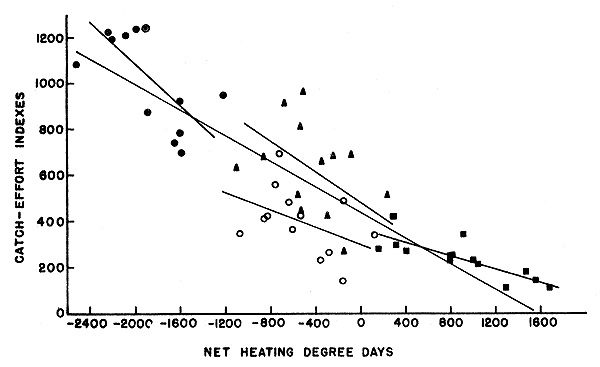
Fig. 5 Annual shrimp production as catch-effort indexes plotted against net heating degree days per heating year (1 July - 30 June). Four geographic levels represented by four short regression lines: Hatteras ■ (1950–64); Charleston o, Savannah ▲, Galveston • (1950–63). Long line represents pooled data.
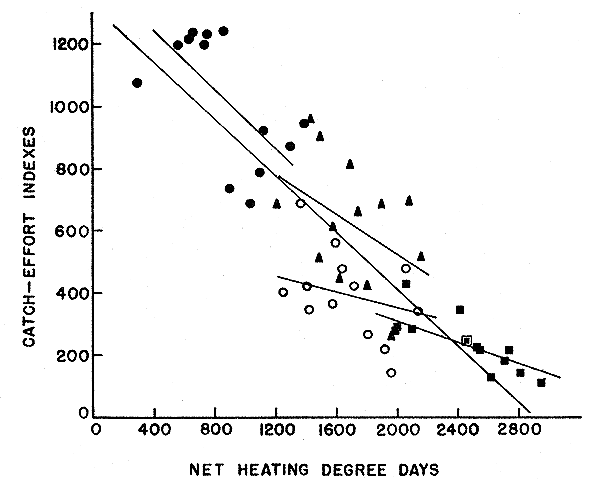
Fig. 6 Annual shrimp production as catch-effort indexes plotted against net heating degree days in preceding six cold months (November-April). Four geographic levels represented by four short regression lines: Hatteras ■ (1950–64); Charleston o, Savannah ▲, Galveston • (1950–63). Long line represents pooled data.
Dependence of P. setiferus, P. duorarum, and P. aztecus on a moderate temperature range for optimum living conditions is widely recognized and documented by experiment and observation. Zein-Eldin and Aldrich (1965) found postlarval P. aztecus surviving temperatures as low as 11°C with almost no growth per month in salinities of about 15 ‰ or above. Significant growth began between 11° and 25°C. Below 15°C, postlarvae showed decreased tolerance to low salinity. The authors speculated that natural distribution and survival of these new recruits from the sea in estuaries is governed by temperatures in spring, with salinity per se having no effect on survival or growth except at extreme temperatures. St. Amant, Corkum and Broom (1963) attributed cyclic movements and densities of P. aztecus postlarvae to control by hydrographic and meteorological conditions in spring. Appearance of postlarvae in abundance was associated with water temperatures greater than 20°C, and rapidity of growth increased markedly above this to summer temperature levels.
It is common knowledge among students of the subject that growth among these three species of penaeids is more rapid in warm than in cold seasons. Numerous estimates concur on growth rates among juveniles of about .05 to 1 mm in total length per day during warm weather in the United States (perhaps less in certain areas, Kutkuhn, 1966), and there is agreement that these rates are depressed during winter. It follows that temperature directly or indirectly influences growth and survival of these species (see Introduction) and thus has an effect on gross production as reflected in catch. One may then ask in what way may catch be made meaningful in terms of temperature? If such relationship can be demonstrated, is it descriptive for a restricted, possibly marginal area of the species' geographic range, or is it general over the latitudes influenced by continental climate treated here? All of these questions were considered in preparation of the analyses. When it became apparent that a good relationship existed between temperature summation and shrimp catch in North Carolina, it seemed logical to extend the query to other areas with somewhat similar mixed populations.
From the analyses, it seems that each of the four propositions has validity. The closest statistical relationship appears to be annual catch dependent on net heating degree days in a heating year; this treatment yields the lowest error (Table I).
Although a good fit of catch with heating year may be historically instructive, a step toward prediction might be possible through another of the postulated relationships. Prediction must be made early in a year to be useful. Therefore, among hypotheses considered here, net heating degree days during winter months are the only useful basis for prediction of catch in a calendar year. For winter in North Carolina, one can even ignore net heating degree days and use only heating degree days as summed by the Weather Bureau with results and margin of error comparable to methods employing net heating degree days. Thus, catch-effort indexes dependent on heating degree days in the preceding six cold months, November to April, yields y = -.217X + 771.22 (sx.y = 56.56, P <.01) for Hatteras during 1951 to 1964. But heating degree days alone for the more southerly localities, treated similarly, yield statistically non-significant results.
Data for South Carolina and Georgia are unsatisfactory in that none of the regressions for these localities are statistically significant, though it is clear from pooled data that they lie along the trend. It is felt that statistics for effort in those states during the years studied are not comparable to similar data from North Carolina and Texas. Indeed, the great shortcoming seen in all data presented here lies in lack of accuracy in assessing effort. In comparisons among states on the Atlantic seaboard and Texas, where more refined records are available (Kutkuhn, 1962), the least accurate effort data had to serve in forming indexes. If this aspect of the records collected could be refined, it is felt that error could be reduced to the point that more meaningful prediction of annual catch might be based on heat summation during the preceding winter.
TABLE I
Catch-effort indexes dependent on four kinds of net degree-day summations at four geographic levels: 5% level accepted as statistically significant
| Net degree-day summation | Locality | Intercept | b | sx·y | P |
| Calendar year | Hatteras | 364.53 | -.139 | 53.22 | <.01 |
| Charleston | 308.15 | -.261 | 211.32 | ns | |
| Savannah | 555.72 | -.259 | 221.27 | ns | |
| Galveston | 472.47 | -.284 | 190.49 | <.10 | |
| Combined | 459.81 | -.267 | 197.11 | <.01 | |
| Calendar year plus preceding 6 months | Hatteras | 291.50 | -.096 | 63.52 | <.01 |
| Charleston | 169.51 | -.169 | 135.37 | ns | |
| Savannah | 345.04 | -.251 | 184.20 | ns | |
| Galveston | -53.50 | -.317 | 165.96 | <.05 | |
| Combined | 311.90 | -.196 | 176.99 | <.01 | |
| Heating year | Hatteras | 370.33 | -.144 | 54.80 | <.01 |
| Charleston | 301.46 | -.191 | 137.84 | ns | |
| Savannah | 487.23 | -.338 | 179.58 | ns | |
| Galveston | 177.74 | -.456 | 155.40 | <.01 | |
| Combined | 444.54 | -.277 | 175.68 | <.01 | |
| Preceding 6 cold months | Hatteras | 669.51 | -.177 | 67.50 | <.01 |
| Charleston | 610.79 | -.128 | 146.72 | ns | |
| Savannah | 1,168.37 | -.320 | 185.47 | ns | |
| Galveston | 1,439.64 | -.477 | 162.32 | <.05 | |
| Combined | 1,330.54 | -.456 | 185.03 | <.01 |
TABLE II
Geographic levels given a common slope for each independent variable (covariance analysis). High statistical significance exceeding the 1% level indicates magnitude of difference in y intercepts for geographic levels
| Net degree-day summation | Locality | Intercept | b | sx·y | P |
| Calendar year | -.210 | 176.84 | <.01 | ||
| Hatteras | 426.19 | ||||
| Charleston | 334.39 | ||||
| Savannah | 575.69 | ||||
| Galveston | 614.02 | ||||
| Calendar year plus preceding 6 months | -.175 | 145.28 | <.01 | ||
| Hatteras | 333.22 | ||||
| Charleston | 161.61 | ||||
| Savannah | 431.28 | ||||
| Galveston | 432.67 | ||||
| Heating year | -.244 | 141.71 | <.01 | ||
| Hatteras | 461.26 | ||||
| Charleston | 274.72 | ||||
| Savannah | 526.73 | ||||
| Galveston | 574.26 | ||||
| Preceding 6 cold months | -.270 | 146.98 | <.01 | ||
| Hatteras | 894.91 | ||||
| Charleston | 847.12 | ||||
| Savannah | 1,084.21 | ||||
| Galveston | 1,262.20 |
Temperature summation is chiefly a useful indication at this stage of analysis. Correlations of catch with rainfall, levels of pollution, or a number of such environmental influences considered together may prove useful enough in prediction that monitoring programs will become practical.
Allee, W.C., et al., 1949 Principles of animal ecology. Philadelphia, W.B. Saunders Company, 837 p.
Andrewartha, H.G., and L.C. Birch, 1954 The distribution and abundance of animals. Chicago, University of Chicago Press, 782 p.
Carney, C.B., 1958 Severe weather. Climatological data, North Carolina. Local clim.Summ. U.S. Weath.Bur., (63):18
Gunter, G., 1957 Temperature. Nem.geol.Soc.Am., 1(67):159–84
Gunter, G., and H.H. Hildebrand, 1951 Destruction of fishes and other organisms on south Texas coast by cold wave of Jan. 28–Feb. 3, 1951. Ecology, 32(4):731–6
Gunter, G., 1954 The relation of total rainfall of the state and catch of the marine shrimp (Penaeus setiferus) in Texas waters. Bull.mar.Sci.Gulf Caribb., 4(4):95–103
Hall, C.A., Jr., 1964 Shallow-water marine climates and molluscan provinces. Ecology, 45(2):226–34
Hardy, A.V., 1961 Special weather summary. Climatological data, North Carolina. Local clim.Summ.U.S.Weath.Bur., (66):18
Hardy, A.V., 1963 Special weather summary. Local clim.Summ.U.S.Weath.Bur., (68):16
Hildebrand, H.H., and G. Gunter, 1953 Correlation of rainfall with Texas catch of white shrimp Penaeus setiferus (Linnaeus). Trans.Am.Fish.Soc., 82:151–5
Joyce, E.A., Jr., 1965 The commercial shrimps of the northeast coast of Florida. Prof.Pap. Ser.mar.Lab.Fla., (6):224 p.
Kutkuhn, J.H., 1962 Gulf of Mexico commercial shrimp populations--trends and characteristics 1956–59. Fishery Bull.Fish Wildl.Serv.U.S., 62(212):343–402
Kutkuhn, J.H., 1966 Dynamics of a penaeid shrimp population and management implications. Fishery Bull.Fish Wildl.Serv.U.S., 65(2):313–38
Lindner, M.J., and W.W. Anderson, 1956 Growth, migrations, spawning and size distribution of shrimp Penaeus setiferus. Fishery Bull.Fish Wildl.Serv.U.S., 56(106):555–645
Roelofs, E.W., and D.F. Bumpus, 1953 The hydrography of Pamlico Sound. Bull.mar.Sci.Gulf Caribb., 3(3):181–205
St. Amant, L.S., K.C. Corkum, and J.G. Broom, 1963 Studies on growth dynamics of the brown shrimp, Penaeus aztecus, in Louisiana waters. Proc.Gulf Caribb.Fish.Inst. (15):14–26
Tabb, D.C., and A.C. Jones, 1962 Effect of hurricane Donna on the aquatic fauna of North Florida Bay. Trans.Am.Fish.Soc., 91(4):375–78
Williams, A.B., 1955 A contribution to the life histories of commercial shrimps in North Carolina. Bull.mar.Sci.Gulf Caribb., 5(2):116–46
Williams, A.B., 1965 Marine decapod crustaceans of the Carolinas. Fishery Bull.Fish.Wildl. Serv.U.S., 65(1):298 p.
Zein-Eldin, Z.P., and D.V. Aldrich, 1965 Growth and survival of postlarval Penaeus aztecus under controlled conditions of temperature and salinity. Biol.Bull.mar. biol.Lab., Woods Hole, 129(1):199–216
ANON., Local clim.Summ.U.S.Weath.Bur., 1950–64