by
R.J. SLACK-SMITH
Department of Fisheries and Fauna
Perth, Western Australia
Abstract
The Shark Bay prawning industry is based on the species Penaeus latisulcatus (western king prawn) and P. esculentus (tiger prawn). The history, present status and management of the industry are described. Methods of fishery data collection are described, with details of the use of these and environmental data in examining two hypotheses propounded to explain a fall in total catch in 1965 to 1966.
Equations are presented for carapace length - tail weight - grade relationships.
The importance of distinguishing the contributions of growth and migration to fluctuations of the fishery is illustrated by data on catch, effort and size-composition. Marking is used to measure the effect of migration. Reference is made to a model to explain and quantify these parameters.
A description of nursery areas is given, and the effectiveness of present management measures is discussed.
LA PECHERIE DE CREVETTES DE LA BAIE DU REQUIN, AUSTRALIE-OCCIDENTALE
Résumé
La pêche de la crevette de la baie du Requin repose sur les espèces Penaeus latisulcatus et P. esculentus. La communication traite de l'histoire, de la situation actuelle et du fonctionnement de cette pêche. Elle décrit les méthodes employées pour le rassemblement des données halieutiques et fournit des détails sur l'emploi de ces renseignements et de données écologiques pour examiner deux hypothèses avancées pour expliquer une diminution des prises globales enregistrée en 1965–66.
Des équations sont présentées pour les rapports longueur de la carapace/poids de la queue/qualité.
Pour illustrer combien il importe de déceler les conséquences de la croissance et des migrations sur la dynamique de la pêcherie, des données sont fournies touchant les prises, l'effort de pêche et la composition par taille. On a recours au marquage pour mesurer les effets des migrations. On se sert d'un modèle pour expliquer et quantifier ces paramètres.
Enfin, la communication décrit les frayères et examine l'efficacité des mesures actuelles d'aménagement.
LA PESQUERIA DE LANGOSTINOS DE LA BAHIA SHARK, AUSTRALIA OCCIDENTAL
Extracto
La industria pesquera de langostinos de la Bahía Shark se basa en dos especies, Penaeus latisulcatus (langostino rey occidental) y P. esculentus (langostino tigre). Se describe la historia, la situación actual y la ordenación de la industria. Se exponen igualmente los métodos de recogida de datos pesqueros, detallando su empleo y los datos del medio ambiente para examinar las dos hipótesis que tratan de explicar la disminución de las capturas totales en 1965–66.
Se indican las ecuaciones de la relación longitud-caparazón-peso de la cola. Con los datos sobre captura, esfuerzo y composición por tamaños se ilustra la importancia de distinguir los efectos del crecimiento y de la migración sobre la dinámica de la pesquería. Para medir las consecuencias de la migración se emplea el marcado. Para explicar y ouantificar estos parámetros se hace referencia a un modelo.
Se describen las zonas de oría y se discute la eficacia de las actuales medidas de ordenación.
Shark Bay is situated on the central western coast of Western Australia between latitudes 24°30' and 26°45' S, and longitudes 113°00' and 114°20' E (Fig. 1). It is approximately 130 mi long and 60 mi across at its widest. Water depths are mostly less than 10 fm (18 m) and extensive shallows border the shores (Fig. 2).
Commercial prawn species were first recorded from Shark Bay in 1904, when a sailing trawler, the RIP, was chartered to explore this and other areas on the Western Australian continental shelf (Oxley, 1905). Further exploratory fishing was carried out jointly from 1952 to 1962 by the Western Australian Fisheries Department and the Commonwealth Scientific and Industrial Research Organization's Division of Fisheries and Oceanography (Slack-Smith and Stark, MS). This survey proved the presence of prawns in commercial quantities in Shark Bay. Intermittent fishing by vessels from Geraldton and Fremantle began in 1957, but prawning on a sound commercial basis did not commence until 1962.
When commercial fishing started, estimates of the potential production of this resource were not available, nor were any data available on its possible resilience to heavy exploitation. To protect the population until the nature of these unknown factors could be determined, the Western Australian Government arbitarily limited the number of trawlers to fish in the Shark Bay area to 25 in 1963 (Slack-Smith, 1963). This number was increased to 30 in 1964. In addition, certain areas (Fig. 2) known to contain large numbers of juvenile prawns throughout the year were closed to all trawling. Two fishing companies were encouraged to establish permanent processing and handling facilities in the area by assigning them 60 percent of the total licenses. This encouragement to industry was a necessary step in the development of a sound prawn industry, as Western Australian companies had no previous experience in prawn fishing. This policy of license limitation, desirable during the early development period, has recently been changed to allow free access to all fishing grounds north of Exmouth Gulf.
In view of the extant limit on fishing effort in Shark Bay, research has been carried out to determine at what level fishing intensity should be maintained to ensure rational exploitation. In addition, specific information on prawn population parameters, such as growth, migration, and natural mortality, were required to determine what procedures were necessary to rationalize other penaeid fisheries on the Western Australian coast. To this end the Shark Bay investigation was expanded to include general penaeid fishery dynamics and the relevant biology, as well as the provision of solutions to its own management problems.
Western Australia legislation requires all fishermen to submit information on their catch, where it was taken (within a 1° lat by 1° long grid), and the number of fishing operations carried out for each month throughout the year. These returns, originally designed for more extensive oceanic fisheries, do not provide sufficiently detailed catch and effort data to allow comprehensive assessment of the Shark Bay fishery. Special log books were designed and issued to fishermen to collect this more detailed information. These books provide a shot by shot record; the position of each shot of the net is referred to a numbered grid (“block”) of 10 by 10 mi. The whole Bay is divided with such squares (Fig. 2). Coded details of the design, mesh size and headrope length are recorded, as well as whether single or double rig gear is used. Slack-Smith and Stark (in press) give further details of the collection and preparation of these data for computer analysis.
Processors purchase approximately 60 percent of all prawns caught. The weighing and recording of the catch of each species landed are therefore accurate. Vessels processing at sea weigh their catch for each trip when it is landed and sent to southern markets by refrigerated road transport. Both sets of data are made available to the Department and the figures are used to adjust fishermen's log book records, which are largely estimated.
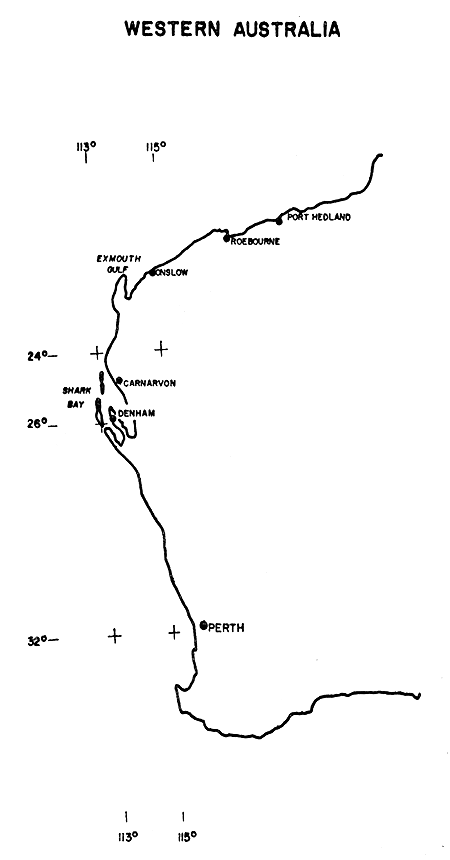
Fig. 1 The Western Australian coast showing the position of Shark Bay.
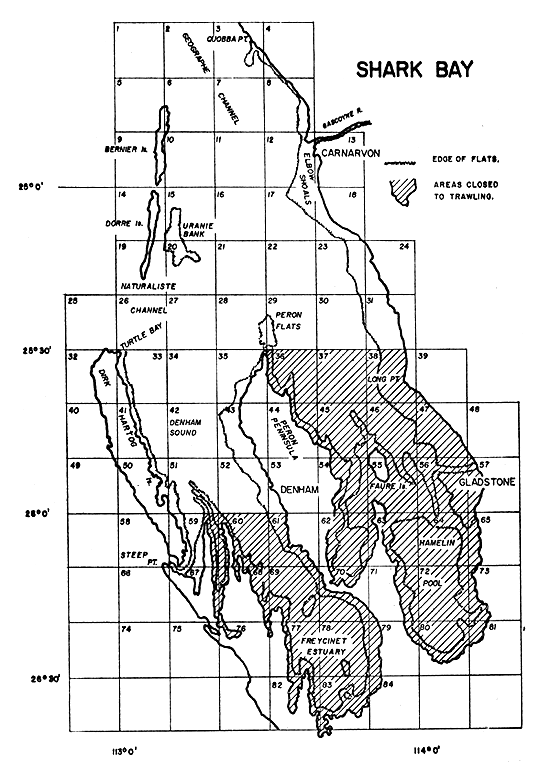
Fig. 2 Chart of Shark Bay showing localities mentioned in the text and the numbering of the blocks used for positioning fishing areas. The portions of the bay closed to trawling are also shown.
Processors head and grade the prawns prior to packing and snap freezing into export packs. Grading is on the basis of the number of tails per lb, and the following categories are used: less than 10, 11 to 15, 16 to 20, 21 to 25, 26 to 30, 30 to 40 and greater than 40 tails per lb. The weight of product in each grade is provided by the processors.
During each week, at least one random sample of prawns caught from each block fished is measured to give the size composition of the catch from that area. Each sample consists of between 300 and 400 prawns, and carapace length is measured to the nearest millimeter. In addition, the sex of each prawn is recorded, together with information on the softness of the shell, i.e. whether the prawn has recently moulted.
3.1 The vessels and gear
The vessels comprising the prawn fleet vary considerably in size and construction. They may be classified as follows:-
3.1.1 Vessels constructed specifically for trawling To date six steel vessels have been built in Western Australia and used in the Shark Bay fishery. These are approximately 50 ft (15 m) overall length. Several wooden trawlers from Queensland fished under charter to a local company between 1962 and 1965, but all except two have now returned to that State. All were under the command of experienced prawn trawlermen.
3.1.2 Vessels used for both the crayfishery and the prawn fishery These form the major group. They range from 42 to 70 ft (13 to 21 m) overall and vary considerably in construction and deck layout. During their first season, this group performed rather poorly when compared with vessels constructed for prawning. This was probably due more to the inexperience of the skippers and crew, rather than vessel design, as the efficiency of the two groups did not vary greatly in the second season.
3.1.3 Trawling gear Flat trawls of several designs are most commonly used in the Shark Bay fishery, although some skippers occasionally use a net of semi-balloon design. Trawl head-ropes vary from 54 to 96 ft (16 to 29 m), depending upon the size and power of the trawler; 75 ft (23 m) nets are the most common. Most trawls are constructed from synthetic fibre. The mesh sizes are 2 in (51 mm) in the body and wings of the net, and 1.75 in (44 mm) in the cod-end. Otter boards are usually 7 ft × 3 ft 6 in (2.1 × 1.0 m), constructed from hardwood and bound with mild steel.
Logan (MS) has provided the only record of the Shark Bay marine environment. Considerable research, most of it not yet published, has been carried out since that time (Logan, personal communication).
4.1 The physico-chemical environment
4.1.1 Water temperatures The winter to summer range is approximately 16° to 27°C in deeper water and channels, whilst that on the shallow flats is approximately 14° to 32°C. During summer, there is a gradient of increasing temperatures from the open sea to the shallow embayments of the south. This gradient is reversed in winter. Stratification seldom occurs, as strong tidal flows and wind turbulence admix the surface and bottom waters.
4.1.2 Salinity Low rainfall (9.0 in (229 mm) per annum) and the mean evaporation rate of 86 in (2,184 mm) per annum maintain hypersaline conditions in all enclosed areas. Salinities ranging from 67‰ in Hamelin Pool to oceanic conditions (35‰) in the vicinity of Naturaliste and Georgraphe Channels have been recorded.
4.2 Tides and currents
Tides are semi-diurnal and range from 4 ft (1.2 m) at spring tide to 1.9 ft (0.58 m) at neaps. Current velocities as high as 3 kn (5.6 km/h) are generated in some channels and velocities of 1.5 kn (2.8 km/h) are common on the trawling grounds. Meteorological and barometric conditions have marked effects on tidal phase and amplitude.
4.3 Sea and weather conditions
Steep, high seas, to 10 ft (3 m) high, are generated by the prevailing east to southwest winds. Most of the Bay is protected from oceanic swell by islands and peninsulas.
Fresh to gale-force southeast to southwest winds prevail in the summer, but in the winter they veer to the east and lose intensity. Occasional summer cyclones occur and attendant winds often reach 120 kn (222 km/h).
4.4 Sediment types and their distribution
Shark Bay sediments are mainly of organic origin, consisting mainly of molluscan and foramenifera shells (Fig. 3). Logan (MS) suggests that the rate of formation of finer sediments is very slow. This seems to imply that, if the bottom were disturbed by some means, whether artificial or natural, a considerable period would elapse before the sediment balance was re-established.
Logan (personal communication) has produced evidence that oceanic water enters Shark Bay through the Naturaliste Channel and then flows north and east through the bay. The magnitude of the eastern component of this flow varies from year to year. The distance that it penetrates toward Cape Peron and the eastern shore is controlled by a dynamic balance between it and high density water flowing northwards from the Hamelin Pool - Faure Island area. Logan has evidence that oceanic water does not reach the area south of Elbow Shoals in some years.
5.1 Species present
Penaeus latisulcatus Kishinouye (western king prawn) and P. esculentus Haswell (tiger prawn) are both fished commerically in Shark Bay. Several other small, non-commercial panaeids are taken in small quantities but not retained. These include Metapenaeus endeavouri (Schmitt), M. dalli Racek, Metapenaeopsis novaeguineae (Haswell), Trachypenaeus anchoralis (Bate), Penaeus monodon Fabricius, P. longistylus, and several species yet to be identified.
5.2 Fishing seasons
Fishing is carried out from autumn to spring, but the dates of starting and finishing vary from year to year, depending upon weather conditions and the availability of prawns.
TABLE I
Dates of commencement and finishing of the fishing season in Shark Bay
| 1962 | from | May 1 | to | September 15 | 1965 | from | March 15 | to | September 15 |
| 1963 | April 15 | August 30 | 1966 | March 21 | September 7 | ||||
| 1964 | March 15 | August 7 | 1967 | March 7 | - |
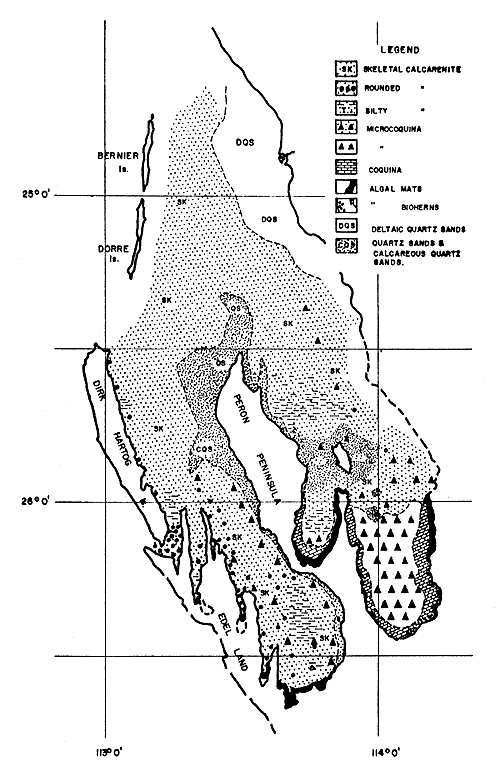
Fig. 3 Chart of Shark Bay showing the bottom sediment distribution (after Logan, MS).
5.3 Areas fished within Shark Bay
During 1962, 1963 and 1964 the majority of prawns of both species were caught in the vicinity of Cape Peron on blocks 22 and 29 (Fig. 2). During 1963 and 1964 the fishery expanded, and some trawling was carried out on blocks 3, 7, 11, 12, 16, 17, 21, 28, 30, 42 and 51. Prior to the 1965 fishing season, trawling commenced on the southern blocks 22 and 29, and when there was a falling-off of catches in early July the trawlers gradually moved northwards; in late July, large catches, almost entirely of tiger prawns, were taken in the northern bay (blocks 3 and 7).
However, at the beginning of the 1965 season, prawn numbers were found to be low in all southern areas, but very good catches were taken on blocks 3, 6 and 7. Abundance rose in the southern bay during May but dropped again in mid-June. Fishing was then confined to blocks 11, 12, 16 (the mid bay) and 42 and 51 (Denham Sound) until fishing ceased. A similar pattern occurred in 1966.
5.4 Catch and effort
The relative fishing power of prawn trawlers varies considerably, hence, before estimates of total effective fishing effort generated by a number of different trawlers can be determined, these differences in efficiency need to be eliminated or corrected. Gulland's (1956) method of calculating and applying relative fishing power (RFP) was modified and used on the Shark Bay effort data. This method converts fishing effort from any given vessel in the fleet to the same units as that of a standard vessel or group of vessels.
Changes in RFP were observed to be largely due to variations in fishing skill rather than to differences in the physical characteristics of vessels, e.g. overall length and horsepower (Fig. 4 and 5).
Further difficulties in computing total effective effort (ĝs) for the Shark Bay prawn fishery arise from the presence of two species in the catch. In some cases (e.g. on block 29) both species are caught; in other cases fishing is selective for one species, e.g. tiger prawns are caught almost exclusively on blocks 3 and 7. Even on the same grounds, some vessels show greater selection for a particular species than other vessels fishing beside them. This selection is reflected in the computed relative fishing power values. As it is extremely difficult to divide accurately effort between the two species, it is assumed that vessels fish randomly with respect to king and tiger prawns and that selection is entirely reflected in the RFP values. The effective effort values given (Tables II and III) are based on this assumption.
The general features of the fishery since its establishment in 1962 are described by the catch (C), effort (ĝ) and catch per unit of effort (C/ĝ) (Tables II and III). King prawn abundance, as measured by catch per unit of effort, has declined since 1962, particularly from 1965 onwards. Total catch fell in these latter years in spite of increased fishing effort.
Tiger prawn catches, on the other hand, have increased throughout the period of the fishery, although catch per unit of effort has dropped.
6.1 Variation of size associated with sex
In a given sample, king prawn females from 23 mm carapace length (C.L.) upwards are noticeably larger than males. A similar size difference for tiger prawns, commencing at 22 mm C.L., is also noted. The increasing spread of values within female size composition modal groups (Fig. 6) suggests that the growth rate of males has decreased. In both species this differentiation coincides with commencement of gonad development.
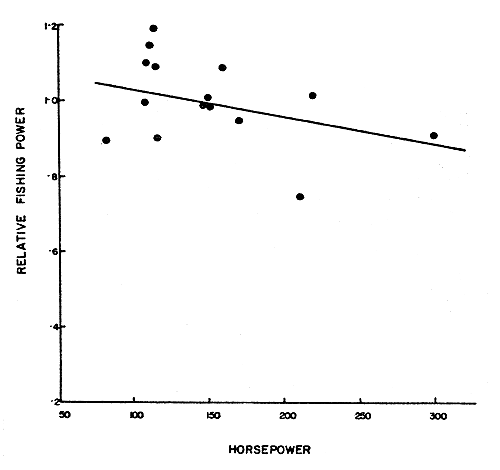 | 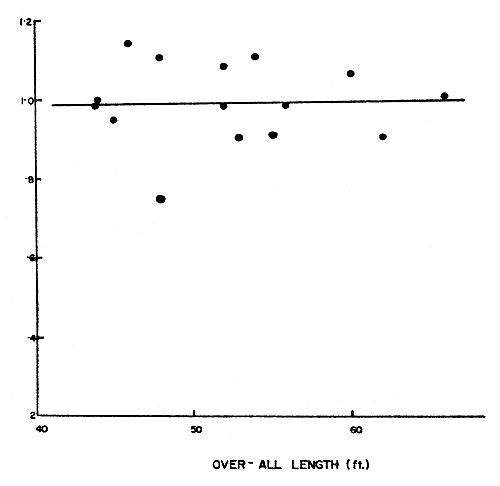 | ||
| Fig. 4 | Relative fishing powers of Shark Bay prawn trawlers plotted against their rated horsepowers. | Fig. 5 | Relative fishing powers of Shark Bay prawn trawlers plotted against their overall lengths. |
TABLE II
Catch (C) in pounds and effort (ĝ) in standard vessel hours fished for king prawns (Penaeus latisulcatus) caught in the Shark Bay fishery from 1962 to 1966
| Year | 1962 | 19631 | 1964 | 1965 | 1966 | ||||||||||
| Month | C | ĝ | C/ĝ | C | ĝ | C/ĝ | C | ĝ | C/ĝ | C | ĝ | C/ĝ | C | ĝ | C/ĝ |
| March | 12,166 | 228 | 53.3 | 1,485 | 83 | 17.8 | 8,938 | 129 | 69.2 | ||||||
| April | 50,136 | 169.9 | 295 | 229,016 | 2,687 | 85.2 | 54,746 | 2,294 | 23.9 | 98,918 | 3,841 | 25.1 | |||
| May | 24,944 | 309 | 80.7 | 89,416 | 239.7 | 373 | 316,158 | 3,707 | 85,2 | 214,546 | 4,044 | 53.0 | 162,957 | 5,077 | 32.1 |
| June | 67,875 | 944 | 71.9 | 149,120 | 300.6 | 496 | 263,433 | 4,000 | 65.8 | 288,606 | 3,440 | 83.8 | 160,027 | 5,756 | 27.8 |
| July | 81,543 | 871 | 93.6 | 186,218 | 360.8 | 516 | 227,738 | 4,287 | 53.1 | 181,113 | 3,440 | 52.6 | 140,576 | 6,304 | 22.3 |
| Aug. | 41,030 | 683 | 60.0 | 84,660 | 190.9 | 443 | 17,632 | 241 | 73.1 | 135,887 | 2,473 | 54.9 | 60,899 | 3,520 | 17.3 |
| Sept. | 3,582 | 68 | 51.2 | 83,574 | 972 | 85.9 | 5,078 | 278 | 18.3 | ||||||
| TOTAL | 218,874 | 3875 | 76.1 | 559,550 | 1261.9 | 443 | 1,066,143 | 15,150 | 70.3 | 959,957 | 16,746 | 57.3 | 637,393 | 24,905 | 25.6 |
TABLE III
Catch (C) in pounds and effort (ĝ) in standard vessel hours fished for tiger prawns (Penaeus esculentus) caught in the Shark Bay fishery from 1962 to 1966
| Year | 1962 | 19631 | 1964 | 1965 | 1966 | ||||||||||
| Month | C | ĝ | C/ĝ | C | g | C/g | C | ĝ | C/ĝ | C | ĝ | C/ĝ | C | ĝ | C/ĝ |
| March | 9,669 | 178 | 54.3 | 4,621 | 85 | 54.3 | 22,300 | 119 | 187.3 | ||||||
| April | 65,793 | 169.6 | 387 | 157,718 | 2,194 | 71.8 | 83,277 | 2,361 | 35.3 | 188,278 | 3,676 | 51.3 | |||
| May | 9,163 | 234 | 39.1 | 173,638 | 239.7 | 724 | 237,060 | 3,551 | 66.7 | 289,924 | 4,195 | 69.1 | 224,684 | 4,776 | 47.1 |
| June | 44,690 | 672 | 66.5 | 94,592 | 300.6 | 315 | 215,554 | 3,678 | 58.6 | 195,988 | 3,644 | 53.7 | 265,579 | 5,420 | 49.0 |
| July | 24,995 | 988 | 25.2 | 78,764 | 360.8 | 218 | 199,504 | 5,939 | 33.5 | 139,414 | 3,591 | 38.8 | 141,801 | 5,718 | 24.8 |
| August | 13,476 | 815 | 16.5 | 55,493 | 190.9 | 290 | 19,729 | 185 | 106.6 | 92,761 | 2,614 | 35.5 | 64,011 | 3,317 | 19.5 |
| Sept. | 4,128 | 167 | 24.7 | 29,937 | 825 | 36.2 | 7,176 | 159 | 45.1 | ||||||
| TOTAL | 96,452 | 2,876 | 33.5 | 468,280 | 1261.9 | 371 | 829,234 | 15,725 | 52.7 | 844,922 | 17,315 | 48.8 | 913,829 | 23,185 | 39.4 |
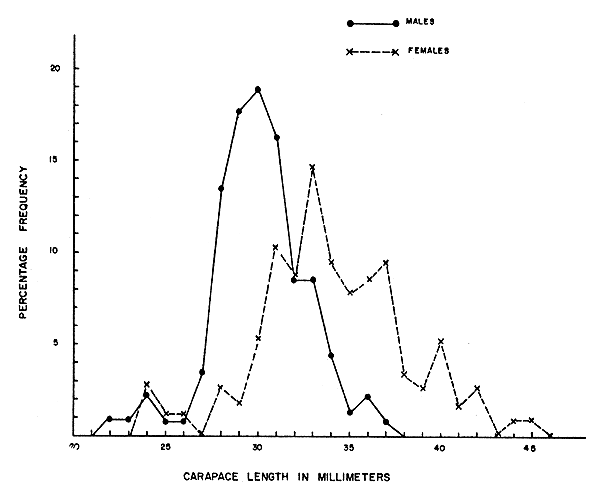
Fig. 6 Percentage frequency distribution of carapaoe lengths of male and female king prawn (Penaeus latisulcatus. (From commercial catch taken on Block 2 during 10 April 1967).
The sex ratio of king prawns fluctuates from 40.5 to 61.0 percent of females, with a mean ratio of 47.0 percent; tiger prawns vary from 34.6 to 70.0 percent, with a mean of 47.0 percent. However, in most samples the sex ratio falls between 45.0 and 52.0 percent of females.
6.2 Relationship of size composition with factory packing grades
During periods of the season when size-composition sampling is not carried out, it is often possible to examine broad changes in size-composition from the percentage of the landed catch falling into each of the tail-weight grades packed at the processing factories. Experiments to determine the relationship between carapace length and tail weight have been carried out (Tables IV and V).
Some caution is needed in the use of size-composition changes determined in this manner, as they take no cognisance of the sex ratio of the catch.
6.3 Growth and seasonal changes in size composition
The modal size of both king and tiger prawns on a particular block has been observed to increase as the fishing season progresses. If the size-composition of prawns on a number of blocks at a given time is examined, the modal size increases from south to north. Results from dye marking experiments have shown that south-to-north migration of both species occurs. Hence, any changes in size composition observed either in time or from different geographic locations contain elements of both growth and migration. Growth rate studies using progression of modes have not been possible due to the presence of this migration component in any changes in modal size.
It is therefore necessary to make a detailed study of all available data, so that the contribution of all the above factors to changes in size composition may be determined. To this end, the numbers caught in each mm carapace-length size-group, on each block fished, during each week of the season, have been computed for both sexes of each species. These data form the basis of a fishery model used to interpret the changes described above (Slack-Smith, in press).
The life cycle of seagoing penaeids in the Gulf of Mexico has been extensively studied by a number of workers (Weymouth, Lindner and Anderson, 1933; Lindner and Anderson, 1956; Williams, 1955; Simmons, 1957; Tabb, Dubrow and Jones, 1962; St. Amant, Broom and Ford, 1966; and others). Dakin (1938), Morris and Bennet (1951) and Racek (1959) have studied the life cycles of several Australian species, particularly Penaeus plebejus. Although the life cycles of the commercial species in Shark Bay have not been studied in detail it is likely that they follow the general pattern observed by these authors.
The Shark Bay prawn nursery areas are extensive (Slack-Smith, 1966) (Fig. 7), although the greatest concentrations of postlarvae and juveniles have been found on the eastern shore between Gladstone and the Gascoyne River. The greatest abundance of both species has been observed in summer.
Data on the duration of the planktonic, nursery area or pre-recruit phases of the penaeid life histories in Shark Bay is not available, but it appears certain that individuals reach sexual maturity within one year after hatching.
Size composition data of the commercial catch shows that recruitment probably occurs throughout the year, with peak recruitment occurring in summer. This latter recruitment provides the bulk of the Shark Bay prawn catch.
Recruitment to the fishery occurs in waves. The waves are probably related to lunar periodicity in spawning and subsequent migration from the nursery areas.
TABLE IV
Mean tail and total weight in g for king prawns (Penaeus latisulcatus) in given carapace lengths. Recovery rates and carapace length-total weight relationships are also given.
| Carapace Length (mm) | M A L E | F E M A L E | ||||||
| No | Mean Total Wt(g) | Mean Tail Wt(g) | Recovery Rate (%) | No. | Mean Total Wt(g) | Mean Tail Wt(g) | Recovery Rate(%) | |
| 26 | 1 | |||||||
| 27 | 2 | 10.55 | 7.09 | 66.7 | ||||
| 28 | 5 | 14.18 | 8.51 | 60.0 | 3 | 14.18 | 7.09 | 50.0 |
| 29 | 16 | 15.51 | 9.30 | 60.0 | 3 | 14.18 | 7.09 | 50.0 |
| 30 | 31 | 16.70 | 10.29 | 61.6 | 4 | 17.72 | 8.87 | 50.1 |
| 31 | 37 | 18.57 | 11.48 | 61.8 | 8 | 17.72 | 10.63 | 60.0 |
| 32 | 42 | 20.07 | 12.47 | 62.1 | 17 | 20.44 | 12.11 | 59.2 |
| 33 | 63 | 22.06 | 12.70 | 62.7 | 35 | 21.46 | 13.78 | 64.2 |
| 34 | 69 | 23.84 | 14.88 | 62.4 | 38 | 24.10 | 14.54 | 60.4 |
| 35 | 58 | 26.39 | 16.61 | 62.9 | 48 | 25.54 | 15.65 | 61.3 |
| 36 | 36 | 27.75 | 17.12 | 61.7 | 42 | 28.35 | 17.38 | 61.3 |
| 37 | 11 | 30.28 | 18.68 | 61.7 | 46 | 30.19 | 18.34 | 60.8 |
| 38 | 4 | 33.68 | 19.50 | 75.9 | 34 | 32.09 | 19.39 | 60.4 |
| 39 | 2 | 31.89 | 21.26 | 66.7 | 29 | 33.18 | 20.78 | 59.1 |
| 40 | 25 | 36.86 | 21.55 | 58.4 | ||||
| 41 | 8 | 39.86 | 23.05 | 57.8 | ||||
| 42 | 13 | 40.88 | 24.52 | 60.0 | ||||
| 43 | 12 | 44.31 | 26.59 | 60.0 | ||||
| 44 | 2 | 46.01 | 28.35 | 61.5 | ||||
| 45 | ||||||||
| 46 | ||||||||
| 47 | ||||||||
| TOTALS | 377 | 372 | ||||||
Recovery Rate - Female - 60.2%
Male - 62.2%
Combined - 61.1%
Length-Weight Relationships
Male - Total weight = 0.252 × (C.L.) 2.895
Female - Total weight = 0.150 × (C.L.) 2.677
TABLE V
Mean tail and total weights in g for tiger prawns (Penaeus esculentus) in given carapace lengths. Recovery rates and carapace length-total weight relationships are also given
| Carapace Length (mm) | M A L E | F E M A L E | ||||||
| No. | Mean Total Wt(g) | Mean Tail Wt(g) | Recovery Rate (%) | No. | Mean Total Wt(g) | Mean Tail Wt(g) | Recovery Rate (%) | |
| 26 | 3 | 18.91 | 9.44 | 50 | ||||
| 27 | 15 | 19.85 | 15.11 | 76 | ||||
| 28 | 34 | 20.02 | 16.67 | 83 | ||||
| 29 | 84 | 22.96 | 16.19 | 71 | 14 | 24.30 | 16.19 | 67 |
| 30 | 80 | 25.52 | 18.43 | 72 | 10 | 34.02 | 22.68 | 67 |
| 31 | 69 | 27.95 | 18.09 | 65 | 34 | 30.02 | 16.67 | 56 |
| 32 | 33 | 27.50 | 20.61 | 75 | 53 | 30.00 | 21.40 | 71 |
| 33 | 17 | 33.34 | 23.36 | 70 | 50 | 32.89 | 22.68 | 69 |
| 34 | 17 | 33.34 | 26.68 | 80 | 50 | 34.02 | 24.95 | 73 |
| 35 | 5 | 45.36 | 28.35 | 63 | 35 | 38.87 | 25.91 | 67 |
| 36 | 21 | 43.21 | 29.71 | 69 | ||||
| 37 | 10 | 45.36 | 34.02 | 75 | ||||
| 38 | 13 | 52.33 | 43.60 | 83 | ||||
| 39 | 12 | 56.70 | 37.79 | 67 | ||||
| 40 | 8 | 56.70 | 42.53 | 75 | ||||
| 41 | 4 | 56.70 | 49.61 | 88 | ||||
| 42 | 9 | 62.99 | 37.79 | 60 | ||||
| 43 | 3 | 75.61 | 56.70 | 75 | ||||
| 44 | ||||||||
| TOTALS | 357 | 329 | ||||||
Recovery Rate - Female - 69.7%
Male - 71.0%
Combined 70.3%
Length-Weight Relationships
Male Total Wt. = 0.0961 × (C.L.) 2.471
Female Total Wt. = 0.488 × (C.L.) 2.197
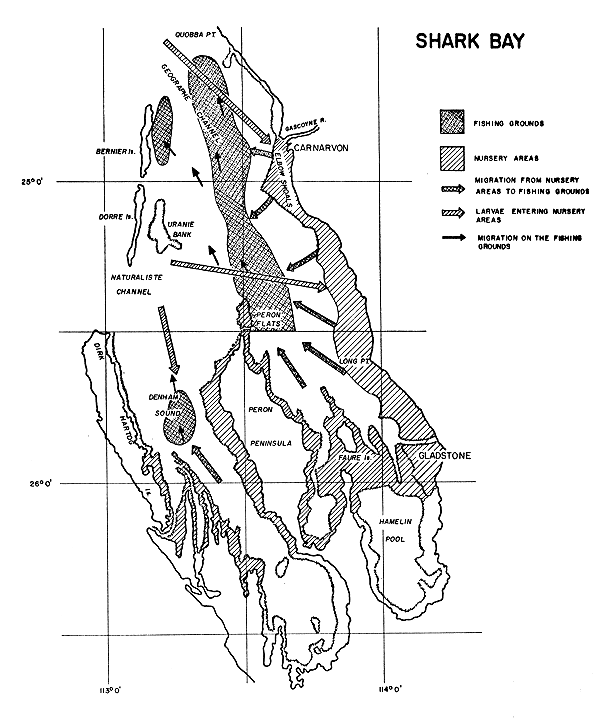
Fig. 7 The generalized pattern of prawn migration in Shark Bay. Fishing areas are also shown.
The basic aim of any research orientated towards fishery management is to provide administration and industry with information on which to regulate the fishery, so that the fishery persists and maximum catches are taken. In most fisheries it is sufficient to study growth, mortalities and exploitation rate and to express yield as yield per recruit (Y/R). Although recruitment often varies, the presence of a number of age-classes in the stock usually dampens any violent effects these may have on catch.
Penaeid fisheries are usually on one-year stocks and consequently violent fluctuations in recruitment are followed by similar fluctuations in catch. The pre-requisite for management of a prawn fishery is the knowledge of whether these fluctuations are random, cyclic or generally trending downwards. Random and cyclic changes are not usually related to the effects of fishing.
The decline in mean annual density (C/ĝ) observed in the Shark Bay fishery has not been observed for a sufficient period to determine whether it is only random or cyclic. However, if these changes are examined in relation to the areas fished (Section 5.3) it appears that recruitment of both king and tiger prawns to the southern grounds has decreased markedly from 1965 onwards. As penaeid fecundity is extremely high (Ingle, 1961; Joyce and Eldred, 1966) it seems unlikely that fishing has affected the production of potential recruits. This suggests that changes in the environment in the area should be examined in relation to the decline in recruitment. Two hypotheses based on changes in the physical environment are postulated.
The first is that intensive trawling in the southern bay during 1962 to 1964 has caused deleterious changes in the habitat. The otter boards and footropes of trawl nets stirred up the fine sediment and brought it into suspension. These were then carried away by the strong tidal and current flow (Sections 4.4 and 4.5). Under natural conditions, drifting fine sediment was probably largely trapped by patches of sea grass, but much of this weed has also been destroyed by trawling. This destruction of suitable prawn habitat would decrease the numbers available to be caught by either increasing the rate of natural mortality or the rate of migration on the affected grounds.
The second hypothesis is that changes in the pattern of water circulation (Section 4.5) have decreased the numbers of postlarvae reaching the nursery areas south of Elbow Shoals (Fig. 2). The southern areas were the major king prawn nurseries, whereas the areas to the north comprised the major tiger prawn nurseries. Thus, if lodgment of both species was decreased on the southern nursery areas during 1965 to 1966, the observed distribution of densities (C/g) and catches of both species during these seasons would follow. An observation by Logan (personal communication) that the eastern tongue of water entering Shark Bay (Section 4.5) did not reach the area south of Elbow Shoals during 1965 to 1966 adds weight to the second hypothesis.
If the first hypothesis proves correct, and if sediment regeneration in disturbed areas is extremely slow, the life of the fishery is probably limited. In such circumstances management measures should be directed toward prolonging its life by making the maximum of catch with the minimum of habitat damage. If sediment regeneration is relatively fast, the regulation of fishing effort and of areas fished should be instituded, so that habitat damage is not allowed to become substantial in any particular area. In both cases, the most efficient method of exploiting the resource is to ensure that the M/K ratio (Holt, 1962) of the fishable stock and the relative fishing power (i.e. catchability) of the trawlers are maximised. In the latter case, limitation of fishing effort could be obtained by license limitation.
However, if the hypothesis is true that the fluctuations observed in the Shark Bay fishery are caused only by changes in the current patterns within the Bay, it is not necessary to limit fishing effort to ensure that the population is maintained, and research should be orientated towards maximising M/K.
Dakin, W.J., 1938 The habits and life history of a penaeid prawn Penaeus plebejus Hesse. Proc.zool.Soc.Lond., 108(2):163–83
Gulland, J.A., 1956 On the fishing effort in the English demersal fisheries. Fishery Invest., Lond. (2), 20(5):1–41
Holt, S.J., 1962 The application of comparative population studies to fisheries biology - an exploration. In the exploitation of natural animal populations, edited by E.D. Le Cren and M.W. Holdgate. Oxford, Blackwell Scientific Publications, pp. 51–69
Ingle, R.M., 1961 Synoptic rationale of existing Florida shrimp regulations. Proc.Gulf Caribb.Fish.Inst., 13: 22–7 issued also as Contr.mar.Lab.St.Bd Conserv., (48)
Joyce, E.A. Jr. and B. Eldred, 1966 The Florida shrimping industry. Educ.Ser.Fla Bd Conserv., (15):1–47
Lindner, M.J. and W.W. Anderson, 1956 Growth, migration, spawning and size distribution of shrimp Penaeus setiferus. Fishery Bull.Fish Wildl.Serv.U.S., 56(106):555–645
Logan, B.W., MS Environments, forameniferal facies and sediments of Shark Bay, Western Australia. Perth, University of Western Australia, Geology Dept., Thesis
Morris, M.C. and I. Bennett, 1951 The life history of a penaeid prawn (Metapenaeus) breeding in a coastal lake (Tuggerah, N.S.W.). Proc.Linn.Soc.N.S.W., 76(5–6):164–82
Oxley, W.C., 1905 Report on the fishing industry for the year 1904. West.Aust.Parliament Rep., (3):33 p.
Racek, A.A., 1959 Prawn investigations in eastern Australia. Res.Bull.St.Fish.N.S.W., (6):57 p.
St. Amant, L.S., J.G. Broom and T.B. Ford, 1966 Studies of the brown shrimp Penaeus aztecus in Barataria Bay, Louisiana. Proc.Gulf Caribb.Fish.Inst., 18:1–17
Simmons, E.C., 1957 Ecological survey of the Upper Lagune de Madre of Texas. Publ Inst. mar.Sci.Univ.Tex., 4(2):156–200
Slack-Smith, R.J., 1963 License limitation in the Shark Bay prawn fishery. In Report and Proceedings of Fisheries Management Seminar, Australian Dept. of Primary Industry, 1963, 36–8
Slack-Smith, R.J., 1966 The prawning industry in Shark Bay. Western Australia, Fisheries and Fauna Dept: 13 p.
Slack-Smith, R.J., 1969 A descriptive and analytical model of the Shark Bay prawn fishery. FAO Fish.Rep., (57) vol. 3:657–66
Slack-Smith, R.J. and A.E. Stark, 1968 Automatic processing of western Australian prawn fishermen's log books. FAO Fish.Rep., (57) vol.2: 309–19
Slack-Smith, R.J., MS Results of prawn trawling surveys in Shark Bay and Exmouth Gulf 1953–62.
Tabb, D.C., D.L. Dubrow, and A.E. Jones, 1962 Studies on the biology of the pink shrimp, Penaeus duorarum Burkenroad, in Everglades National Park, Florida. Tech. Ser.Fla Bd Conserv., 37:1–31
Weymouth, F.W., M.J. Lindner, and W.W. Anderson, 1933 Preliminary report on the life history of the common shrimp Penaeus setiferus (Linn). Bull.Bur.Fish., Wash., 48:1–26
Williams, A.B., 1955 A contribution to the life histories of commercial shrimps (Penaeidae) in North Carolina. Bull.mar.Sci.Gulf Caribb., 5(2):116–46
Acknowledgements
Mr. A.J. Fraser and Mr. B.K. Bowen read the manuscript and made many suggestions during its preparation. Mrs. E.H. Barker prepared the figures.