![]()
![]()
![]()
There are two results for each criterion and for the criteria when combined to form categories: the amount of surface area in each class, summarized in Tables 3.1 and 3.2 and; the corresponding spatial distributions of the areas summarized as maps and graphs (Figs. 3.1 to 3.26).
From an areal distribution viewpoint, about 35% of Africa is apt for two crops/y with good growth, about 19% for two crops/y with fair growth and nearly 27% for one crop/y with no special precautions for over-wintering brood stock.
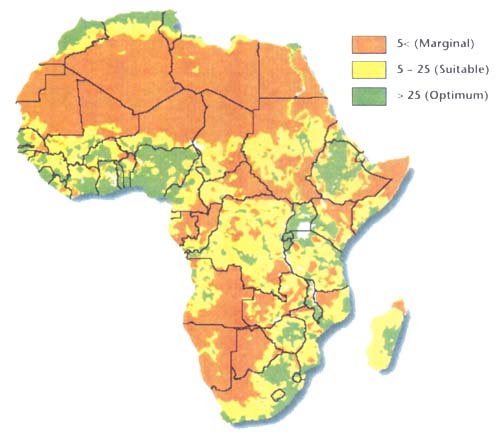
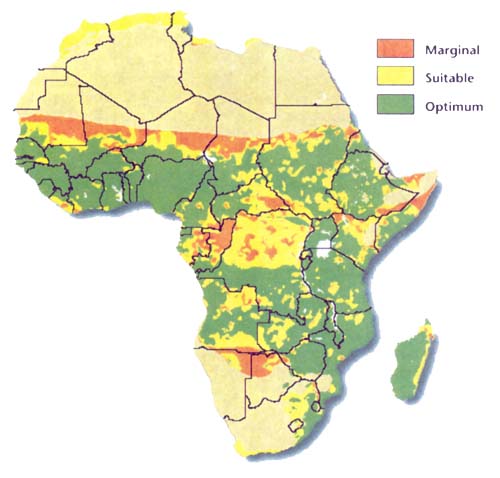
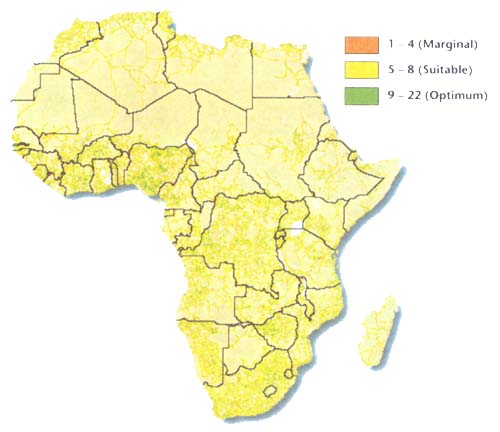
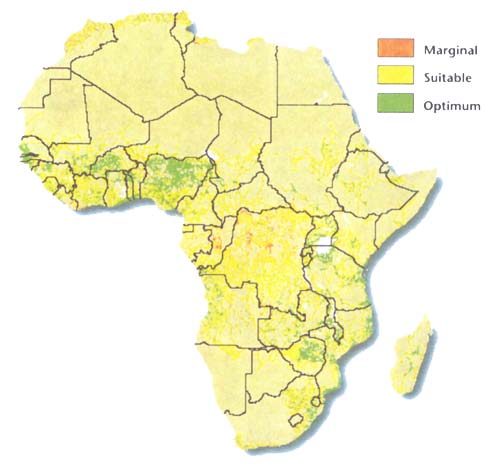
The remainder of the results are considered according to their area distributions among the levels of optimum and suitable. In this regard, about 24% of the continent has an optimum amount of rainfall to supply ponds and an additional 10% of the area has a suitable amount. Perennial streams and rivers at a relatively high density account for about 4% of the surface, and 6% of the area contains perennial streams and rivers at a moderate (i.e., suitable) density. When these two criteria are combined into the category Water Availability, the resulting area is 29% optimum and 14% suitable.
Table 3.1 Summary of results for each criterion expressed as percentages of the total surface area of Africa pertaining to each threshold
| Main Criterion | Two Crops/y; Good Growth | Two Crops/y; Fair Growth | One Crop/y; Fair to Good Growth |
| Water Temperature | >=26°C for 12 mo. (35.1%) | >=22°C for 12 mo. (19.4%) | >=22°C for 8 consecutive mo. and >=14°C for 4 mo. (26.8%) |
| Other Criteria | Optimum | Suitable | Marginal |
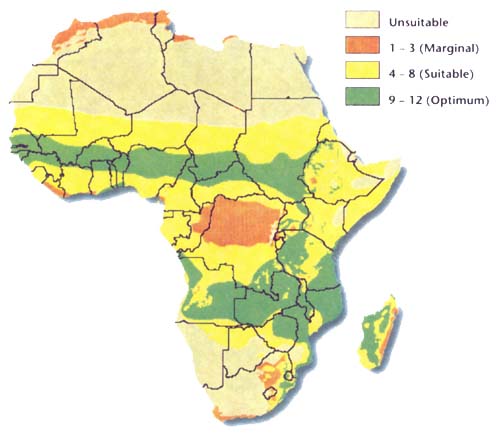
| Water from Rainfall Runoff (mm) | >1,199 (24.2%) | 1,000–1,199 (9.5%) | 700–999 (11.9%) |
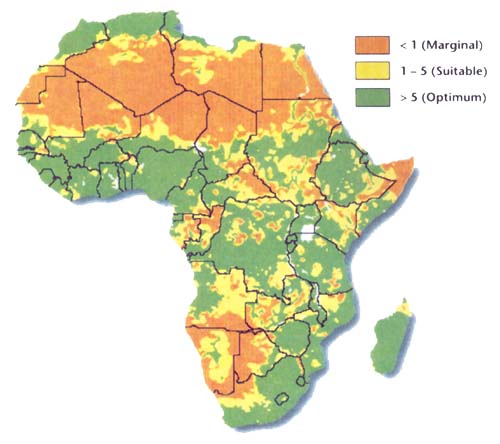
| Water from Perennial Streams and Rivers (2'×2' pixels/10'× 10'pixel) | 9–23 (3.8%) | 5–8 (6.3%) | 1–4 (3.5%) |
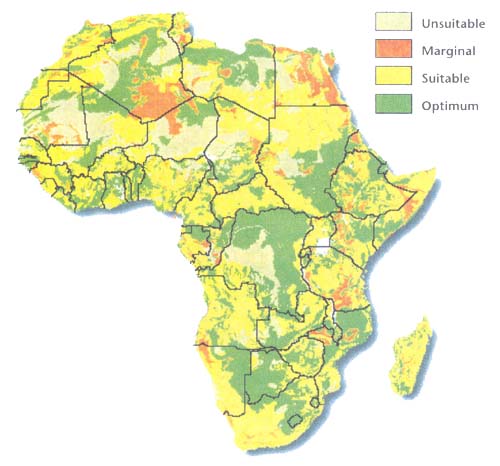
| Topography (% Slope) | 0–8 (58.1%) | 8–30 (32.0%) | >30 (9.9%) |
| Soil Texture | Mainly fine (16.1%) | Mainly medium (53.4%) | Mainly Coarse (30.5%) |
| Local Market Potential for Commercial Farms (Inhabitants/km2) | >25 (16.5%) | >5 to <25 (28.4%) | <5 (54.1%) |
| Local Market Potential for Subsistence Farms (Inhabitants/km2) | >5 (44.9%) | >1 to <5 (17.5%) | <1 (37.6%) |
| Paved and Motorable Roads (2'× 2' pixels/ 10'×10' pixel) | 9 to 22 (0.4%) | 5 to 8 (8.6%) | 1 to 4 (23.1%) |
| Inputs from Agricultural Byproducts (Crop Yield and Variety) | Moderate to good, varied (20.2%) | Moderate, few crops (32.6%) | Low (7.3%) |
Table 3.2 Summary of results for the criteria combined into categories expressed as percentages of the total surface of Africa. The water temperature category is the same as in Table 3.1.
| Category | Optimum | Suitable | Marginal |
| Water Availability (Runoff + ½ Perennial Streams and Rivers) | 29.1% | 13.6% | 11.9% |
| Engineering Capability (Soil Texture + Topography) | 35.7% | 39.1% | 11.0% |
| Economics for Subsistence Farms (Local Market Demand + Inputs) | 38.8% | 16.3% | 9.5% |
| Economics for Commercial Farms (Local Market Demand + Inputs + Road Infrastructure) | 5.6% | 15.7% | 2.9% |
Soil texture is the criterion that is most limiting at the optimum level, about 16% of the African surface, but an additional 32% rates suitable. At the other end of the spectrum, topography is the least limiting with about 58% of the continent at an optimum level and 32% at a suitable level; however, it has to be remembered that within the range 0–8% slope, it is slopes of 0–2% that are ideal. Combining texture with slope provides an engineering suitability category that is optimum over about 36% of the surface and suitable over 39%.
Regarding the economic criteria, for subsistence farming nearly 45% of the area can provide local markets for farmgate sales at an optimum level and an additional 17% provides a suitable level of farmgate sales. Inputs at an optimum level are on 22% of the area and at a suitable level on 33% of the area. Combining local market potential with inputs as an economic category for subsistence farming gives nearly 39% of the area as optimum and about 16% as suitable.
A look at economic criteria for commercial farming shows that only 3% of the surface has a relatively high density of paved and motorable roads and an additional 6% has a moderate density. Further, only 16% has a local market potential for farmgate sales at an optimum level, but there is an additional 28% that has a suitable local market potential. Bringing in inputs to form a three-criteria economic category for commercial farming results in less than 6% of the area being optimum and nearly 16% being suitable.
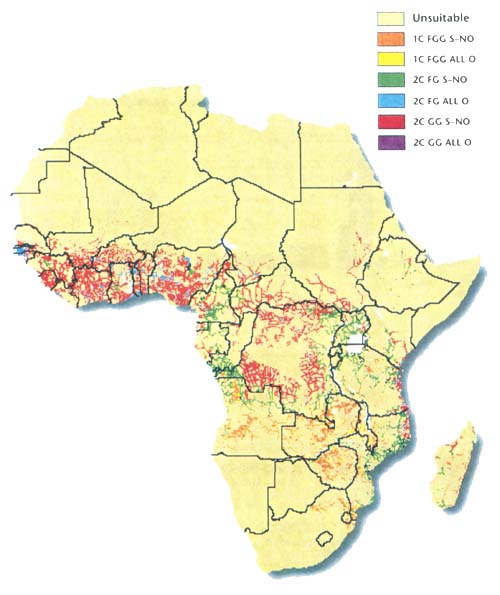
From the viewpoint of fish growth and over-wintering, as indicated by water temperatures, Central and West Africa are favoured (Fig. 3.1).
The spatial distribution of annual rainfall as indicative of runoff (Fig. 3.2) corresponds approximately to that of temperatures for two crops/y. Combining annual rainfall and perennial streams and rivers to show overall water availability for commercial farming illustrates that low rainfall areas in the south and north could benefit from using water from perennial streams and rivers (Fig. 3.3).
Areas with optimum or suitable topography are widely distributed (Fig. 3.4). Optimum and suitably textured soils occur in many of the areas where the other physical factors are also favourable. Zaire and Kenya are particularly favoured as are northern Mozambique, Ethiopia and Kenya. There are large areas of marginally textured soils in Angola and Tanzania and to a lesser extent in Zambia (Fig. 3.5). Taken together as the engineering capability category, it is apparent that much of the unsuitable area is in North Central Africa, where other conditions are also unsuitable or marginal (Fig. 3.6).
The distribution of optimum local markets for subsistence farming includes the great bulk of West Africa, much of Central Africa south of the equator and Southeast Africa, including Madagascar (Fig. 3.7). Zambia is noteworthy in being limited in this regard.
Inputs as agricultural by-products at optimum and suitable levels occur in a broad band across Africa north and south of the equator and throughout much of Southeast Africa, including Madagascar (Fig 3.8). However, northern Zaire and northern Congo possess large areas where agricultural by-products are potentially insufficient for fish farming.
Areas with local market potential for commercial fish farming at an optimum level are patchily distributed except in West Central Africa, around Lake Victoria, Ethiopia, Zimbabwe and eastern Madagascar (Fig. 3.9).
A look at local market potential together with inputs for subsistence fish farming indicated that large parts of central equatorial Africa are marginal or suitable, but much of the area north and south is optimum, interspersed with patches of suitable areas (Fig. 3.10).
Most of the area otherwise favoured for commercial fish farming is served by paved and motorable roads, albeit at relatively low densities (Fig. 3.11). Nigeria and Zimbabwe are notable exceptions.
Putting together local market potential, road infrastructure and inputs clearly shows the limitation of transport possibilities as an economic factor for commercial fish farming (Fig. 3.12). Again, it is West Africa, the Lake Victoria area and Zimbabwe that stand out for concentrations of suitable and optimum conditions.
Fig. 3.1 Water temperature
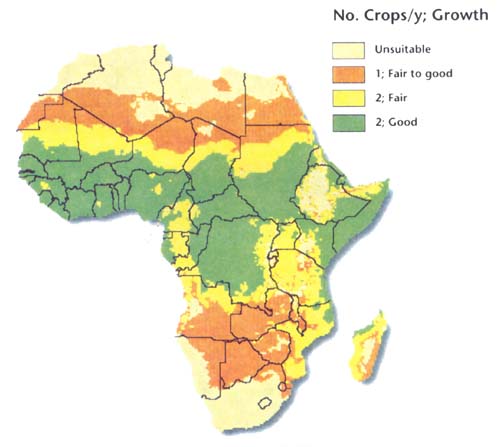
Water temperature in three regimes corresponding to two crops/y with good growth (t=>26°C for 12 months), two crops/y with fair growth (t=>22°C for 12 months) and one crop/y with fair to good growth and over-wintering without special precautions (t=>14°C for 4 months).
Fig. 3.2 Annual rainfall
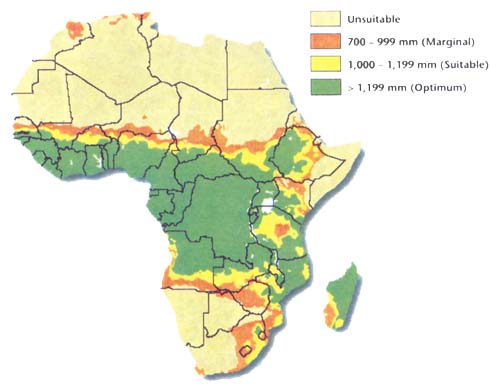
Annual rainfall interpreted as rainfall runoff to fill fish ponds.
Fig. 3.3 Water availability
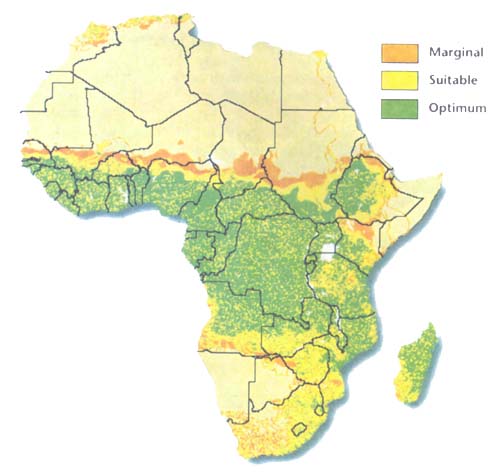
Water availability for ponds by combining annual rainfall with density of perennial streams and rivers.
Fig. 3.4 Slope
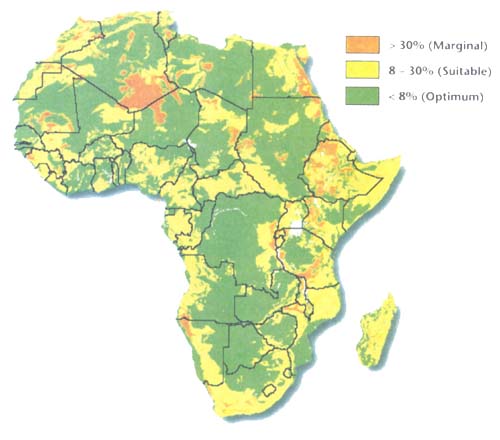
Slope interpreted in terms of suitability of topography for pond construction.
Fig. 3.5 Soil texture
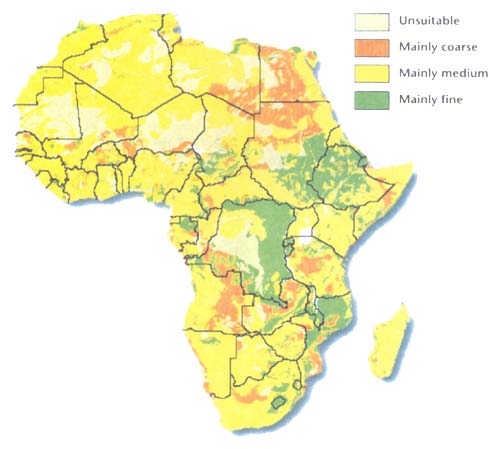
Soil texture interpreted in terms of suitability for pond construction.
Fig. 3.6 Engineering capability
Engineering capability for pond construction obtained by combining soil texture and slope.
Fig. 3.7 Local market demand (subsistence)
Population density (inhabitants/km2) interpreted in terms of local market demand for fish farmed at the subsistence level.
Fig. 3.8 Inputs
Productivity and variety of crops interpreted as availability of agricultural by-products as inputs for fish farming.
Fig. 3.9 Local market demand (commercial)
Population density (inhabitants/km2) represented in terms of local market demand for fish farmed at the commercial level.
Fig. 3.10 Economics (subsistence)
Economic considerations for subsistence fish farming obtained by combining local market demand with availability of agricultural by-products as inputs.
Fig. 3.11 Roads
Availability of road infrastructure interpreted as density of paved and motorable roads in terms of numbers of 2' × 2' road containing pixels per 10' × 10' pixel.
Fig. 3.12 Economics (commercial)
Economic considerations for commercial fish farming obtained by combining local market demand, availability of agricultural by-products as inputs and availability of road infrastructure.
In all, there are some 9.2 million km2, equivalent to 31% of the African surface, containing area apt for warm water fish farming at a subsistence level (Fig. 3.13). Of the 48 countries, 40 possess at least some land apt for this use.
The locations that are amenable to two crops/y with good growth, with other categories ranging from all suitable to all optimum, encompass 5.1 million km2, equivalent to about 17% of the African surface. They occur in a band extending from Senegal and the Gambia east to southern Sudan and south into Zaire (Fig. 3.13). TCGG areas also extend south along the west and east African coasts, along the latter to northeastern Mozambique and along the former into Rio Muni and Gabon. TCGG area is also found in northwestern Madagascar.
There are 33 countries in total that possess some TCGG land area. In absolute terms, Zaire possesses more than 1 million km2, of which a significant amount is optimum for the other three categories (Fig 3.14). Other countries with large absolute areas are Nigeria, Sudan, the Central African Republic and Côte d'lvorie. In all, there are 12 countries that possess from 0.1 million km2 to more than 0.5 million km2 in this category.
In relative terms, there are 12 countries, all in West Africa, that have more than 60% of their land area in the TCGG category (Fig. 3.15). Some of these countries - for example, Togo, Benin, Gambia and Guinea-Bissau - have relatively large areas at optimum levels for the other categories as well.
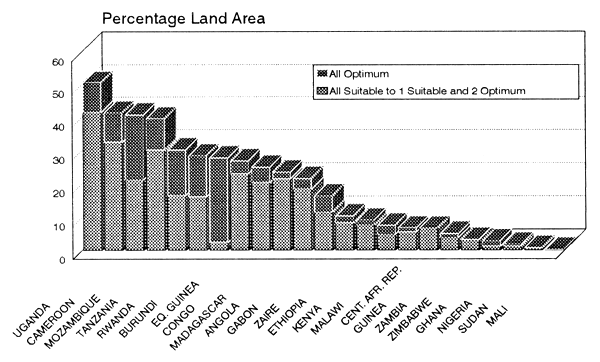
The locations that are amenable to two crops/y with fair growth and other categories ranging from suitable to optimum encompass 8% of the African surface, or 2.3 million km2. They extend south from Cameroon to northern Angola and from northeastern Zaire and Uganda, south to Tanzania, Mozambique and northern and western Madagascar (Fig. 3.13).
In all, 23 countries have some area that can support two crops/y with fair growth. In absolute terms, Zaire, Tanzania, Mozambique and Angola have more than 300,000 km2. In the former three countries, there are significant amounts that are optimum for the other three development categories (Fig. 3.16).
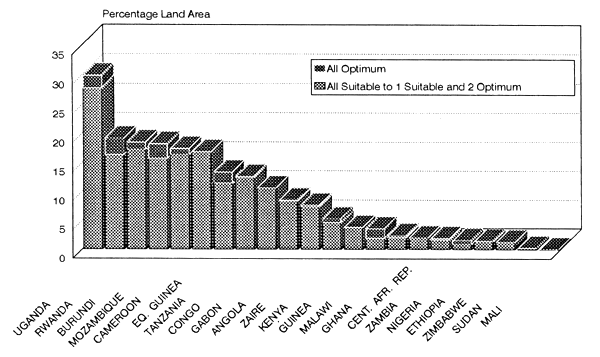
In relative terms, Uganda possesses more than 50% of TCFG area, and Tanzania and Mozambique more than 40%. There are an additional six countries that possess more than 25% of TCFG area (Fig. 3.17). Equatorial Guinea (the Rio Muni part) is notable in that nearly all of its TCFG area is optimum for the other three development criteria. Mozambique is another country with a relatively large proportion of its TCFG area optimum for other development categories.
Fig. 3.13 Subsistence fish farming potential
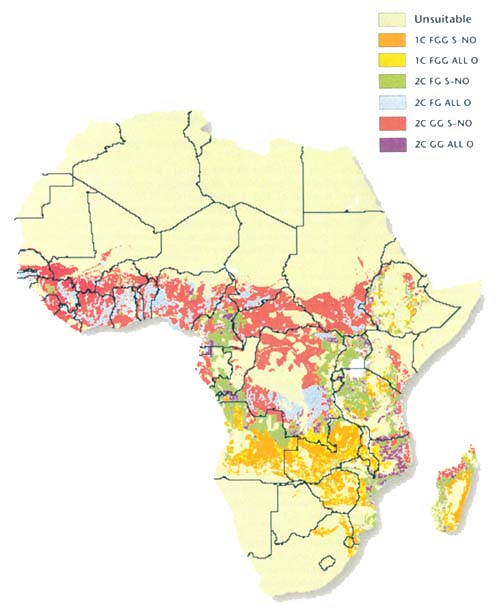
The potential for subsistence fish farming under three temperature regimes providing for one crop/y (1C) with fair to good growth (FGG), two crop/y (2C) with fair growth (FG) and with good growth (GG) in combination with water availability, engineering capability and economic considerations ranging from all suitable to one suitable and two optimum (S-NO), or all optimum (all 0).
Figure 3.14 Potential as Land Area by Country Subsistence Fish Farming-Two Crops/y with Good Growth
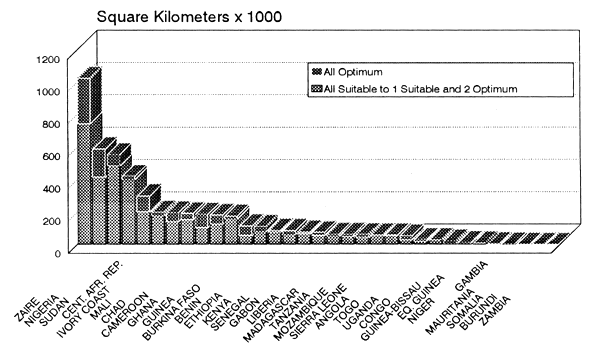
Figure 3.15 Potential as Percentage Land Area by Country Subsistence Fish Farming-Two Crops/y with Good Growth
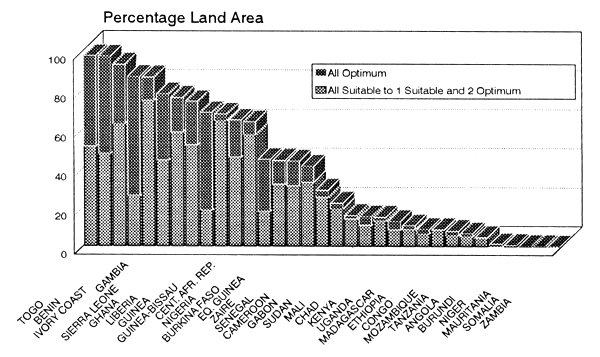
Figure 3.16 Potential as Land Area by Country Subsistence Fish Farming-Two Crops/y with Fair Growth
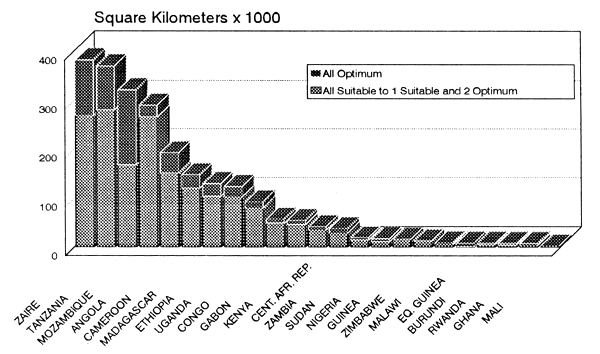
Figure 3.17 Potential as Percentage Land Area by Country Subsistence Fish Farming-Two Crops/y with Fair Growth
The locations that are amenable to one crop/y with fair to good growth encompass 1.8 million km2, corresponding to 6% of the African surface (Fig 3.13). Twenty countries possess territory in this category. Foremost among these in absolute area is Zambia, followed by Angola (Fig. 3.18). Both of these countries have large areas that are optimum for the other development categories.
In relative terms, nearly 70% of Zambia's area is rated OCFGG, as is more than 50% of Swaziland, Malawi and Zimbabwe (Fig. 3.19). Each of these countries has areas that are optimum for the other development categories along with the OCFGG area.
In all, there are some 3.9 million km2, equivalent to 13% of the African surface, containing area apt for warm water fish farming at a commercial level (Fig. 3.20). Of the 48 continental countries, 40 possess at least some land apt for this use.
West and Central Africa are favoured for commercial farming with much potential for two crops/y and good growth (Fig. 3.20). Thirty-three countries possess some TCGG areas apt for commercial fish farming. In terms of absolute area, Zaire, Nigeria and Côte d'lvorie lead with more than 0.5 million km2, 0.38 million km2 and 0.2 million km2, respectively (Fig. 3.21).
In relative terms, Sierra Leone, Togo, Côte d'lvorie, and Guinea-Bissau have more than 50% of their area in TCGG territory (Fig. 3.22). In Guinea-Bissau and Togo, 25% and 15%, respectively, of area is optimum for the other two development criteria. There are seven other countries that have more than onefourth of their land areas in TCGG territory.
Commercial farming with two crops/y and fair growth is apt along a band running from Cameroon south to Angola and in East Africa along a band running southeast from northeastern Zaire through Uganda, Tanzania and Mozambique (Fig. 3.20).
Twenty-three countries possess some land capable of two crops/y with fair growth (Fig. 3.23). This encompasses 0.9 million km2, equivalent to about 3% of the African surface. Zaire, Mozambique, Tanzania and Angola each have more than 0.1 million km2 of such area (Fig. 3.23). In relative terms, about 30% of the land area of Uganda is in TCFG country and eight other countries possess from 11% to 19% of their national areas in TCFG land (Fig. 3.24).
Figure 3.18 Potential as Land Area by Country Subsistence Fish Farming-One Crop/y with Fair to Good Growth
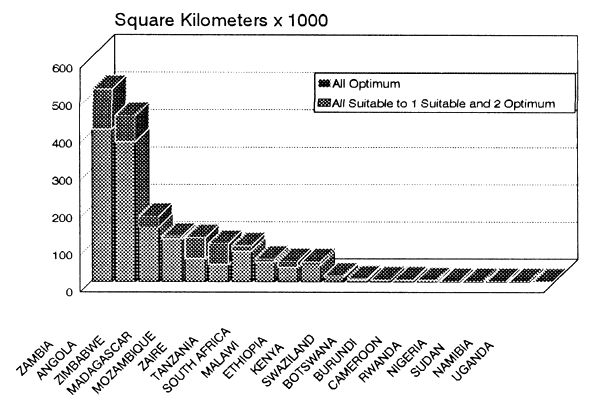
Figure 3.19 Potential as Percentage Land Area by Country Subsistence Fish Farming-One Crop/y with Fair to Good Growth
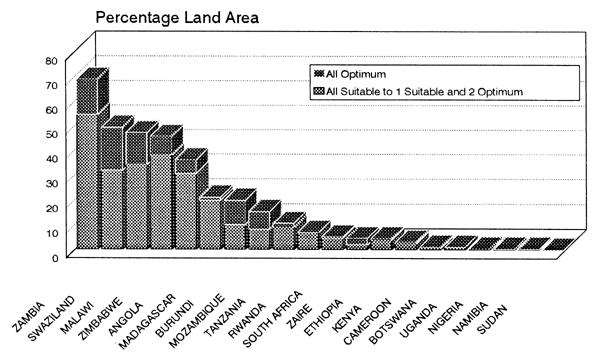
Fig. 3.20 Commercial fish farming potential
The potential for commercial fish farming under three temperature regimes providing for one crop/y (1C) with fair to good growth (FGG), two crops/y (2C) with fair growth (FG) and with good growth (GG) in combination with water availability, engineering capability and economic considerations ranging from all suitable to one suitable and two optimum (S-NO), or all optimum (all 0).
Figure 3.21 Potential as Land Area by Country Commercial Fish Farming - Two Crops/y with Good Growth
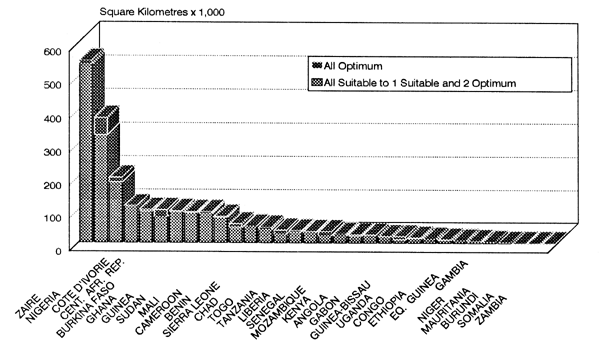
Figure 3.22 Potential as Percentage Land Area by Country Commercial Fish Farming-Two Crops/y with Good Growth
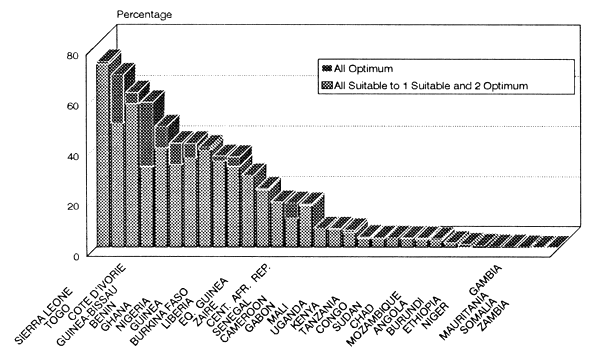
Figure 3.23 Potential as Land Area by Country Commercial Fish Farming - Two Crops/y with Fair Growth
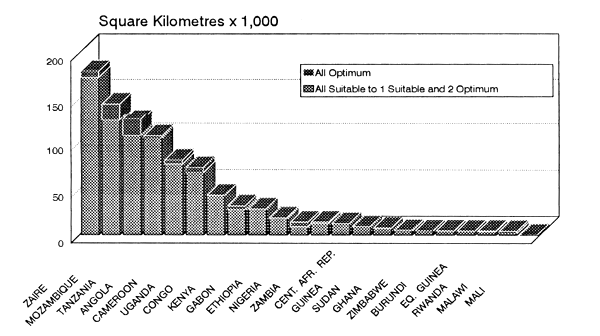
Figure 3.24 Potential as Percentage Land Area by Country Commercial Fish Farming-Two Crops/y with Fair Growth
There are 19 countries that have territory capable of commercial fish farming with one crop/y and fair to good growth (Fig. 3.20). This area encompasses 0.7 million km2, equivalent to about 2% of the African surface. In absolute terms, Zambia, Angola and Zimbabwe are leaders, each with from 0.1 to 0.2 million km2 of such area (Fig. 3.25). In relative terms, Swaziland, Malawi and Zimbabwe each have more than one-fourth of their area in OCFGG. About 5% pf tje PCFGG area of Swaziland and Malawi is optimum for the other three development criteria (Fig. 3.26).
![]()
![]()
![]()