| RWA/87/012-Aide-mémoire No 134 | RWA/87/012/TRAM/134 |
par
A. MUTAMBA et A. MULINDABIGWI
DOSSIERS:
DP 9/10
MINAGRI
RR/PUND
FAOR
Rijavec, FIO
West, RAFR
Everett, DIPA
Greboval, IFID
Chrono
Diary: Mutamba
| PNUD/FAO-RWA/87/012 | janvier, 1991 |
Fishing activity a well as research work in lake Kivu, have been concentrating almost exclusively on Limnothrissa miodon, the only species representing an important stock in the lake.
The fishing activity followed the introduction of that clupeid
from lake Tanganyika in 1959 (COLLART 1960). The “Projet de
Développement de la Pêche au lac Kivu” funded by the Government
of Rwanda, the Government of the Netherlands. UNDP and executed
Ever since project activity started in november 1979, catches steadily increased up until 1987. From that period, landings at the project facilities decreased both as a result of a decrease in abundance and the development of “outside-project” markets. This down trend was reversed by the end of 1989, and despite the presence of “outside-project” markets, landings have returned to higher levels.
The decrease in landings in 1987–1988, made responsible officials to realise the necessity to control the exploitation of Limnothrissa miodon stock. Consequently, it was decided to reinforce the existing research activity of the project and to set up a programme to evaluate and manage the L. miodon stock.
This document is aiming at presenting actions and main results of the research programme which aim is to produce the necessary elements to assess the stock ant to manage lake Kivu fishery.
2.1 General
Lake Kivu is a mountain lake which present characteristics are resulting from volcanic activity in the region. Originally flowing northwards into lake Albert and the Nile system, the eruption of Birunga's volcanoes created a volcanic dam in the north and after the level rose by 50 to 70 meters the flow was reversed southwards into lake Tanganyika through the Rusizi river (PEETERS, 1957 and 1959).
Lake Kivu occupies an area of 2370 km2 of which about 1000 km2 (42%) belong to rwanda. A total of 250 islands representing 315 km2 are present. Ijwi island in Zaïre is the biggest with 200 km2.
Depth averages 240 m and in the north basin, a maximum depth of 490 m can be found (DEGENS et al. 1972). Due to its great depth and very steep shores, the littoral area of lake Kivu having access to oxygenated waters only represents 12% (BEADLE, 1981)
2.2 Climatology and limnology
The region enjoys a continental tropical humid climate, characterised by alternating dry and humid seasons. A small dry season takes place in december-january, followed by the great rainy season in february-may, the great dry season in june-september and the small rainy season in october-november.
Average rainfall over the lake is
Regular wind blow mainly from south-east to east, crossing the lake in an oblique way or laterally. During the night, col winds coming down from the volcanoes modify this system after sun set, they last up to 7 to 8 o clock or and sometimes later.
Lake Kivu is a meromictic lake characterized by a partial movement of the first upper 70 m. A thermal stratification separates two layers which do not mix. Below 70 m there is a deoxygenated layer, and below 200 m presence of methane gas in big quantities (50 km3) is characteristic of lake Kivu (DEGENS et al. 1971,1972).
Surface temperatures vary between 22°C ann 24°C a steep thermocline of 1°C amplitude is located between 20 and 30 m DAMAS 1937; VAN DERBEN 1959).
pH is quite high in surface waters (9.45), this is the result of alkaline salts rich in soda coming from bottom lavas. The pH is constant in epilimnion, reaches 9 at 50 m and decreases to reach 7.2 at 100 m. Below 100 m, waters are slightly acid (6.85 to 6.75) probably as a result of the presence of high concentrations of carbon dioxide in deeper waters (VAN MEEL 1954).
2.3 The biological environment
2.3.1 Fish fauna
Lake Kivu is of a great poverty in terms of fauna, it is a result of its ecological youth. Prior to the introduction of Limnothrissa miodon, the fish fauna was related to that of lake Albert being a restricted version of the species which had survived from the volcanic eruption turmoil and could adapt to the consecutive changes in environment. This fauna however did not show any relation with that of lake Tanganyika.
According to the various authors, it is considered that 16 to 19 species representing 3 families (Cichlidae, Claridae and Cyprinidae are represented). With the introduction of Limnothrissa miodon in 1959 (COLLART 1960: SPLIETHOF et al., 1983), another family the Clupeidae was added.
2.3.2 Plankton fauna
Primary production in lake Kivu is relatively low, considerable seasonal variations influence the zooplankton biomass, reaching a maximum in april-december (VERBEKE, 1957; KISS, 1959). This plankton bloom results from recirculation of nutriments from the mixolimnion. Primary production varies between 240 and 375 g C/m2/year in the northern part of the lake (JANNASH, 1975). Phytoplankton data from march 1975, have shown that the phytoplankton biomass in lake Kivu was more abundant in the same period than in lake Tanganyika and lake Malawi (0.12 g C/m3) HECKY et KLING, 1987). Two groups Cyanophycae and Chlorophycae represent 70 to 90% of the biomass. During the stratification period, phytoplankton in lake Kivu is similar to that of lake Tanganyika.
In the costal zone, sediment are encrusted by calcium carbonate, preventing colonisation by benthic invertebrates. Only areas close to estuaries or in shallow bays, those areas are populated by HIRUDINEA, CHIRONOMIDAE, TRICHOPTERA, EPHEMEROPTERA, HEMIPTERA, COLEOPTERA and MOLLUSCA where encrusted areas as well as rocky areas are colonized by Cladophora sp., Navicula sp., Cimbella sp., and Synodra sp., Cyanophicae are not very common (DE IONGH and SPLIETHOF, 1981).
In order to preserve the continuity of the resources of lake Kivu, responsible officials in Rwanda are aware of the necessity to control the exploitation of the Limnothrissa miodon stock. A research programme designed to procure the parameters of the species and the fishery necessary to the stock assessment and management. The programme can be divided into several activities such as biological sampling, catch assessment survey, fishing units sensus, acoustic surveys.
The research programme is presently carried out by four biologists, an FAO expert and an associated expert and two national counterparts. The sampling activities are carried out by one technician and 15 samplers around the lake.
3.1 Catch and catch per unit of effort
This part of une programme invoives several activates
Regular fishing unit surveys are done to follow the fishing effort and a frame survey named KIVUSTAT has been established to estimate real catches.
Information on catches are collected on a daily basis on several sapling points around the lake selected as being the landing site of several fishing units. Information is collected on forms as shown in ANNEX 1, they include catches by species (Limnothrissa miodon and Haplochromis sp.) and by fishing units. Information on number of buyers, and prices are also collected.
3.2 Biological parameters
The knowledge of Limnothrissa miodon biological parameters is needed for the understanding of the variations of the characteristics of the stock. Expected results are:
The sampling programme is regularly executed by technicians in the three centres of the project Gisenyi, Kibuye and Cyangugu.
3.3 Acoustic surveys and limnological environment
Acoustic surveys of the entire lake Kivu as well as measurement of a number of limnological parameters of the lake are done simultaneously from the research vessel ISAMBAZA FAO 99. Information on fish densities are collected along sampling transects. Acoustic surveys last about 5 to 7 days depending upon meteorological conditions and are repeated 4 times a year. The following results are expected:
4.1 Biological studies
Biological sampling is regularly executed in the three centres of the project and occasionally during acoustic surveys on board the ISAMBAZA FAO 99. Three times a week a sample of one kilo or half kilo of L. miodon depending upon their size is taken from a randomly selected fishing unit.
Measurements are: fork length (FL), total weight (W), sex and sexual maturity (ANNEX 2). The Nikolsky maturity scale modified by BAGENAL and TESH (1979) shown in ANNEX 3 is used for maturity stages.
4.2 Catch statistics
From the beginning of the fishery in 1979 up to 1984, catches from all fishing units were landed in project centres, landing data from that period are therefore reliable. From 1984–85 landing in project sites began to decrease partly as a result of the demand of fish around the lake and the subsequent development of outside project markets. This phenomenon was emphasized by a reduction in the catches contributing to price increase outside project centres.
Consequently an in order to obtain information on the real catches on the lake, a catch assessment survey KIVUSTAT was established in january 1990. A total of 13 landing sites around the entire lake Kivu (FIGURE 1) were selected using information on outside project markets (MUTAMBA et MULINDABIGWI, 1989). On each site, a sampling agent is supposed to collect the information on at least 5 fishing unit, if the number of units is below this value a new site corresponding to this criterium must me identified in the neighbourhood (LAMBOEUF 1990).
Information are collected daily using the form shown in ANNEX 1, data are forwarded monthly to project headquarters in Gisenyi and processed using a microcomputer and a spread sheet programme.
A daily average catch per unit of effort is calculated on the basis of the catches of the sampled fishing units, a rate of activity of the fishing units is calculated, an estimate of the total daily catch is obtained from these two parameters by raising to the total number of units operating on the lake. Daily estimated catches are summed monthly and catches from the three fishing units operating with purse seines are added.
4.3 Resources evaluation
Acoustic surveys are executed following a parallel transect sampling scheme, east-west oriented and separated by three pautical miles (FIGURE 2).
Along each of these transects, 30 minutes acoustic samples are recorded, separated by intervals of 30 minutes sailing. The density of fish recorded in these samples is valid for an area of 237,000 ha (86 % of total area of lake Kivu).
Data collection uses the following instruments (JOHANNESSON and LAMBOEUF 1989):
HADAS interface.
The echosounder was developed for specific work in fresh waters by LINDEM (1983).
The HADAS system which includes hardware and software is used to process the data. Its analytical part uses a modified version of the mathematical model developed by CRAIG and FORBES (1969). The distribution of fish echoes target strength (TS) is compensated for attenuation of those echoes that are not located in the centre of the acoustic beam. The HADAS system produces results in the form of fish densities. a distribution by fish target strength is also given which can easily be converted in length or weight using the performances of the echosounder and the length/weight relationship of the fish. Total biomass can finally be obtained in terms of number of and biomass of fish.
4.4 Fishing units sensus
Fishing units sensus are executed using the ISAMBAZA FAO 99 as a platform and a Zodiac to enter all the inlets and to go around the islands, each fishing unit in the lake is visited and questioned according to the form shown in ANNEX 4. The entire coast of the lake is sampled in about 4 to 5 days and the risk of double counting and missing some units is very low.
During the sensus, information on catches, number of buyers and market demand are also collected.
4.5 Limnology
During acoustic surveys, zooplankton samples using a 50μ mesh are collected at the end of each acoustic sample. The net is towed vertically from 80 m to the surface.
Concurrently a HYDROLAB probe SURVEYOR II is used to measure temperature, oxygen, pH and conductivity over the same water column each 10 m interval.
5.1 Catch and catch per unit of effort
5.1.1 Number of fishing units
Two types of artisanal fishing units are concerned with the fishing activity in lake Kivu, they are trimarans and catamarans. The fishery of Limnothrissa miodon in lake Kivu started with 4 fishing units of the catamaran type imported from lake Tanganyika In september october 1987 there was 46 catamarans and 118 trimarans totalling 164 fishing units in lake Kivu (HANEK et al., 1987). After the transformation in catamarans in trimarans and taking into account the creation of new fishing units the total number is now 227, all trimarans (LAMBOEUF et al., 1989; MUTAMBA et MULINDABIGWI, 1989; MULINDABIGWI et MUTAMBA, 1990).
5.1.2 Fishing technique
Fishing is done during the night by light attraction, the net is hauled every two hours and more frequently if there are good evidences of presence of fish under the lamp. A total of six hauls can be done each nights.
5.1.3 Fishing effort
Fishing effort is expresses in terms of number of fishing nights per fishing unit per fishing campaign. The average monthly fishing effort is 22 days a month in Gisenyi, 18 in Kibuye and 19 in Cyangugu (REUSSENS, 1987).
5.1.4 Estimation of the total catch
TABLEAU 1 Estimations des captures d'Isambaza et d'Haplochromis (données en tonnes)
| 1990 | Jan | Fev | Mar | Avr | Mai | Jun | Moy. | |
| ISAM BAZA | Estim. base UEP | 196,6 | 187,0 | 192,2 | 204,9 | 189,6 | 213,6 | 197,3 |
| | 63.1 | 55.1 | | 62.7 | | 29.2 | ||
| Senneurs | 20,4 | 17,8 | 20,0 | 19,3 | 16,7 | 12,6 | 17,8 | |
| Estim. Tot | 217,0 | 204,8 | 212,2 | 224,2 | 206,3 | 226,3 | 215,1 | |
| 22% | | 21% | 25% | 14% | 26% | |||
| Haplochromis | 83,0 | 112,5 | 61,3 | 91,3 | 81,1 | 126,4 | 92,6 | |
The estimation of total catches in lake Kivu is obtained on the basis of the catches of the sampled units increased by the catches of the other purse seine units operating in the entire lake. Results obtained on the basis of the liftnets artisanal units for the six first month of 1990 (LAMBOEUF 1990) show an average catch of 197 tons per month ranging from 187 in february to 213 tons in june. If one adds the catches of the purse seine units, the average monthly catch in lake Kivu is 215 tons (TABLE 1).
Landing in project centres in the same time only represent 26% of the total catch in the lake.
5.1.5 Catch per unit of effort
A study by MARSHALL (1990) on the long term variations of Limnothrissa miodon abundance was based on available catch per unit of effort data. CPUE varies considerably from one fishing unit to the other (FIGURE 3) and above average CPUE do not show a regular seasonal pattern as in lake Kariba. Highest catches are observed in 10 years out of 12 (FIGURE 4a and b). However à general trend can be identifies where there is an increase in august-september with a maximum in february-march (FIGURE 5).
5.2 Biological parameters
5.2.1 Behaviour
Limnothrissa miodon is a schooling pelagic species which appears in schools during the days and spreads out in dispersed fish during the night while feeding.
5.2.2 Growth
The growth is isometric with different phases depending upon sex and size groups. The growth is relatively rapid and characterized by an increase of more than 10 mm per month during the first six month, it then reduces to about 2 mm per month with aged individuals. L∞ (TABLE 2) varies from year to year, depending on the presence of large size individuals in the samples. K estimates indicate a relative high growth rate.
Longevity is short about two years (MANNINI et al., 1990; MANNINI, 1990)
TABLEAU 2: Paramètres de l'équation de VON BERTALANFFY
| Année | Loo en mm | K | to* |
| 1980 | 149 | 1,30 | - 0,142 |
| 1983 | 154 | 1,31 | - 0,144 |
| 1986 | 138 | 1,317 | - 0,147 |
| 1989 | 144 | 1,28 | - 0,149 |
* Utilisé seulement pour les besoins de la détermination du schéma de recrutement
Source: MANNINI, 1990
5.2.3 Mortality
Total mortality “Z” of Limnothrissa miodon in lake Kivu increases from 1980 to reach a maximum in 1986 (TABLE 3). At the beginning of the fishery i 1979 the total mortality is supposed to be equal to the natural mortality, it increases as the CPUE goes down (Figure 6). The high value for “E” obtained in 1980 corresponds to a drop in CPUE. The mortality of L. miodon in lake Kivu is high as it is in the other lake where this species is present, it affects individuals greater than 105 – 110 mm corresponding to ages of 18 to 15 month (MANNINI 1990).
TABLEAU 3: Mortalité totale annuelle obtenues avec les programmes ELEFAN et LFSA
| Z (annuel) | 1980 | 1983 | 1986 | 1989 |
| ELEFAN | 6,62 | 7,64 | 11,68 | 9,62 |
| LFSA | 6,36 | 8,05 | 11,64 | 10,43 |
| (4,91–7,81) | (7,02–9,08) | (8,46–14,82) | (7,72–13,13) |
Source: MANNINI, 1990
5.2.4 Recruitment
The recruitment pattern in 1989 appears bimodal showing two periods separated by a five month interval. It appears that the recruitment shows a main peak at the end of the main dry season from september october to december january which can be extended to march giving there a lesser importance peak (MANNINI 1990).
5.2.5 Reproduction
Maturity
Size at first maturity of Limnothrissa miodon in lake Kivu is reached at 60 mm LF with males and 63 mm with females. DE IONGH and SPLIETHOFF (1981) have also observed ripe individuals of 50 mm LF. These results are slightly different from those of ELLIS (1971) in lake Tanganyika where size at first maturity is never below 60 mm, males are mature at 64 mm and females at 75 mm (MUTAMBA and MULINDABIGWI 1990)
Reproduction period
Reproduction activity lasts all the year and not less than 65% of females are ripe and spawning at any time of the year, with regard to males this proportion is 80%. reproduction activity is reduced in february, june and october with males and in january june and november with females (MUTAMBA et MULINDABIGWI 1990).
Sex ratio
Sex ratio result obtained by MUTAMBA and MULINDABIGWI (1990) is 0,79 this differs slightly from 0,74 the value obtained by REUSSENS (1987) for years 1985 1986 and 0,74 in the littoral fringe of the lake in 1986 1987.
5.3 Resources evaluation
Acoustic survey in march 1990 (LAMBOEUF et al., 1990) has detected a total of 815 million fish representing 4600 tons. the average density is 19.4 kg/Ha or 3.4 million fish /Ha. Average weight of fish was 5.6 g ranging from 3.6 to 7.1 g. In terms of weight, 16% of the fish an 30% in terms of numbers represent fish smaller than 6 cm. Zones of high density (50% in numbers) of fish are located, have been identified in the Zaire side between Katana Kalehe and the Ijwi island. In Rwanda regions of abundance of juveniles are located in front of Gisenyi and Kibuye.
Most of the fish, that 41% of the numbers as well as weight are located between 30 and 44 m of depth (FIGURE 7 and 8).
The fishing activity in lake Kivu is a recent; it started in 1979 with the first phase of the “Projet de Développement de la Pêche au lac Kivu”.
There are presently 227 active fishing units of the trimaran type, they fish an average of 18 to 22 nights per month on the rwanda side of the lake and 20 to 23 nights on the Zaire side.
Catch assessment survey KIVUSTAT, recently introduced has shown that only 26% of the total production of the lake is being channelled through the project facilities, the rest being commercialized through outside project markets all around the lake.
Plankton bloom periods can be related to two periods of increased reproduction activity in september-january and in mars-june.
BAGENAL, T.B and TESCH, F.W., 1978 Method for assessment of fish production in fresh waters. Blackwell, Oxford, 235 p.
BEADLE, L.C., 1981 The inland waters of tropical Africa. An introduction to tropical limnology. Longman, London, 2e ed., 475 p.
COLLART, A., 1960 L'introduction du S. tanganicae (Ndagala) au lac Kivu
CRAIG. R.E and FORBES, S., 1969 A sonar for fish counting. Fisk. Dir. Skr. Ser. Havunders. 15, 210–219.
DAMAS, H., 1937 Recherches hydrobiologiques dans les lac Kivu, Edouard et Albert. Expl. Mare. Nat. Albert. Mission Damas (1935–1936), 1: 128 p.
DEGENS, E.T. et al., 1971 Lake Kivu expedition: geophysics, hydrography, sedimentology. Tech. Rep. no 71–52 Woods Hole Ocean. Inst. (Unpublished manuscript).
DEGENS, E.T. et al., 1972 Lake Kivu: structure, chemistry and biology of an East African Rift Lake. Geologisch Rundschear, no 62, 245 p.
DE IONGH, H.H and SPLIETHOFF, P.C., 1981 Artisanal fishery development at lake Kivu, Rwanda; a final report. Projet de Développement de la Pêche au lake Kivu. FAO (mimeo).
ELLIS, C.M.A., 1971 The size at maturity and breeding seasons of sardines in southern lake Tanganyika. Afr.J. Trop. Hydrobiol. Fish. 1, 59–66.
HABERYAN, K.A. and HECKY, R.E., 1987 The late pleistocene and holocene stratigraphy and paleolimnology of lakes Kivu and Tanganyika. Palaeogeography, Palaeoclimatology, Palaeoecology. 61, 169–197.
HANEK, G. et al. 1987 Aide-mémoire concernant l'enquête-cadre sur la pêche au L. miodon au lac Kivu (zaïre). Projet RWA/87/012, RWA/87/012/TRAM/06, 11 p.
HECKY, R.E. and KLING, R.E. 1987 Phytoplancton ecology of the great lakes in the rift valley of Central Africa. Arch. Hydrobiol, Beih Ergebn. Limnol. 25, 197–228.
HANEK, G. et al. 1990 La pêche de l'Isambaza (LIMNOTHRISSA MIODON) au lac Kivu. Projet RWA/87/012, 6 p.
JANNASCH, A.W., 1975 Methane oxydation in lake Kivu. L. miodon Ocean. 20: 860–864.
JOHANNESSON, K. et LAMBOEUF, 1989 M. Estimation acoustique de l'abondance du stock d'Isambaza (Limnothrissa miodon) du lac Kivu, par une méthode basée sur le comptage des échos de poisson. RWA/87/012/DOC/TR/13 (Fr), 64 p.,
KILHAM, S.S., (s/presse) Tropical limnology: Do Afran lakes violate the “first lax” of limnology? Verh. Int. Vercin. Limnolo., 24
KISS, R., 1959 Analyse quantitative du zooplancton du lac Kivu Folia Sci. Centralis, 4, 78–80.
LAMBOEUF, M., DIQUELOU, J., MUTAMBA, A. et KABEMBA, M., 1989 Recensement des unites de pêche au lac Kivu Projet RWA/87/012. RWA/87/012/TRAM/54, 6 p.
LAMBOEUF, M., 1990 Estimation des captures de Limnothrissa miodon au lac Kivu. Résultats de l'enquête KIVUSTAT de janvier à juin 1990. Projet RWA/87/012. RWA/87/012/TRAM/119, 13 p.
MANNINI, P., 1990 Parametres de la population de Limnothrissa miodon du lac Kivu (1980–1989). Projet RWA/87/012. RWA/87/012/DOC/TR/32 (Fr), 41 p.
MARSHALL, B.E., 1990 Variations saisonnières et annuelles de l'abondance du Limnothrissa miodon du lac Kivu. Projet RWA/87/012. RWA/87/012/DOC/TR/29 (Fr).
MULINDABIGWI, A. et MUTAMBA, A., 1990 Recensement des unités de pêche du lac Kivu RWA/87/012/TRM/125.
MUTAMBA, A., 1987 Contribution à l'étude des populations littorales de L. miodon au lac Kivu (RWANDA). Paramètres biologiques et cannibalisme. Mem. Univ. Nat. Rwanda, 111 p.
MUTAMBA, A. et MULINDABIGWI, A., 1989 Aide-mémoire concernant le recensement des unités de pêche au lac Kivu. Projet RWA/87/012. RWA/87/012/TRAM/73, 10 p.
MUTAMBA, A. et MULINDABIGWI, A., 1990 Aide-mémoire concernant la maturité sexuelle du Limnothrissa miodon du lac Kivu en 1989. Projet RWA/87/012, 14 p. RWA/87/012/TRAM/90, 14 p.
PEETERS, L., 1957 Contribution à l'étude de la génèse du lac Kivu Bull. Soc. Belg. Etudes geographiques 26, 155–168.
PEETERS, L., 1959 Traints spéciaux de la géomorphologie et de la génèse du bassin du lac Kivu. Bull. Soc. Belg. Etudes géographiques 83, 66–75.
REUSENS, M., 1987 Programme de recherche halieutique au lac Kivu en particulier sur le L. miodon. Gisenyi Projet RWA/87/012. RWA/87/012/DOC/TR/03, 115 p.
SPLIETHOFF, P.C., 1981 et DE IONGH, H.H. Résumé d'un programme d'échantillonnage biologique et limnologique dans le lac Kivu, janvier-décembre 1980. Projet RWA/77/010, p. 45 p.
VAN DER BEN, D., 1959 Exploration hydrobiologique des lacs Kivu. Edouard et Albert. Inst. Royal Sci. Nat. de Belgique.
VAN MEEL, L., 1954 Le Phytoplancton. Explor. Hydrobiol. lac Tanganyika (1946–1947). Ann. Sc. Roy. Zool, Belg. 4 1–681.
VERBEKE, J., 1957 Recherches écologiques sur la faune des grands lacs de l'Est Congo Belge. Explor. Hydrobiol. lac Kivu, Edouard et Albert (1952–1954). Inst. Roy. Sci. Nat. Belg., B 3 (1), 177 p.
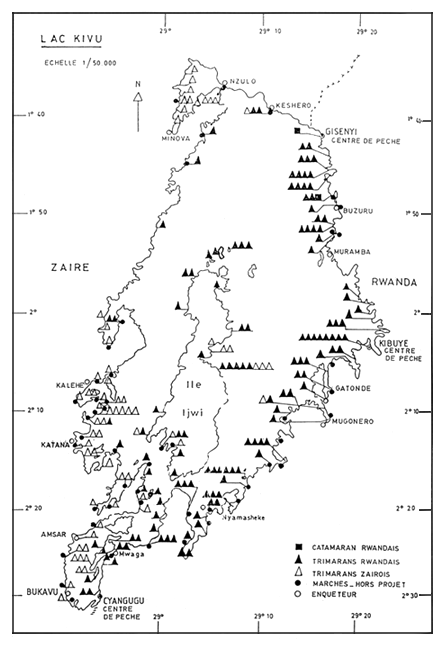
FIGURE 1: Répartition des unités de pêche sur le lac Kivu et localisation des enquêteurs ainsi que des marchés hors-projet.
SOURCE: MUTAMBA et MULINDABIGWI, 1990
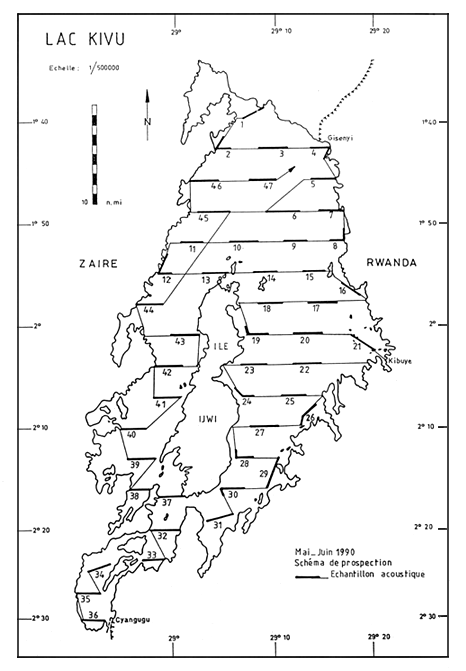
FIGURE Schéma de prospection et repérage des échantillons acoustiques en Mai-Juin 1990

FIGURE 3: CPUE moyenne à (a) Gisenyi, (b) Kibuye et (c) Cyangugu, 1981–1989. Les lignes horizontales indiquent la CPUE annuelle moyenne dans chaque localite, la zone ombree correspond aux périodes où la CPUE était au dessus de la moyenne annuelle. Les données ont été lissées en utilisant une moyenne dynamique sur deux mois.
SOURCE: MARSHALL, 1990
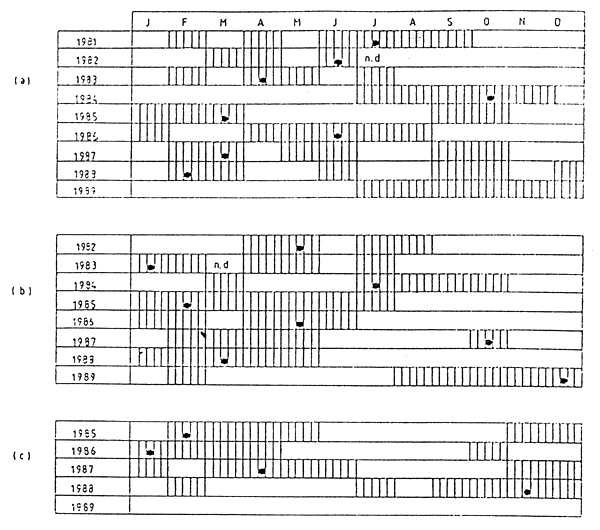
FIGURE 4 A: Schéma de variation saisonniere de la CPUE moyenne à (a) Gisenyi, (b) Kibuye et (c) Cyangugu. les hachures indiquent les mois pendant lesquels la CPUE est supérieure à la moyenne annuelle, le symbole “•” indique le mois où la CPUE est maximum, “n.d.” indique une insuffisance de données.
SOURCE: MARSHALL, 1990
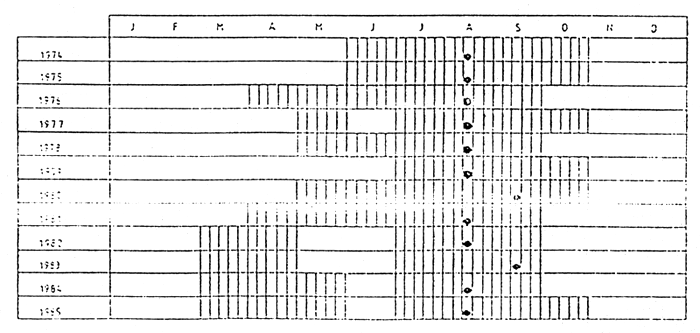
FIGURE 4B: Schema de variation saisonnière de la CPUE au lac Kariba. Les symboles sont les mêmes que ceux de la figure 11. Reproduit de MARSHALL (1988a).
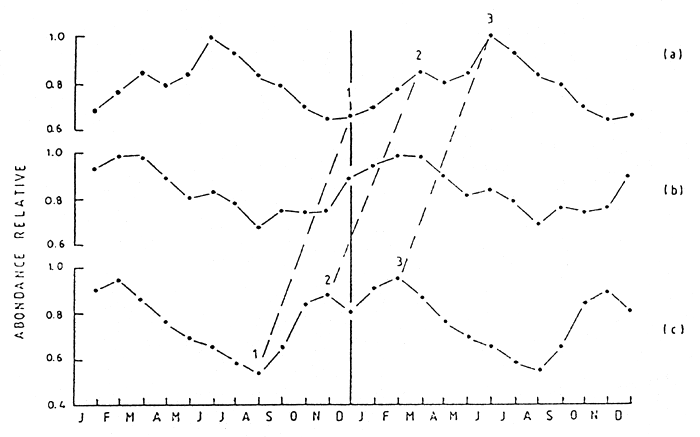
FIGURE: 5 Captures mensuelles moyennes pour toutes les années disponibles à (a) Gisenyi, (b) Kibuye et (c) Cyangugu. Les données sont exprimées sous forme de proportion de la plus forte capture (à laquelle on a attribué la valeur 1) et lissées sur deux mois. La méme année a été répétée pour bien mettre en evidence le pic à Cyangugu atteint de septembre à mars. les chiffres indiquent (1) les captures les plus basses (2 et 3) les pics à Cyangugu et Gisenyi. SOURCE: MARSHALL, 1990
Fig. 6: CPUE & Mortalite Totale (Z)
1980 – 1989
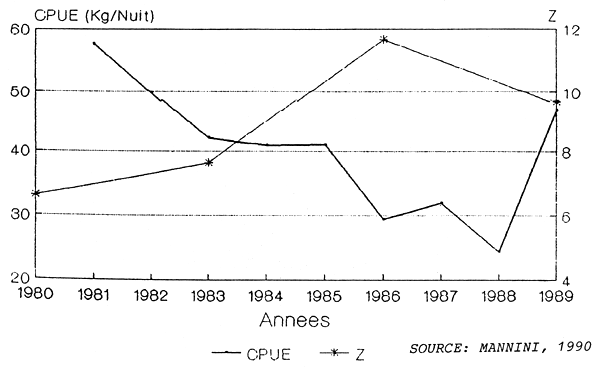
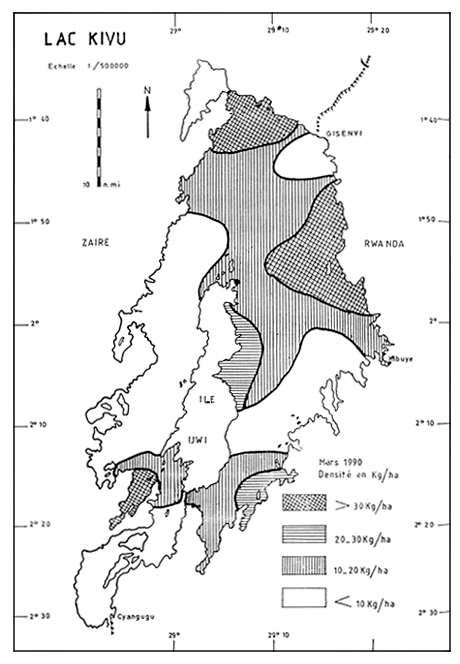
FIGURE 7: Répartition de la densité de Limnothrisa miodon en Kg/ha en mars 1990.
SOURCE: LAMBOEUF et al. 1989
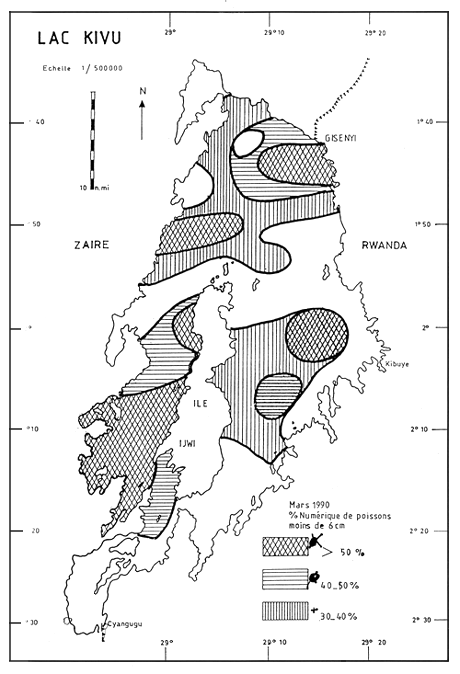
FIGURE 8: Répartition du nombre de Limnothrissa miodon de mois de 6 cm, en mars 1990
SOURCE: LAMBOEUE et al 1989
ANNEXE 1: ENQUETE D'ESTIMATION DES CAPTURES D'ISAMBAZA/LUMPU DU LAC KIVU
| Lieu de débarquement: ................................................................... | Enquêteur: ........................................................................... |
| ..................................................................................................... | Mois/campagne: ................................................................... |
| Jour | Nombre total UEP | Nombre UEP actives | Débarquement | Nombre d' acheteurs | Quantité achetée | Prix moyen | Observations | |
| Iszamb lumpu | haploo ndugu | |||||||
ANNEXE 2
PROJET DE DEVELOPMENT
DE LA PDCHE AU LAC KIVU
CCP/RWA/008/NET
Données biologioues do Limnothrissa miodon
| Date: | Provenance de l'échantillon: |
| Zone: | Lieu de pêche: |
| Poids de l'échantillon: |
REMARQUES
| No | LF (mm) | PT(gr) | Sexe | Maturité | PC (mgr) | AD | CS | F | Autres Observation |
ANNEXE 3: ECHELLE DE MATURITE DES GONADES BASEE SUR LA CLASSIFICATION DE NIKOLSKY 1963 (BAGENAL ET TESCH, 1978)
| Stade | Etat | Description |
| I | Immature | Les gonades sont de plus petite dimension et accolées à la colonne vertébrale S'il y a coloration, elle est légérement grise chez la femelle, blanchâtre chez le mâle. |
| II | Développement | Les testicules et les ovaires sont translucides et d'une coloration gris-rougeâtre les gonades sont transparentes chez la femelle, opaques chez le mâle. Elles occupent au moins la moitié de la cavité abdominale. Les produits sexuels sont peu développés et l'on peut déjà distinguer les oeufs au binoculaire. |
| III | Maturation | Augmentation du volume et en même temps du poids des gonades. Les testicules et les ovaires sont rose-rougeatres avec une série de petits capillaires sanguins. Les gonades occupent plus de la moitié de la cavité abdominale. Les oeufs sont discernables à l'oeil nu, donnant une apparence granuleuse blanchâtre. |
| IV | Maturité | Les produits sexuels sont tout à fait mûrs, mais on ne peut pas les expulser à la pression des doigts sur l'abdomen. Les ovaires sont totalement différenciés et plus ou moins jaunâtres, les oeufs sont bien formés et ronds. Les testicules sont blancs. Les gonades ont une paroi tendue et occupent ⅔ de la-cavité abdominale. |
| V | Reproduction | Les oeufs des femelles et la laitance des mâles sortent sous la pression des doigts sur la cavité abdominale. Les gonades occupent toute la cavité abdominale. Les ovaires sont jaune-oranges avec des capillaires sanguins superficiels. Les oeufs sont très grands. Les testicules sont blanchâtres. |
| VI | Epuisement | Les produits sexuels ont été déchargés, mais il reste quelques résidus de spermatozoïdes dans les testicules et quelques oeufs dans les ovaires. Les gonades occupent la moitié de la cavité abdominale et leur paroi est devenue flasque et injectée de sang. |
ANNEXE 4: RECENSEMENT DE UNITES DE PECHE DU LAC KIVU
| LOCALISATION | UEP | PRODUCTION | MARCHES | OBSERVATIONS | ||||||||||||
| No | Commune Zone | Secteur Localité | Cellule Village | Zaïre Rwanda | Catm Trim | Numéro Pr/ass | Ahier | Hier | ce jour | Détailants | Grossistes | Total | ||||
| Nb | Kg | Nb | Kg | Nb | Kg | |||||||||||