 June 2009 June 2009 | ||
 |
Food Outlook | |
| Global Market Analysis | ||
|
MARKET SUMMARIES
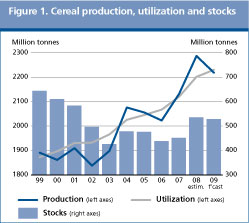
While world cereal production is heading towards a modest decline in 2009, it will still be the second highest after last year’s record. Total cereal utilization will expand in the new season (2009/10), albeit at a slower rate than in 2008/09. Feed utilization is expected to be most hit by the current economic slow down, and register only a modest increase, but growth in industrial use of cereals may also lose steam in the new season. Food cereal consumption is expected to keep up with population growth, at the global and even national levels in most countries. Overall, the anticipated decline in world cereal production is likely to be offset by a draw down from stocks carried-over from the current season, and as such, supply is foreseen to be sufficient to meet the expected demand. However, in the current economic environment, there is much uncertainty, especially with regard to its effects on demand. In addition, given the close linkages between cereal markets and other agricultural commodities as well as energy markets, extra caution is needed in interpreting the current supply and demand forecasts and price developments during the new season. World cereal market at a glance 1
* Jan-May 2009
1/ Rice in milled equivalent
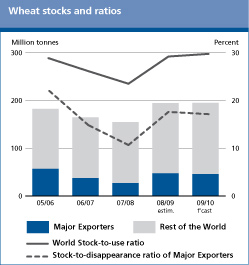
International wheat prices increased considerably in recent weeks. While a weakening United States Dollar has been a factor, changes in outside markets, including the recent recovery in oil prices and sharp gains in many other agricultural commodity markets, have also been supportive to wheat. In this context, the possibility for international wheat prices to strengthen further cannot be ruled out but, based on the current supply and demand indications, such a gain would be limited. Indications suggest that 2009 will witness another large global wheat harvest, second only to last year’s record, which is a positive development from the world supply and global food security perspectives. In fact, stocks in the new season are likely to remain unchanged from their opening level with world production closely matching demand. While the global economic slow down may have little direct implications for wheat consumption, international trade in wheat is expected to contract significantly. This decline would primarily reflect the expected increase in production in several wheat importing countries which could lessen their imports. World wheat market at a glance
* Derived from International Grains Council (IGC) Wheat Index
** Jan-May 2009
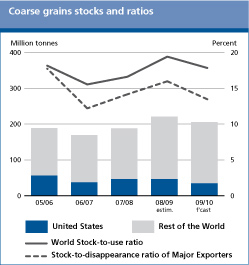
International prices rose sharply in recent weeks, supported by production shortfalls in South America and outside factors, in particular the surge in soybeans and renewed strength in crude oil prices. Tightening export supplies of coarse grains and reduced feed wheat availability are likely to sustain prices in the new season, but markets remain vulnerable to unfavourable macroeconomic developments and factors influencing demand negatively. The global economic downturn is expected to depress feed demand while the growth in the industrial use of coarse grains for biofuels may also be less pronounced than in the previous two or three seasons. The forecast drop in production in 2009, coupled with an anticipated increase in utilization, albeit much smaller than in recent years, is expected to result in a decline in inventories. World trade in 2009/10 is forecast to change little compared with 2008/09, remaining well below the record in 2007/08. World coarse grain market at a glance
* Jan-May 2009
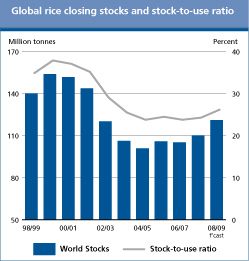
International rice prices have followed contrasting movements since November 2008, with the widely traded Indica rice varieties incurring steep falls, while Japonica rice prices continued to be supported by prospects of tight supplies. In general, rice prices have yet to fall back to 2007 levels, despite relatively large market availabilities arising from bumper crops in 2008. Much of the price rigidity reflects policies of major exporting countries, either in the form of producer price support or export curbs, which are reducing the volumes of rice flowing to world markets. International trade in rice may recover somewhat in 2009, as less prohibitive prices are expected to stimulate imports, especially in Asia, Europe, North America and South America. The increase would also be facilitated by a continuing easing of export restrictions. The bumper crops harvested in 2008 and favourable production prospects in 2009 are expected to allow for an increase in overall rice consumption in 2009, but also for a build up of 2009 global rice inventories, which may reach their highest level since 2002. World rice market at a glance
1 Calendar year exports (second year shown)
2 Major exporters include India, Pakistan, Thailand, the United States of America and Viet Nam
More detailed information on the rice market is available in the FAO Rice Market Monitor which can be accessed at: http://www.fao.org/es/esc/en/15/70/highlight_71.html
* Jan-May 2009
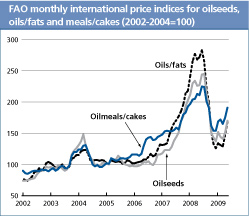
Over the last two months, international prices in the oilseeds complex have firmed again, reflecting concerns about a progressive tightening of global 2008/09 supplies, in particular of soybeans and derived products, following unprecedented crop shortfalls in South America and sustained import demand, in particular from China and India. The production shortfalls have led to a reduction in export availabilities, causing additional strain on inventories and increasing the dependence of the market on a limited number of suppliers. These circumstances suggest that world prices for oilseeds and products could remain firm and possibly strengthen further during the remainder of the current season. The current market tightness and price firmness could also spread into the next season, considering that, irrespective of a likely revival in global oilseed production, 2009/10 supplies of oils and meals will be conditioned by low carry-in stocks. World oilseeds and products markets at a glance
Source: FAO
Note: Refer to Table 8 for further explanations regarding definitions and coverage
*Jan-May 2009
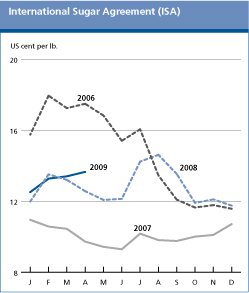
Since November 2008 world sugar prices have risen steadily, reaching a three-year high in May 2009. The price strength was prompted by the prospects of a much reduced crop in India, the world’s second largest sugar producer, which is likely to convert the country from a net exporter in 2007/08 to a net importer in 2008/09. World sugar production is forecast to decline by 5 percent in 2008/09 from the record 2007/08 level, in part driven by the contraction in India but also in Australia, the European Union, Pakistan and the United States. By contrast, world sugar consumption is set to expand, albeit at a slower rate than in the past two years, propelled by sustained demand in the developing countries. As a result, consumption is expected to outstrip production for the first time since 2005/06, bringing global carry-over inventories down. Larger sugar exports are foreseen from Brazil, as high world sugar prices relative to the domestic ethanol prices, encourage the country to shift more supplies to the international sugar market. These exports should help boost the volume of sugar trade by 6 percent in 2008/09. International quotations are expected to remain firm, at least for 2008/09, sustained by prospects of large imports by India.
World production and consumption of sugar
* Jan-May 2009
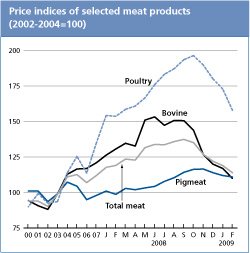
International meat prices have dropped steadily since reaching peak levels in October 2008, but have not yet returned to the levels observed in the first months in 2007. The decline in prices was most pronounced for bovine, ovine and poultry meat, while pig meat prices remained relatively stable. The fall of meat prices largely reflects the weakening of demand, as a worsening of the global economic environment and the recurrence of animal diseases are dampening consumption growth, especially in the developed countries. Global meat production in 2009 is set to reach 286 million tonnes, in carcass weight equivalent (CWE), up 1.2 percent from 2008. This represents a downward revision from previous estimates, due to protracted dry conditions in South America, signs of a slowing down of poultry production growth in Brazil and China, and the recurrence of animal diseases. Pigmeat is expected to account for much of the increase, with some gains also anticipated for poultry. Little growth in bovine and ovine meat production is currently anticipated. World meat trade is expected to contract by 4 to 5 percent in 2009, with exports set to hover around 23.4 million tonnes. The drop is anticipated to result mainly from reduced shipments of pig and poultry meat, while little change is now foreseen for beef and sheep meat. World meat markets at a glance
* Jan-May 2009
Demand weakness stemming from the financial crisis and economic recession that started in late 2008, particularly in certain major importing countries such as the Russian Federation, has accentuated the 2008 cyclical downturn in international dairy markets. International prices have dropped to a five-year low. There has been a resumption of export subsidies and, in key exporting countries, stocks are rising. As a result, production is growing more slowly in most countries and even declining in certain major exporting states where lower prices and relatively high feed costs have lowered profitability. Global milk production has been revised down to 699 million tonnes in 2009, which is still 1.7 percent above last year. Prospects for trade in dairy products remain highly uncertain and will depend on how import demand evolves. World dairy market at a glance
* Jan-May 2009
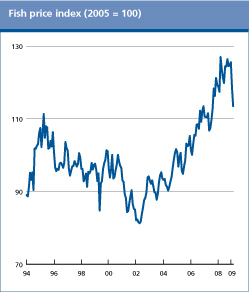
World production of fish products rose modestly in 2008, owing to an expansion in aquaculture, albeit much slower than in previous years, while capture fisheries remained stable. Production prospects for 2009 are more subdued with growth foreseen to be less than 1 percent, as falling prices for a number of the most important traded farmed species and disease problems are prompting a contraction of the sector in several countries. Although trade in fish reached a record value in 2008, surpassing USD 100 billion for the first time, the outlook for 2009 is dominated by overriding concerns over the impacts of the economic crisis on demand and prices. Sales are sluggish in all major markets and prices and margins are under pressure for most seafood products. The only exception is for species facing tight supply situations, due to lower catching quotas or production problems in aquaculture. In this respect, the implosion of the Chilean salmon industry in 2009, following a virus attack, is a warning sign for many countries targeting high growth in the aquaculture sector. World fish market at a glance
|
||||||||||||||||||||||||||||||||||||||||||||||||||||||||||||||||||||||||||||||||||||||||||||||||||||||||||||||||||||||||||||||||||||||||||||||||||||||||||||||||||||||||||||||||||||||||||||||||||||||||||||||||||||||||||||||||||||||||||||||||||||||||||||||||||||||||||||||||||||||||||||||||||||||||||||||||||||||||||||||||||||||||||||||||||||||||||||||||||||||||||||||||||||||||||||||||||||||||||||||||||||||||||||||||||||||||||||||||||||||||||||||||||||||||||||||||||||||||||||||||||||||||||||||||||||||||||||||||||||||||||||||||||||||||||||||||||||||||||||||||||||||||||||||||||||||||||||||||||||||||||||||||||||||||||||||||||||||||||||||||||||||||||||||||||||||||||||||||||||||||||||||||||||||||||||||||||||||||||||||||||||||||||||||||||||||||||||||||||||||||||||||||||||||||||||||||||||||||||||||||||||||||||||||||||||||||||||||||||||||||||||||||||||||||||||||||||||||||||||||||||||||||||||||||||||||||||||||||||||||||||||||||||||||||||||||||||||||||||||||||||||||||||||||||||||||||||||||||||||||
| GIEWS | global information and early warning system on food and agriculture |