![]()
![]()
![]()
G.D.M. d'ITEREN K. AWUOME, K. BOKOVI, S. CHEMA, C. COLARDELLE, L. COULIBALY, A. DEFLY, A. FERON, G. GRUNDLER, M. HANDLOS, P. HECKER, P. ITTY, O. KAKIESE, S.G.A. LEAK, J.H.H. MAEHL, S.H. MALOO, K. MAWUENA, M. MINENGU, C. MORKRAMER, F. MUKENDI, W. MULATU, M. MULUNGO, S.M. NAGDA, G. NANKODABA, S. NGAMUNA, G. ORDNER, R. W. PALING, M. PELO, J.M. RARIEYA, A. SCHUETTERLE, M. SHERIA, W. THORPE, G. TIKUBET, J.C.M. TRAIL and G. YANGARI
Introduction
Materials and methods
Results
Discussion and conclusion
References
Livestock exposed to trypanosomiasis risk differ in their responses depending on genetic factors such as species, breeds and even individual characters and on many environmental factors including trypanosome and tsetse characters all contributing to the epidemiology of the disease.
The factors affecting susceptibility to trypanosomiasis must be well understood if effective measures to control the disease are to be developed.
In 1986 (ILCA, 1986b) indications were given on the different factors affecting trypanosome infection rates and parasitaemia. The present paper updates and consolidates the results based on records from ten sites.
Data collection at Network sites includes the simultaneous collection of matching information on animal health and production. Sequential monthly blood samples are examined by the dark ground/phase contrast buffy coat method to detect the presence of trypanosomes. The species of trypanosome, T. congolense, T. vivax or T. brucei is recorded and the intensity of the infection quantified as a parasitaemia score, 1 (low) to 6 (high). The protocols and methodologies have been described in detail by Murray et al. (1983). A comprehensive description of the projects that contributed to the results in this paper has been given by ILCA (1986a).
The results reported include the influence of location, season, livestock species, breed, animal age and sex, and female physiological status on the prevalence, species and intensity of trypanosome parasitaemia estimated from data collected at ten sites in six countries of West, Central and East Africa. The duration of trypanosome infections and the pattern of parasitaemia are also considered. The period of study was generally January 1984 to December 1986.
Trypanosome prevalence
The percentage of animals in which trypanosomes were detected at the monthly recording is the estimate of trypanosome prevalence.
The variation between mean monthly trypanosome prevalence of continuously recorded livestock populations at different Network sites and between herds/flocks within the sites illustrates the influence of location on the level of trypanosome infection (Tables 1 and 2).
The results refer to trypanotolerant livestock, except for the populations in Boundiali and Tengrela which included trypanotolerant x susceptible or susceptible cattle (29 and 76%, respectively) and sheep (6 and 28%, respectively) and for the populations in Ghibe and Muhaka, which were East African Zebu cattle.
Table 1. Mean monthly trypanosome prevalence (%) of cattle at Network sites, January 1984 to December 1986.
|
Site |
No. of animal-months |
Mean |
s.e. |
Range of herd means |
|
Boundiali |
9,294 |
13.9 |
2.16 |
10.4-22.7 |
|
Mushiea |
8,467 |
10.1 |
1.95 |
5.5-15.7 |
|
Avetonou villages |
6,893 |
7.3 |
1.88 |
0.6-14.9 |
|
Avetonou CREAT |
7,141 |
4.7 |
1.44 |
- |
|
OGAPROVb |
2,452 |
4.6 |
0.41 |
3.8-5.5 |
|
Idiofac |
12,727 |
2.9 |
0.64 |
0.0-8.3 |
|
Tengrela |
4,979 |
1.4 |
0.99 |
0.5-2.1 |
|
Koloa |
9,859 |
0.1 |
0.22 |
0.0-0.5 |
|
Ghibed |
11,032 |
19.6 |
1.70 |
11.1-32.2 |
|
Muhakae |
5,536 |
4.5 |
1.36 |
1.2-9.1 |
a Cows only.
b December 1983-June 1986.
c February 1986 to July 1987.
d January 1986 to June 1987.
e April 1984 to March 1986.
Even if the site can be characterized by the prevalence within its livestock population, there is still a wide range of variation between herds reflecting different exposure to the risk.
Table 2. Mean monthly trypanosome prevalence (%) of sheep and goats at Network sites, January 1984 to December 1986.
|
Site |
Species |
No. of animal months |
Mean |
s.e. |
Range of flock means |
|
Sokode |
Sheep |
2345 |
10.0 |
3.70 |
6.2-11.8 |
|
Goata |
742 |
5.6 |
4.04 |
0.7-9.8 |
|
|
Boundiali |
Sheep |
6586 |
9.2 |
2.17 |
0.1-17.7 |
|
Avetonou |
Sheep |
4402 |
3.0 |
1.62 |
0.4-8.8 |
|
Tengrela |
Sheep |
8094 |
1.7 |
0.86 |
0.1-3.5 |
a January 1984 to August 1985.
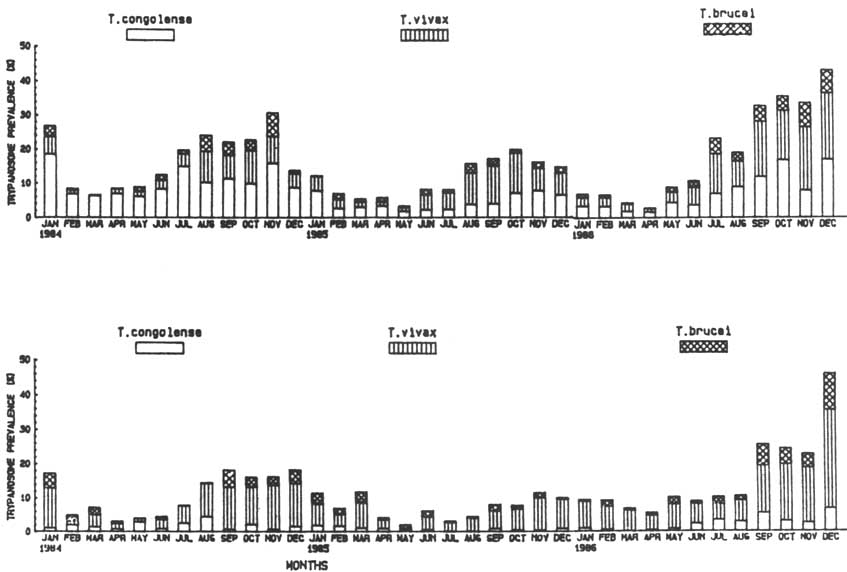
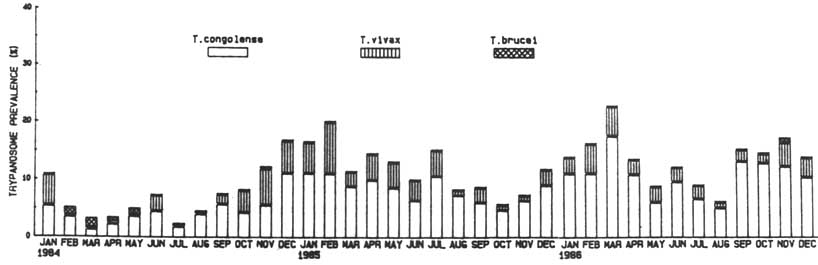
Seasonal variation in trypanosome prevalence was only important in Boundiali and in Mushie, the sites with the highest mean prevalences. Prevalence for cattle and sheep in Boundiali was two to four times lower in February to June than in July to January (Figure 1). June to September are the months with highest rainfall and December to April are the months with least rainfall. Seasonal variations of trypanosome prevalence in N'Dama cows in Mushie were not related to rainfall (Figure 2).
At three Network sites some trypanotolerant cattle herds and trypanotolerant sheep flocks were maintained together. Cattle had higher mean trypanosome prevalences than sheep (Table 3). The difference was greatest in Avetonou where T. vivax causes about 90% of parasitaemia in cattle and about 95% in sheep. Djallonke sheep and Dwarf West African goats maintained together in Sokode had very similar mean trypanosome prevalences, 7.5 and 7.0%, respectively.
Table 3. Mean trypanosome prevalence (%) of trypanotolerant village cattle and sheep maintained in the same area.
|
Site |
Cattle |
Sheep |
Ratio: Cattle/Sheep |
|
Boundiali |
12.4 |
9.9 |
1.3 |
|
Avetonou |
7.2 |
2.4 |
3.0 |
|
Tengrela |
3.7 |
2.2 |
1.7 |
The only major differences in trypanosome prevalence between breeds were shown at OGAPROV, where the prevalence in the susceptible Nguni breed was three times that of the N'Dama with their crosses having an intermediate value (Table 4). There were no differences between the trypanosome prevalences of the trypanotolerant breeds, N'Dama and Baoule, in the Cote d'Ivoire sites, nor between N'Dama and Race Locale in Togo (Table 4). Crosses between N'Dama, Baoule and Zebu had slightly higher trypanosome prevalence than N'Dama and Baoule in Boundiali, but not when at lower trypanosomiasis risk in Tengrela.
Figure 1. Monthly trypanosome prevalence for cattle and sheep in Boundiali by trypanosome species.
Figure 2. Monthly trypanosome prevalence for cattle in Mushie by trypanosome species.
Table 4. Mean monthly trypanosome prevalence (%) in different breeds of cattle.
|
Site |
Breed |
Number of animal-months |
Trypanosome prevalence |
|
OGAPROV |
N'Dama |
2976 |
8.8 |
|
N'Dama x Nguni |
1284 |
16.5 |
|
|
Nguni |
492 |
25.9 |
|
|
Boundiali |
N'Dama |
1589 |
13.1 |
|
Baoule |
5027 |
12.9 |
|
|
Crossesa |
2529 |
15.2 |
|
|
Tengrela |
N'Dama |
599 |
1.7 |
|
Baoule |
603 |
0.8 |
|
|
Crossesa |
3697 |
1.4 |
|
|
Avetonou ranch |
N'Dama |
3233 |
5.0 |
|
Race Locale |
3895 |
4.9 |
|
|
Avetonou village |
N'Dama |
2901 |
6.9 |
|
Race Locale |
3992 |
7.2 |
a Crosses between N'Dama, Baoule and Zebu.
Djallonke sheep and their crosses with the Sahelian breed could be compared in Tengrela. Their mean trypanosome prevalences were 1.7 and 1.8%, respectively.
Where cattle of different ages were exposed to the same trypanosomiasis risk, the mean trypanosome prevalence of the age classes were generally similar (Table 5). Only in the village herds of Avetonou did trypanosome prevalence decrease with age. Age effects in cattle managed in village herds were very often confounded by management practices.
For sheep the results presented in Table 6 show that trypanosome prevalence increased with animal age.
At most sites, female physiological-status classes of cattle had similar mean trypanotolerance prevalence. However at Mushie and Boundiali, the two Network sites with the highest mean trypanosome prevalences in trypanotolerant populations, non-gestating cows had a mean prevalence of 13 to 16% and only 7% when gestating (Table 7). Lactating cows, whether gestating or non-gestating, had marginally lower mean prevalences than non-lactating cows at both sites. There was no apparent confounding effect of physiological status with calving seasons which might have explained lower trypanosome prevalences in gestating cows (Figure 1). This indicates the need for further investigation to identify the possible effects of trypanosome infections on reproduction (Thorpe et al., see article 21 of these Proceedings)
Table 5. Mean monthly trypanosome prevalence (%) of three age classes of cattle at Network sites.
|
Site |
0-8 months |
9-36 months |
>36 monthsa |
|
Mean |
Mean |
Mean |
|
|
Avetonou villagea |
11.2 |
7.7 |
5.5 |
|
OGAPROVb |
9.3 |
- |
8.3 |
|
Mushieb |
8.3 |
- |
10.1 |
|
Avetonou ranchb |
4.1 |
- |
2.3 |
|
Idiofab |
3.1 |
3.4 |
2.4 |
|
Boundialic |
12.1 |
15.0 |
12.9 |
|
Ghibec |
7.0 |
15.4 |
19.5 |
|
Tengrelac |
1.5 |
1.1 |
1.3 |
b Breeding cows in OGAPROV and Mushie.
b Age class not exposed permanently to same trypanosomiasis risk.
c Calves not permanently with their respective dams.
Table 6. Mean monthly trypanosome prevalence (%) of three age classes of sheep at Network sites.
|
Site |
0-4 months |
5-12 months |
>36 months, female |
|
Mean |
Mean |
Mean |
|
|
Boundiali |
2.3 |
5.4 |
12.4 |
|
Avetonou |
1.2 |
1.4 |
4.0 |
|
Sokode |
0.7 |
6.1 |
6.7 |
|
Tengrela |
0.3 |
0.9 |
2.4 |
Table 7. Mean monthly trypanosome prevalence (%) of female physiological-status classes in cattle at two Network sites, January 1984 to December 1986.
|
Gestatinga |
Lactatingb |
Mushie |
Boundiali |
||
|
No. |
Mean |
No. |
Mean |
||
|
+ |
+ |
1286 |
6.8 |
298 |
6.4 |
|
+ |
- |
2928 |
7.5 |
1170 |
8.0 |
|
- |
+ |
2672 |
12.8 |
1049 |
14.2 |
|
- |
- |
1548 |
13.1 |
1287 |
17.7 |
a 0-9 months pre-partum.
b 0-8 months post-partum.
As with the cattle population in Boundiali, ewes had a lower trypanosome prevalence when gestating than when they were not gestating. At the other Network sites with sheep the results were inconsistent (Table 8).
Table 8. Mean trypanosome prevalence (%) of female physiological-status classes in sheep, Boundiali.
|
Gestating |
Lactating |
Boundiali |
|
|
No. |
Mean |
||
|
+ |
+ |
400 |
10.5 |
|
+ |
- |
1280 |
10.4 |
|
- |
+ |
970 |
14.6 |
|
- |
- |
1048 |
13.6 |
Species of trypanosome parasitaemia
At all Network sites with cattle, at least 75%, and generally more than 90%, of the trypanosome parasitaemias were infections by a single species, but there were marked differences between sites as regards the major trypanosome species. At one extreme, 89% of parasitaemic months in Avetonou resulted from T. vivax infection, while in Idiofa over 90% were T. congolense infections (Table 9). Boundiali was an intermediate site in that 46% of parasitaemic months resulted from T. congolense infection, but extreme in that over 20% of parasitaemic months were mixed infections of 2 or 3 trypanosome species (Table 9). At the three sites with sheep, T. vivax was the major species contributing 70% or more of the parasitaemic months.
Table 9. Species and type of trypanosome parasitaemia at selected Network sites.
|
Species and type of infection |
Percentage of total |
||
|
Avetonou |
Boundiali |
Idiofa |
|
|
T. congolense |
9. 5 |
46.4 |
92.3 |
|
T. vivax |
88.9 |
29.5 |
4.8 |
|
T. brucei |
1. 5 |
3.0 |
2.1 |
|
T. congolense and T. vivax |
0.1 |
6.8 |
0.5 |
|
T. congolense and T. brucei |
- |
0.2 |
- |
|
T. vivax and T. brucei |
- |
12. 5 |
- |
|
T. congolense, T. vivax and T. brucei |
- |
1.5 |
0.3 |
|
Total number of parasitaemic months |
870 |
1252 |
378 |
Within sites, location did not greatly affect the proportion of parasitaemias resulting from a particular trypanosome species, but in Boundiali and Tengrela there were some herds and flocks with atypical infection types.
Year and season at all sites except Boundiali, Tengrela and Mushie did not affect the species of trypanosome parasitaemia. Figure 1 shows the large variation between years of the proportion of parasitaemia resulting from T. congolense, T. vivax and T. brucei in Boundiali. In 1984 T. congolense was twice as frequent as T. vivax, whereas in 1985 and 1986 T. vivax was more frequent than T. congolense. The change was more marked in Tengrela and was shown by sheep as well as by cattle.
In Mushie the proportion of T. congolense parasitaemia in N'Dama cows increased over the three years, 1984, 1985 and 1986, such that the ratio of T. vivax to T. congolense parasitaemia dropped from 0.50 to 0.40 to 0.26 (Figure 2).
Livestock species also had a marked effect on the species of trypanosome. The scale of the effect was dependent upon animal age. Table 10 presents the proportion of total parasitaemia caused by T. vivax in pre-weaner cattle (0-8 months) and sheep (0-4 months) and in adult female cattle (>36 months) and sheep (>12 months) at three Network sites. Sheep consistently had a higher proportion of T. vivax parasitaemia than cattle and the difference was greater in adult animals. The lower proportion of T. vivax parasitaemia in older cattle was confirmed at the Network sites where only cattle are recorded (Table 11). Only in Idiofa, where the number of T. vivax parasitaemias was small, was the effect not apparent.
Table 10. Proportion of parasitaemias caused by T. vivax in two age classes of cattle and sheep.
|
Age class |
Avetonou |
Boundiali |
Tengrela |
|||
|
Sheep |
Cattle |
Sheep |
Cattle |
Sheep |
Cattle |
|
|
Pre-weaner |
1.00 |
0.97 |
0.77 |
0.70 |
0.60 |
0.57 |
|
Adult |
0.97 |
0.79 |
0.84 |
0.31 |
0.85 |
0.50 |
Table 11. Proportion of parasitaemia caused by T. vivax in three age classes of cattle.
|
|
Pre-weaners |
Post-weaners |
Adult females |
|
Avetonou |
0.97 |
0.85 |
0.79 |
|
Boundiali |
0.70 |
0.61 |
0.31 |
|
Tengrela |
0.57 |
0.60 |
0.50 |
|
Mushie |
0.57 |
- |
0.26 |
|
OGAPROV |
0.53 |
- |
0.24 |
|
Ghibe |
0.25 |
0.13 |
0.16 |
|
Idiofa |
0.03 |
0.07 |
0.06 |
Possible breed differences for susceptibility to specific trypanosomes could be examined for cattle in Avetonou and Boundiali. No comparison was possible for sheep. N'Dama and Race Locale cattle, whether managed in the ranch or in the village herds at Avetonou had similar proportions of T. vivax and T. congolense parasitaemias. Nor did breed group affect the type or species of trypanosome parasitaemia in Boundiali (Table 12).
Table 12. Proportion of trypanosome species causing parasitaemia in trypanotolerant and crossbred groups, Boundiali.
|
|
Trypanotoleranta |
Crossbredb |
|
T. congolense |
0.46 |
0.48 |
|
T. vivax |
0.29 |
0.31 |
|
T. brucei |
0.03 |
003 |
|
T. congolense and T. vivax |
0.06 |
0.08 |
|
T. congolense and T. brucei |
<0.01 |
<0.01 |
|
T. vivax and T. brucei |
0.14 |
0.10 |
|
T. congolense, T. vivax and T. brucei |
0.02 |
<0.01 |
|
Total number of parasitaemic months |
841 |
411 |
a N'Dama and Baoule.
b Crossbreds between N'Dama, Baoule and Zebu.
Other systematic factors, e.g. animal sex and female physiological status, had no apparent influence on susceptibility to specific trypanosomes.
Intensity of trypanosome parasitaemia
At Network sites intensity of trypanosome parasitaemia measured by a score, 1 to 6, was low with the mean generally below 3. Exceptions were the village cattle and sheep populations in Avetonou where parasitaemia scores in the village compared to ranch cattle, were 3.2 and 1.9, respectively.
Breed groups could also be compared in Boundiali. Trypanotolerant and crossbred groups had mean scores of 2.2 and 2.1 for T. congolense and 2.9 and 2.7 for T. vivax parasitaemias, respectively, suggesting that the effect of trypanosome species was greater than any effect of breed group.
The higher mean score of T. vivax compared to T. congolense, independent of animal age, is shown by the results in Table 13. For the three age classes in Boundiali and the two age classes in Mushie, the mean scores of T. vivax parasitaemias were higher than those of T. congolense. Differences between age classes were less consistent, but at both sites the mean score of T. vivax parasitaemia decreased with age. At the two sites with susceptible East African Zebu cattle, Muhaka and Ghibe, mean scores were also around 2.5 with no difference between the two trypanosome species; in T. congolense animal age did not effect the score.
Table 13. Mean scores of T. congolense and T. vivax parasitaemias in three age classes.
|
|
Pre-weaners |
Post-weaners |
Adult females | |
|
T. congolense | ||||
|
|
Mushie |
1.9 |
- |
1.5 |
|
|
Boundiali |
2.0 |
2.3 |
2.1 |
|
|
Avetonou village |
- |
2.1 |
2.2 |
|
|
Muhaka |
2.2 |
2.8 |
2.5 |
|
|
Ghibe |
2.4 |
2.4 |
2.4 |
|
T. vivax | ||||
|
|
Mushie |
2.1 |
- |
1.8 |
|
|
Avetonou ranch |
2.4 |
1.9 |
1.5 |
|
|
Boundiali |
3.3 |
3.0 |
2.4 |
|
|
Avetonou village |
3.4 |
3.1 |
3.1 |
|
|
Ghibe |
2.1 |
2.3 |
2.4 |
|
|
Muhaka |
2.2 |
2.5 |
2.6 |
Duration and pattern of trypanosome parasitaemia
In order to measure duration of parasitaemias, the sequences of successive parasitaemic months were evaluated at the two Network sites: Mushie and Idiofa. No systematic trypanocidal drug treatments had been given, trypanosome prevalence was sufficiently high and monthly recording was sufficiently complete. It was eventually assumed that in cattle not receiving trypanocidal drug, a sequence of successive parasitaemic months with the same trypanosome species reflects an ongoing single infection; such an infection would be preceded and followed by two non-parasitaemic months.
Table 14 shows the pattern of T. congolense parasitaemia in N'Dama calves and cows in Mushie. While calves and cows had similar patterns of parasitaemia there was a tendency for the parasitaemia in cows to last longer. The reverse tendency was found for T. vivax parasitaemia, cows having a higher proportion of short duration parasitaemia than calves (Table 15). Comparable results were shown by the N'Dama cattle in the village herds of Idiofa (Table 16). In both management systems, 75% or more of the trypanosome infections in N'Dama cattle lasted only one month and only 3 to 6% of the infections lasted 4 or more months.
Table 14. Sequences and pattern of parasitaemia in T. congolense infections of N'Dama cattle not receiving therapeutic treatments, Mushie.
|
Duration of infections months |
Pattern of parasitaemia |
Calves |
Cows |
||
|
No. of infection |
Proportion of total |
No. of infection |
Proportion of total |
||
|
1 |
--C-- |
78 |
0.78 |
357 |
0.75 |
|
2 |
--CC-- |
12 |
0.12 |
49 |
0.10 |
|
3 |
--CCC-- |
6 |
0.07 |
18 |
0.08 |
|
|
--C-C-- |
1 |
|
22 |
|
|
4 |
--CCCC-- |
1 |
|
3 |
|
|
|
--C-CC-- |
- |
|
5 |
|
|
|
--CC-C-- |
- |
|
11 |
|
|
5 |
-CCC-C-- |
1 |
0.03 |
2 |
0.06 |
|
|
--CC-CC-- |
|
|
1 |
|
|
|
--C-C-C-- |
|
|
1 |
|
|
6 or more |
|
1 |
|
4 |
|
|
|
Total |
100 |
|
473 |
|
Table 15. Proportion of T. congolense and T. vivax infections with durations of 1, 2, 3 and 4 or more months in N'Dama calves (less than 1 year of age) and cows not receiving therapeutic treatments, January 1984 to December 1986, Mushie.
|
Duration of infection months |
T. congolense |
T. vivax |
||
|
Calves |
Cows |
Calves |
Cows |
|
|
1 |
0.78 |
0.75 |
0.79 |
0.85 |
|
2-3 |
0.19 |
0.19 |
0.20 |
0.13 |
|
4 or more |
0.03 |
0.06 |
0.01 |
0.02 |
|
Total number of infections |
100 |
473 |
170 |
184 |
In the Ghibe villages systematic Berenil treatments are given when cattle are parasitaemic and their PCVs are below 26% or when trypanosomiasis is suspected from clinical symptoms. With these indications 85.5% of the parasitaemic months lead to Berenil treatments.
Assuming that these treatments were effective, a sequence of two or more parasitaemic months should represent a "sequence" of infections, as 23% of the treated parasitaemias were followed by a new parasitaemia the next month regardless of the trypanosome species. These reinfections or relapses occur with a very short prepatent period as the intervals between two bleedings and the detection of parasitaemia are always one month. The possibility of trypanosome resistance to Berenil needs to be investigated.
Table 16. Proportion of T. congolense infections with durations 1, 2 or 3 and 4 or more months in N'Dama calves (less than 1 year of age) and cows with ranch management, Mushie and in N'Dama cattle (all age groups) in village herds, Idiofa. Few therapeutic treatments were given.
|
Duration of infections, months |
Mushie Ranch |
Idiofa Village Cattle |
|
|
Calves |
Cows |
||
|
1 |
0.78 |
0.75 |
0.76 |
|
2-3 |
0.19 |
0.19 |
0.21 |
|
4 or more |
0.03 |
0.06 |
0.03 |
|
Total number of infections |
100 |
473 |
248 |
The seasonal and annual variations of prevalence as well as its large variation between herds located in the same region indicate the need for further investigation to more accurately define trypanosomiasis risk, this being necessary for designing livestock development strategies in the highly tsetse-infested areas of Africa.
Results showed the importance of animal age on the trypanosome species detected in parasitaemia. The proportion of T. vivax infection decreased with age, with younger animals generally having more T. vivax than T. congolense infections with the reverse in adults.
The fact that non-gestating trypanotolerant cows were more often parasitaemic than when gestating seems not to have influenced their reproduction capability (Thorpe, see article 21 of these Proceedings), confirming experiments at ILRAD (Lorenzini, see article 18). Therefore further investigations are required to understand this difference in susceptibility measured by prevalence during two different physiological states.
Trypanosome prevalence was regularly higher in cattle than in sheep when both species were exposed to the same environment. The frequency of T. congolense was much higher in cattle than in sheep and T. vivax was evidently more frequent in sheep than in cattle. The potential and eventual comparative advantage of small ruminants over cattle as an alternative for livestock production in higher risk situations needs to be considered more systematically in research plans.
Where trypanosusceptible breeds were maintained together with tolerant breeds, their susceptibility was enhanced by a higher trypanosome prevalence. But there are very few situations where this comparison may be accurately considered. In West and Central Africa only trypanotolerant breeds are maintained under high trypanosomiasis risk. In East Africa, where there was no introduction of tolerant breeds, trypanocidal drugs are systematically used on trypanosusceptible breeds when under high risk. If further comparative investigations are required, it will be necessary to identify or create situations where both types of animals are maintained together with appropriate interventions to allow zebu cattle to survive and produce.
ILCA. 1986a. The ILCA/ILRAD Trypanotolerance Network. Situation Report, December, 1985. Proceedings of a Network Meeting held at ILCA, Nairobi. ILCA, Addis Ababa.
ILCA. 1986b. The African Trypanotolerant Livestock Network. Indications from Results 1983-1985. ILCA, Addis Ababa.
Murray, M. J.C.M. Trail, D.A. Turner and Y. Wissocq. 1983. Livestock Productivity and Trypanotolerance. Network Training Manual. Addis Ababa: ILCA.
![]()
![]()
![]()