![]()
![]()
![]()
L. COULIBALY. I. DIARRASOUBA, G.D.M. d'IETEREN, P. HECKER, P. ITTY J.H.H. MAEHL, B. MAHAMAT, S.M. NAGDA, R. W. PALING, J.M. RARIEYA, A. SCHUETTERLE, W. THORPE and J.C.M. TRAIL
Introduction
Description of study
Results
Conclusion
References
Trypanosomiasis is diagnosed by the detection of trypanosomes in the blood and by the presence of anaemia. Other diseases also produce anaemia and hence, when evaluating trypanosomiasis in the field, it is essential to quantify the importance of other anaemia-producing pathogens. The Network protocol provides this information by testing for trypanosomes, estimating anaemia and monitoring other anaemia-producing endemic diseases.
Within the Network site at Boundiali in northern Cote d'Ivoire, anaemia-producing diseases other than trypanosomiasis are sufficiently widespread in the village cattle and sheep to permit the evaluation of their possible effects on animal health and production. Interactions with trypanosomiasis can also be evaluated.
As indicated in earlier papers, recording at Network sites includes the simultaneous collection of matching information on animal health and production. Sequential monthly blood samples from all animals in the study are tested for trypanosomes and other major blood parasites. All sheep sampled for blood, regardless of age, are also sampled for faeces. Cattle sampled for blood are also sampled for faeces until two years of age. In this study some adult cattle were also sampled. The protocols and methodologies have been described in detail in the Network Manual (Murray et al., 1983).
The sequential monthly sampling of these village livestock populations was not always complete, but sufficient records were obtained to indicate the relative prevalence of the major parasites and to give a first assessment of the magnitude of their effect on packed red cell volume per cent (PCV), the estimate of anaemia, and on the major production traits, particularly weaning weights and weight changes pre-weaning, both in the dam and her progeny.
Results mainly relate to six cattle herds and five sheep flocks which were continuously recorded over 36 months, January 1984 to December 1986. There were an average of 260 cattle per month and some 100 sheep per month. Cattle were N'Dama, Baoule and crosses between N'Dama, Baoule and Zebu, and sheep were mainly Djallonke with some Djallonke x Sahelian.
Prevalences
The percentage of animals in which parasites were detected at the monthly recording is the estimate of prevalence. Table 1 presents the average monthly prevalence of trypanosomes, other blood parasites and internal parasites for cattle and sheep.
Table 1. Mean monthly prevalence (%) of anaemia-producing parasites in village cattle and sheep, January 1984 to December 1986, Boundiali.
|
Livestock Species |
NO.a |
Trypanosomes |
Other blood parasites |
No.a |
Internal parasites |
|||
|
Mean |
s.e. |
Mean |
s.e. |
Mean |
s.e. |
|||
|
Cattle |
258 |
13.9 |
2.16 |
51.3 |
2.89 |
111 |
45.3 |
5.09 |
|
Sheep |
183 |
9.1 |
2.17 |
31.0 |
3.28 |
143 |
53.3 |
4.24 |
a Average number of animals recorded each month.
The prevalence of trypanosomes and other blood parasites was higher in cattle than in sheep, while the prevalence of internal parasites was higher in sheep than in cattle.
Strongyles and coccidia were the most frequently occurring internal parasites and were found in 32 and 11% of monthly samples, respectively, in cattle, and 31 and 27%, respectively, in sheep (Table 2). Levels of infestation were low, the one exception being high strongyle egg burdens in 6.7% of the monthly samples tested in sheep. Theileria spp., the only common blood parasites other than trypanosomes, were found in 43 and 28% of monthly samples in cattle and sheep, respectively. These parasites, and Strongyloides in sheep, were the ones chosen for further study
Table 2. Percent of tested animal-months with detected parasites.
|
|
Cattle |
Sheep | |
|
Internal | |||
|
|
Strongyles |
31.6 |
30.7 |
|
|
Strongyloides |
3.3 |
7.1 |
|
|
Ascaris |
4.1 |
1.5 |
|
|
Trematodes |
2.6 |
1.0 |
|
|
Coccidia |
11.2 |
27.1 |
|
|
Others |
0.4 |
3.9 |
|
Blood | |||
|
|
Theileria |
43.2 |
28.3 |
|
|
Microfilariae |
10.0 |
0.5 |
|
|
Babesia |
2. 0 |
0.5 |
|
|
Anaplasma |
0.3 |
1.5 |
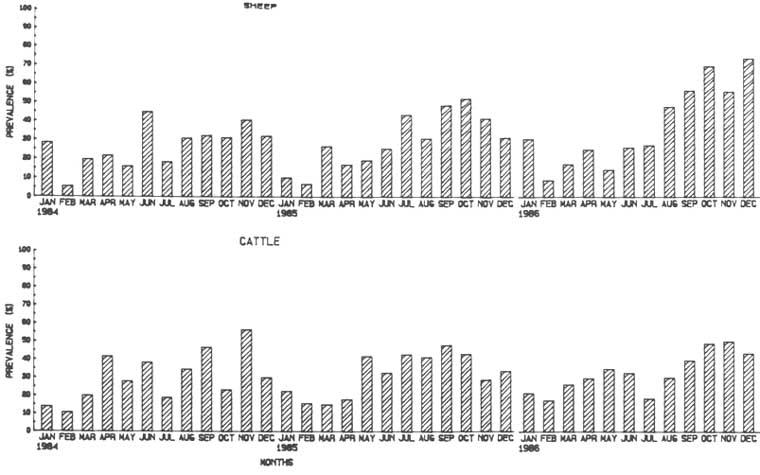
Figure 1. Monthly prevalence of strongyle egg burdens in cattle and sheep.
There was little variation between herds, but large variation between seasons for the presence of these parasites. Figure 1 presents the monthly prevalences of strongyles in cattle and sheep from January 1984 to December 1986. The prevalences of strongyles, trypanosomes and Theileria spp. were higher during and after the rainy season. Seasonal variation of coccidia prevalence was less consistent. Variation between years was also large for these species. For example, there was a four-fold increase of Theileria prevalence in cattle and a three-fold increase in sheep from 1984 to 1986. During the same period, coccidia prevalence doubled in both cattle and sheep.
Breed (Djallonke or Djallonke x Sahelian in sheep, and N'Dama, Baoule and crosses between N'Dama Baoule and Zebu in cattle) did not have any apparent effect on the prevalence of the major parasites. Nor did animal age classes have any apparent effect on the prevalence of strongyles, but coccidia were detected more frequently in young animals. Theileria spp. were detected infrequently in pre-weaner sheep but were common in all age classes of cattle.
PCV and liveweight
Preliminary analyses of all animal-month PCV records were carried out to calculate the mean PCV of cattle and of sheep in which anaemia-producing parasites had or had not been detected.
Table 3. Mean PCV (%) of cattle infected or uninfected with trypanosomes in the presence or absence of internal and/or blood parasites.
|
Parasites |
Trypanosome infection |
Difference |
Percent |
||
|
Internal |
Blood |
Negative |
Positive |
||
|
- |
- |
31.6 |
29.0 |
2.6 |
8.2 |
|
- |
+ |
29.9 |
26.7 |
3.2 |
10.7 |
|
+ |
- |
30.8 |
26.8 |
4.0 |
13.0 |
|
+ |
+ |
29.5 |
24.8 |
4.7 |
15.9 |
Tables 3 and 4 show that trypanosome parasitaemia depressed PCV: cattle with no trypanosomes or other parasites had a mean PCV of 31.6%, while cattle with trypanosomes, other blood and internal parasites, had a mean PCV of 24.8%. Sheep with no detected parasites had a mean PCV of 27.8%, but for sheep with the three classes of parasite it was 21.7%. These preliminary results indicate the important effects of parasitaemia on PCV.
To estimate these effects with minimum bias from other systematic genetic and environmental factors, for example, herd, year/season of parturition/birth, breed, dam age, etc., PCV and liveweights were analysed by least-squares (Harvey, 1977).
The effects of trypanosome parasitaemia and of the other parasites were estimated by the number of parasitaemic months during the period defined by the trait being analysed. The study populations included some animals in which no parasites had been detected during the defined period.
Table 4. Mean PCV (%) of sheep infected or uninfected with trypanosomes in the presence or absence of internal and/or blood parasites.
|
Parasites |
Trypanosome infection |
Difference |
Percent |
||
|
Internal |
Blood |
Negative |
Positive |
||
|
- |
- |
27.8 |
23.5 |
4.3 |
9.7 |
|
- |
+ |
27.1 |
23.0 |
4.1 |
11.4 |
|
+ |
- |
27.1 |
22.1 |
5.0 |
9.8 |
|
+ |
+ |
25.8 |
21.7 |
4.1 |
16.4 |
Linear models were fitted with main effects appropriate to the animal species and character. The two-factor interactions between trypanosome parasitaemia and the other parasites, and between all parasites and the other main effects were also fitted as appropriate and possible. To facilitate the analyses, the effect of a specific parasite was often fitted as a factor with two classes, no months with the specific parasite detected or one or more months with the parasite. Limited numbers of observations in individual herds usually prevented the estimation of herd x parasite interactions.
The PCV characters analysed were:
average dam PCV during gestation,
average dam PCV during lactation and
average progeny PCV pre-weaning.
Gestation was defined as nine and five months pre-partum and lactation and weaning as eight and four months post-partum in cattle and sheep, respectively.
Sheep
The liveweight characters analysed for sheep were:
ewe liveweight post-partum,
ewe liveweight at weaning,
ewe daily liveweight change during lactation,
lamb liveweight at weaning and
lamb daily liveweight change pre-weaning.
Table 5 presents the results for ewe PCV characters and ewe weight change during lactation. Trypanosome parasitaemia of the ewe significantly depressed PCV but did not significantly affect weight change. The PCV of ewes with other specific parasites detected in one or more months was not different from the PCV of ewes in which no parasites were detected. The detection of a strongyle egg burden in one or more months during the lactation did significantly depress weight change, but other parasites had no effect.
No interactions between the effect of trypanosomes and of other parasites, or between the other parasites, were significant, nor were there any indications of possible differential effects on PCV and liveweight in ewes for these parasites at these low levels of infection.
Table 5. Least-squares means of ewe average PCV during gestation and lactation and weight change during lactation for classes of parasite infection.
|
|
Average PCV during gestation (%) |
Average PCV during lactation (%) |
Weight change during lactation (g/d) |
||||||
|
No. |
Mean |
s.e. |
No. |
Mean |
s.e. |
No. |
Mean |
s.e. |
|
|
Overall |
513 |
26.9 |
0.39 |
515 |
26.6 |
0.36 |
399 |
3 |
4.0 |
|
No. of months with parasite detected |
|||||||||
|
Trypanosomes
|
0 |
27.8 |
0.31 |
|
27.6 |
0.35 |
|
7 |
3.9 |
|
1 |
27.6 |
0.55 |
|
25.6 |
0.55 |
|
-1 |
6.0 |
|
|
2 or more |
25.3 |
0.82 |
|
- |
- |
|
- |
- |
|
|
|
* |
|
|
*** |
|
|
|
|
|
|
Strongyles |
0 |
26.7 |
0.54 |
|
26.6 |
0.51 |
|
9 |
5.4 |
|
1 or more |
27.1 |
0.38 |
|
26.7 |
0.34 |
|
-2 |
3.8 |
|
|
Strongyloides |
0 |
27.1 |
0.34 |
|
26.8 |
0.36 |
|
2 |
4.0 |
|
1 or more |
26.7 |
0.59 |
|
26.5 |
0.47 |
|
4 |
5.2 |
|
|
Coccidia |
0 |
27.0 |
0.42 |
|
26.8 |
0.39 |
|
3 |
4.3 |
|
or more |
26.7 |
0.59 |
|
26.5 |
0.47 |
|
4 |
5.2 |
|
|
Theileria |
0 |
27.1 |
0.44 |
|
26.7 |
0.44 |
|
3 |
5.0 |
|
1-2 |
26.6 |
0.41 |
|
26.3 |
0.41 |
|
2 |
4.4 |
|
|
3 or more |
27.0 |
0.47 |
|
26.8 |
0.46 |
|
5 |
5.1 |
|
*P<0.05 - ***P<0.001
Table 6 presents equivalent results for the lamb characters. Trypanosome parasitaemia of the individual and of the dam depressed PCV, but lambs infected with other parasites had a similar mean PCV to lambs in which none of these parasites were detected. Again there were no significant interactions between the various parasites nor any indication of possible interaction effects. Neither did the parasites significantly depress lamb pre-weaning daily gain nor the resultant weaning weight, although trypanosomes in the lamb did result in a lighter weaning weight. Contrarily, in this sample the presence of Theileria gave a significantly higher weaning weight. Interactions were again non-significant and had no apparent importance.
It appears that in this Djallonke-based population internal parasites, as measured in this study, do not affect PCV. Possibly, strongyles depressed ewe weight during lactation and trypanosomes depressed lamb growth, and the latter certainly depressed PCV in both young and adult sheep. However there were no indications of any differential effects of one parasite in the
Table 6. Least-squares means of average PCV and daily liveweight change and weaning weight of lambs for classes of parasite infection.
|
|
Average PCV pre-weaning (%) |
Daily liveweight gain pre-weaning (g/d) |
Weaning weight (kg) |
|||||
|
No. |
Mean |
s.e. |
No. |
Mean |
s.e. |
Mean |
s.e |
|
|
Overall |
298 |
28.5 |
0.78 |
213 |
75 |
6.1 |
11.4 |
0.61 |
|
No. of months with parasite detected |
||||||||
|
Trypanosomes in the ewe |
0 |
29.1 |
0.86 |
74 |
6.3 |
11.3 |
0.63 |
|
|
1 |
28.3 |
1.08 |
77 |
6.8 |
11.8 |
0.68 |
|
|
|
2 or more |
28.1 |
0.87 |
|
74 |
6.9 |
11.1 |
0.69 |
|
|
Trypanosomes in the lamb |
0 |
29.6 |
0.58 |
|
77 |
3.4 |
12.0 |
0.34 |
|
1 or more |
27.4 |
1.28 |
|
73 |
11.3 |
10.8 |
1.13 |
|
|
|
P<0.08 |
|
|
|
|
|
||
|
Other parasites in the lamb |
||||||||
|
Strongyles |
0 |
28.4 |
0.92 |
|
76 |
6.8 |
11.5 |
0.68 |
|
1 or more |
28.6 |
0.89 |
|
74 |
8.3 |
11.3 |
0.83 |
|
|
Strongyloides |
0 |
28.8 |
0.69 |
|
76 |
5.4 |
11.3 |
0.54 |
|
1 or more |
28.2 |
1.09 |
|
74 |
8.4 |
11.5 |
0.84 |
|
|
Coccidia |
0 |
28.5 |
0.83 |
|
75 |
6.8 |
11.2 |
0.68 |
|
1 or more |
28.6 |
0.78 |
|
74 |
5.9 |
11.6 |
0.59 |
|
|
Theileria |
0 |
28.3 |
0.87 |
|
70 |
7.9 |
10.6 |
0.79 |
|
1 or more |
28.8 |
|
0.84 |
80 |
5.6 |
12.2 |
0.56 |
|
|
|
|
|
|
|
|
P<0.01 |
|
|
Cattle
The effects of trypanosome parasitaemias and infection with other parasites on the PCV and growth of young cattle could be estimated most precisely during the period March to October 1986. March marked the beginning of the rainy season and, for the period until November, cattle had sustained liveweight gains and a high prevalence of trypanosomes, Theileria spp., strongyles and coccidia.
Average PCV and daily liveweight gain (g/d) were calculated from the monthly records, March to October, for 174 cattle which were aged 26 months or less at March and for which at least four of the eight possible monthly weight and health records were available. Generally animals had six or more records.
Least-squares analyses estimated the effects of the number of months with trypanosome parasitaemia, Theileria spp, strongyles and coccidia on average PCV and daily liveweight gain. Herd, breed, sex and age class and appropriate two-factor interactions were also included as factors in the analyses.
During the study period all animals had at least one month in which Theileria spp. were detected. In preliminary analyses the number of months in which Theileria spp. were detected did not affect PCV or growth, nor was the interaction with the number of monthly trypanosome parasitaemias significant. Consequently the factor (presence of Theileria spp.) was omitted from subsequent analyses.
Table 7. Least-squares means and standard errors of average PCV and daily liveweight gain for trypanosome, strongyle egg burden and coccidia classes of young cattle.
|
|
No. |
Average PCV (%) |
Daily liveweight gain (g/d) |
|||
|
Mean |
s.e. |
Mean |
s.e |
|||
|
Overall mean |
137 |
29.2 |
0.43 |
259 |
12 |
|
|
No. of months with trypanosomes |
||||||
|
|
0 |
52 |
30.6 |
0.55 |
258 |
15 |
|
|
1 |
41 |
29.5 |
0.58 |
257 |
16 |
|
|
2 |
32 |
28.1 |
0.57 |
245 |
16 |
|
|
3 or more |
12 |
28.4 |
0.88 |
276 |
24 |
|
|
|
*** |
|
NS |
|
|
|
No. of months and level of strongyle egg burden |
||||||
|
|
0 |
16 |
28.8 |
0.79 |
242 |
22 |
|
|
1 |
30 |
29.2 |
0.64 |
265 |
18 |
|
|
2 low burdensa |
37 |
28.9 |
0.56 |
256 |
15 |
|
|
3 |
19 |
29.9 |
0.73 |
256 |
20 |
|
4 or more |
19 |
28.7 |
0.70 |
269 |
19 |
|
|
1 highb and 0 to 4 low burdens |
16 |
29.6 |
0.81 |
264 |
22 |
|
|
|
|
NS |
|
NS |
|
|
|
No. of months with coccidia |
||||||
|
|
0 |
52 |
29.3 |
0.54 |
265 |
15 |
|
|
1 |
57 |
28.2 |
0.50 |
250 |
14 |
|
|
2 or more |
28 |
30.0 |
0.63 |
263 |
17 |
|
|
|
* |
|
NS |
|
|
a <500 eggs per gram.
b 500 or more eggs per gram.
*P<0.05
***P<0.001
In the reduced population with five or more months tested for internal parasites, the presence of strongyles and coccidia did not depress PCV or daily liveweight gain (Table 7). Neither were their interactions with trypanosome parasitaemia significant, nor were there indications of important interactions. The results in Table 7 show that even animals with a high strongyle egg burden had similar average PCVs and growth to the animals with no, or with infrequent, detection of a low strongyle egg burden. The presence of coccidia did not depress PCV or growth.
Whereas the other parasites neither depressed PCV nor growth, trypanosome parasitaemia significantly affected PCV but not growth. PCVs of young cattle with two or more parasitaemic months during the study period of ten months, was over two percentage units (8%) lower than that of cattle with no trypanosomes detected during the period. No interactions between the effect of trypanosomes and other parasites, or of trypanosomes and other main effects e.g. animal age class, reached significance. Nor did the interaction sub-class means suggest any important differential effects of trypanosomes in the presence of other parasites or on any of the specific age classes included in these analyses.
The growth of these predominantly trypanotolerant cattle, managed in village herds was unaffected by the levels of infestation of the most prevalent parasites recorded in this study. Trypanosomes, but not other parasites, depressed PCV but interactions between the parasites were unimportant for PCV and for growth. If one can assume that the presence and levels of parasite infestation were accurately measured in these village cattle, then under the environmental and management conditions of this field study, parasites other than trypanosomes were not important influences on health and production. Experimental prophylaxis to quantify the effects on livestock health and production of trypanosomes and other endemic parasites could be an efficient method of confirming this conclusion.
Harvey, W.R. 1977. User's Guide for Least-squares and Maximum Likelihood Computer Program. Columbus: Ohio State Univ.
Murray, M. J.C.M. Trail, D.A. Turner and Y. Wissocq. 1983. Livestock Productivity and Trypanotolerance. Network Training Manual. Addis Ababa: ILCA.
![]()
![]()
![]()