F.R. MAXFIELD, N.H. SALZMAN, K. DUNN and T. MCGRAW
Department of Pathology
College of Physicians and Surgeons
Columbia University
New York, NY 10032, USA
pH of endosomal compartments
Vesicle fusion and separation on the endocytic pathway
References
Mammalian cells have very efficient mechanisms for routing endocytosed molecules to various cellular destinations following internalization. For example, many receptors are recycled back to the cell surface while the ligands they carried into the cell are delivered to lysosomes and degraded. We have studied the mechanisms for this sorting in cultured fibroblasts, primarily Chinese hamster ovary (CHO) cells.1-6 In our studies we have emphasized the use of quantitative fluorescence microscopy and digital image processing. This has provided a powerful method for looking at endocytic processes in living cells.
Using fluorescein-labelled endocytic probes, we have measured the pH of various endocytic compartments. We have found that endosomes maintain an acidic pH and that different types of endosomes are regulated to different pH values.4,6 This acidification is required for several of the processes associated with endocytosis, including release of several ligands from receptors,7,8 dissociation of iron from transferrin,9,10,11 and penetration of some viruses and toxins into the cytosol.12,13
More recently, we have developed two types of fluorescence assay for fusion of endocytic vesicles. Both methods indicate that endosomes fuse actively for several minutes after internalization. The fusion competence of the endosomes then falls off as the endosomes mature. In this paper we describe a model that can account for many features of the sorting which occurs following endocytosis. The model is based on our observations of endosome acidification and fusion.
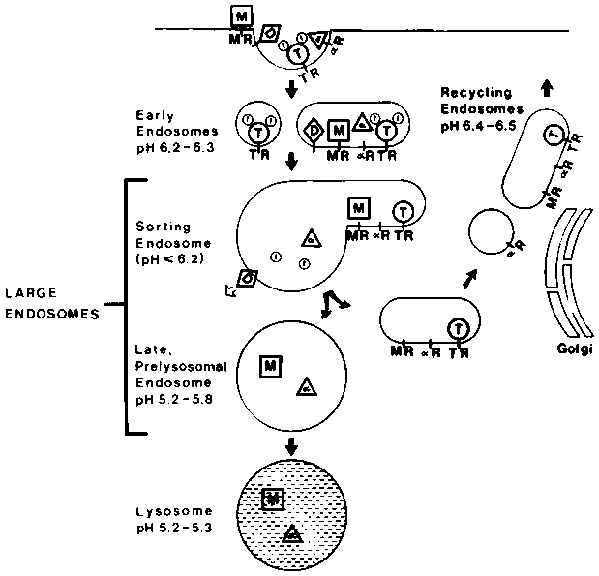
The endosomal compartments in CHO cells are illustrated schematically in Figure 1. Since the excitation of fluorescein is strongly pH dependent, the pH of endosomes can be determined by delivering fluorescein-labelled probes to the appropriate compartment and measuring the fluorescence.1 We have used a variety of fluorescent probes and incubation conditions to obtain the pH values shown in Figure 1.
The early endosomes were labelled by very brief incubations with fluorescein dextran, fluorescein-a 2-macroglobulin or fluorescein transferrin. At the very earliest times following endocytosis, an average endosomal pH of approximately 6.5-6.8 was measured.3,4 After a few minutes, fluorescein-a 2-macroglobulin accumulates in large endosomes, which are easily resolved as distinct structures by fluorescence microscopy. These vesicles have an average pH of approximately 5.5.4,6 After approximately 20 minutes, a 2-macroglobulin is found in lysosomes that maintain a pH between 5.0 and 5.5 in CHO cells.6
Since transferrin remains associated with its receptor as it recycles,10,11 fluorescein-transferrin can be used to measure the pH of endosomal compartments on the recycling pathway after they have diverged from the pathway leading to lysosomes. In CHO cells, we have found that the post-sorting recycling endosomes are heavily concentrated in the trans-Golgi region of the cell. The pH of these para-Golgi recycling endosomes is approximately 6.5.6
From these measurements, we can establish that ligands and receptors are exposed to different acidic pH values within different types of endosomes. This pattern of acidification has several important consequences, which have been reviewed elsewhere.1 Many ligands such as a 2-macroglobulin, low-density lipoproteins (LDL) and epidermal growth factor will dissociate from their receptors at the mildly acidic pH, found in early endosomes. Other ligands, notably lysosomal enzymes require a more acidic pH, like that found in large endosomes, for complete dissociation.14,15 The iron that is carried into cells bound to transferrin is released at pH values below 6.0.9 This suggests that iron is released within the sorting endosome, since that is the lowest pH compartment on the recycling pathway. Many viruses are also brought into the cell by receptor-mediated endocytosis and pass through the same endocytic compartments.12 The compartment from which an enveloped virus penetrates into the cytosol may be determined by the pH at which the virus coat proteins become capable of fusing with target membranes.16,17 Only when the virus enters a sufficiently acidic endosome will it be able to cross the membrane.
It is clear that ligand-receptor dissociation within the cell is obligatory in those cases where receptors are recycled as the ligand is degraded. As discussed above, the acidity of endosomes is sufficient to cause the dissociation of ligands from receptors. However, at this stage both molecules are still within the same compartment.18 The mechanisms for segregating the ligands from receptors following dissociation have been unclear.
To observe how the process occurs in living cells, we have developed methods for studying fusion and separation of vesicles in living cells. In one assay, endosomes are sequentially loaded with fluorescein-labelled ligands, followed by anti-fluorescein antibodies, which quench fluorescence. Endosome fusion is monitored by loss of fluorescence intensity.19 In a second method, we use very sensitive image intensifiers and digital image analysis to measure the fluorescence intensity of individual endosomes.
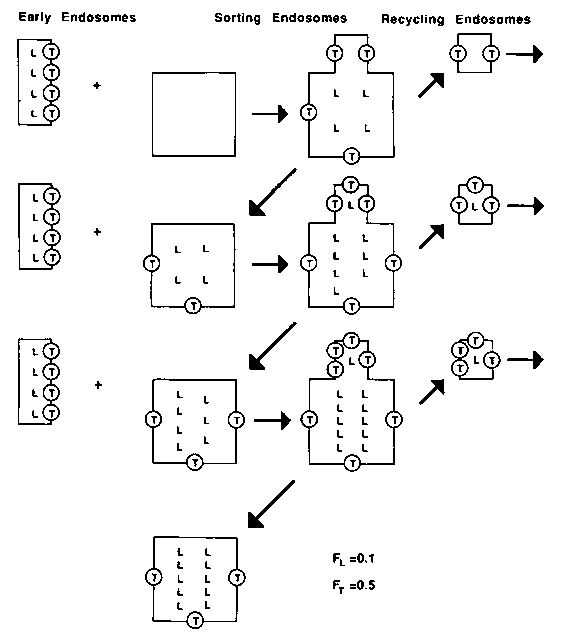
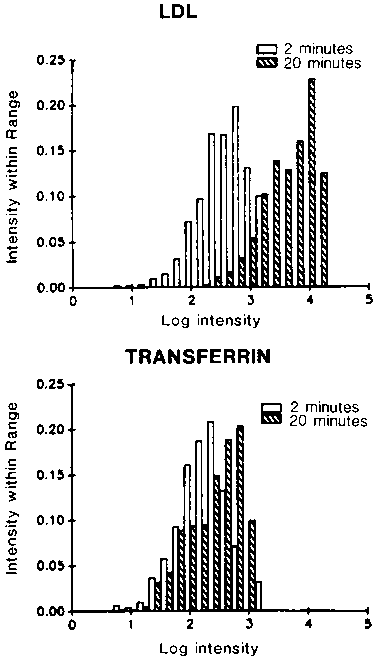
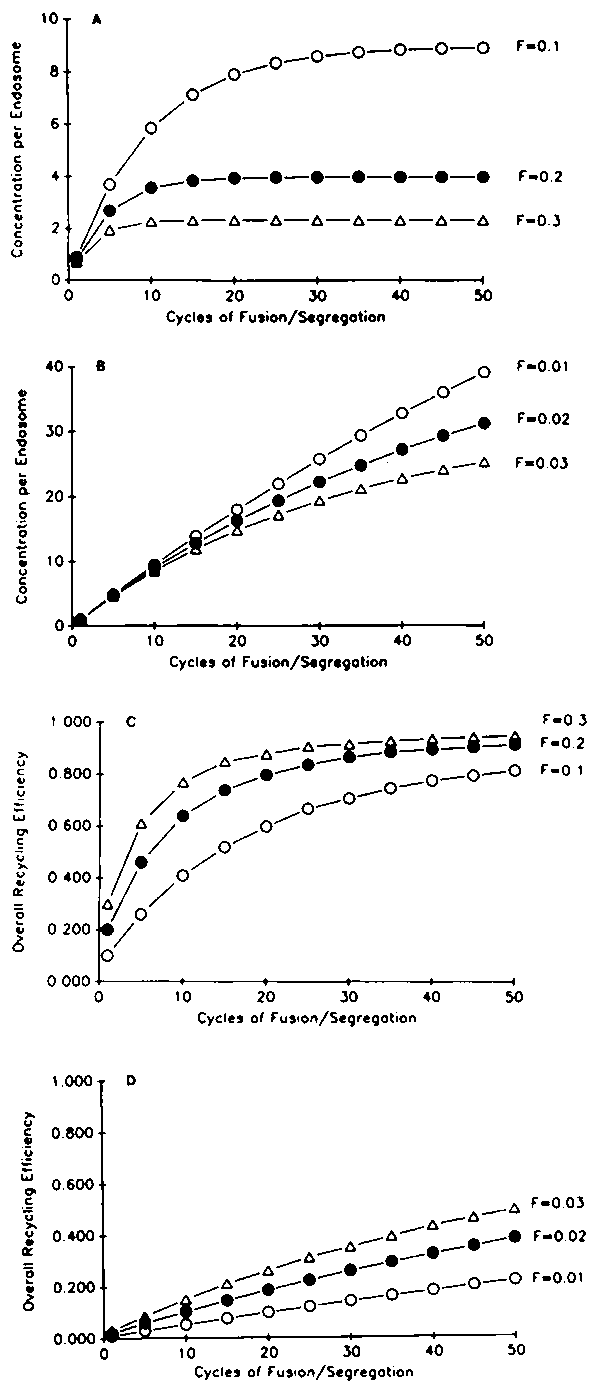
The picture that emerges from these studies may be summarized as follows (see Figure 2). For several minutes after internalization, endosomes fuse actively. For non-recycling components (e.g., LDL) this fusion results in a very large increase in the number of molecules per endosome. Histograms of endosome intensities are shown in Figure 3. We estimate that LDL per endosome increases approximately 40 fold within endosomes. In contrast, there is only a small increase in the number of recycling components per endosome. For example, we find that the transferrin per endosome increases about 2-3 fold. This indicates that transferrin is being removed as LDL continues to accumulate. We have modeled this process as a repeated series of fractionations, analogous to repeated distillation steps. If each cycle removes a higher fraction of transferrin than LDL, then repetition of the cycle can result in very efficient sorting of transferrin from LDL. Results of sample calculations are shown in Figure 4. The values of F are the fraction of molecules removed from a sorting endosome at each segregation step. For recycling molecules, F values near 0.2 would lead to 90% efficient recycling within 40 cycles. The maximum accumulation would be 4 times the number of molecules in an early endosome. This is close to our observed values for transferrin. For ligands that are retained in endosomes, F values near 0.01 are more appropriate. In this case, accumulation is nearly linear and only about 20% of the ligands would be recycled after 40 cycles. This is close to the observed properties for ligands such as LDL or a 2-macroglobulin. After 5-10 minutes, the endosomes no longer fuse with incoming vesicles.19 This would correspond to a time at which they begin to mature into lysosomes.
The geometry of the sorting endosome is well-suited for carrying out this type of fractionation. Acid-releasable ligands are distributed throughout the volume, whereas recycling components are distributed along the membrane surface. The tubular extensions of endosomes have a high surface to volume ratio. Fusion and budding of these tubular extensions would provide a simple mechanism for carrying out the repeated fractionations described in this model.
1. MAXFIELD, F.R. 1985. In Endocytosis. I. Pastan and M.C. Willingham, Eds.: 235-257. Plenum Press, New York.
2. TYCKO, B. and F.R. MAXFIELD. 1982. Cell 28: 643-651.
3. YAMASHIRO, D.J. and F.R. MAXFIELD. 1987. J. Cell Biol. 105: 2713-2721.
4. YAMASHIRO, D.J. and F.R. MAXFIELD. 1987. J. Cell Biol. 105: 2723-2733.
5. YAMASHIRO, D.J., S.R. FLUSS and F.R. MAXFIELD. 1983. J. Cell Biol. 97: 929-934.
6. YAMASHIRO, D.J., B. TYCKO, S.R. FLUSS and F.R. MAXFIELD. 1984. Cell 37: 789-800.
7. HARFORD, J., A.W. WOLKOFF, G. ASHWELL and R.D. KLAUSNER. 1983. J. Cell Biol. 96: 1824-1828.
8. MAXFIELD, F.R. 1982. J. Cell Biol. 95: 676-681.
9. AISEN, P. and I. LISTOWSKY. 1980. Ann. Rev. Biochem. 49: 357-393.
10. DAUTRY-VARSAT, A., A. CIECHANOVER and H.F. LODISH. 1983. Proc. Natl. Acad. Sci. USA 80: 2258-2262.
11. VAN RENSWOUDE, J., K.R. BRIDGES, J.B. HARFORD and R.D. KLAUSNER. 1982. Proc. Natl. Acad. Sci. USA 79: 6186-6190.
12. MARSH, M. 1984. Biochem. J. 218: 1-10.
13. OLSNES, S. and K. SANDVIG. 1985. In Endocytosis. I. Pastan and M.C. Willingham, Eds.: 195-234. Plenum Press, New York.
14. GONZALEZ-NORIEGA, A., J.H. GRUBB, V. TALKAD and W.S. SLY. 1980. J. Cell Biol. 85: 839-852.
15. HOFLACK, B., K. FUJIMOTO and S. KORNFELD. 1987. J. Biol. Chem. 262: 123-129.
16. KIELIAN, M.C. and A. HELENIUS. 1985. J. Cell. Biol. 101: 2284-2291.
17. KIELIAN, M.C., M. MARSH and A. HELENIUS. 1986. EMBO J. 5: 3103-3109.
18. HARFORD, J., K. BRIDGES, G. ASHWELL and R.D. KLAUSNER. 1983. J. Biol. Chem. 258: 3191-3197.
19. SALZMAN, N. and F.R. MAXFIELD. 1988. J. Cell Biol. 106: 1083-1091.
Figure 1. The figure illustrates pathways taken by a 2M (a), diphtheria toxin (D), transferrin (T) and its bound iron (f), and lysosomal enzymes bearing mannose 6-phosphate (M). The receptors for a 2M (a R), transferrin (TR), and lysosomal enzymes (MR) are also shown. After binding at the cell surface and concentration in coated pits, these ligands are internalized into small vesicular and tubular "early endosomes". The ligands and receptors move to larger, more vesicular endosomes. The large endosomes include structures termed "endocytic vesicles", "receptosomes", "late endosomes" and "multivesicular bodies". The "sorting endosome" is similar to the structure termed CURL (compartment of uncoupling receptor and ligand) that was described by Geuze and coworkers in hepatoma cells.12. The late, prelysosomal endosomes" are the last organelle prior to lysosomes. Tf and the recycling receptors are resumed to the cell surface via "recycling endosomes located near the Golgi complex.

Figure 2. Illustrative model of repeated fractionations. Early endosomes containing LDL (L) and transferrin (T) fuse with sorting endosomes. In the model, the LDL distributes according to the volume between the lumen and the tubular extensions. This figure shows the distribution with 10% in the tubular extension (FL = 0.1). At the same time 50% of the transferrin is distributed into the tubular extensions (FT = 0.5). When the tubular extensions pinch off transferrin and LDL are trapped in the lumen of the sorting endosome or the recycling endosome. The figure shows that after three repetitions of this cycle, 75% of the transferrin is recycled whereas 83% of the LDL remains in the sorting endosome.

Figure 3. Histograms of endosome intensities. CHO cells, line TRVb1 were incubated with Rhodamine transferrin or DiI-labelled LDL for 2 minutes or 20 minutes at 37 °C. The brightness of individual endosomes was determined by digital image processing, and histograms of the intensity within each range were prepared. It can be seen that the amount of LDL per endosome increases approximately 40-fold while the transferrin content increases only slightly. This would be predicted from the type of process illustrated in Figure 2.

Figure 4. Ligand accumulations and recycling efficiency. The properties of sorting systems similar to that shown in Figure 2 were calculated for different values of F, the fraction of molecules contained in the tubular extension. Values of F near 0.2 produce a rapid saturation of the ligand content per endosome (A), and recycling efficiency near 90% is achieved after 40 cycles of fusion and segregation (C). This type of behavior is comparable to observations with transferrin. For F values near 0.02, large increases in the ligand concentration per endosome occur (B) and little of the ligand is recycled (D). This type of behaviour is seen with LDL.
