Export Prices
Cereal prices remain under downward pressure
|
 |
| | 2003 | 2002 | | | March | January | March | | | (US$/tonne) | |
United States | | | | | Wheat | 146 | 153 | 126 | | Maize | 105 | 106 | 90 | | Sorghum | 104 | 113 | 94 | |
Argentina | | | | | Wheat | 149 | 138 | 110 | | Maize | 95 | 102 | 85 | |
Thailand | | | | | Rice white | 198 | 203 | 195 | | Rice, broken | 144 | 151 | 149 |
* Prices refer to the monthly average. For sources see Appendix Tables A.6 and A.7.
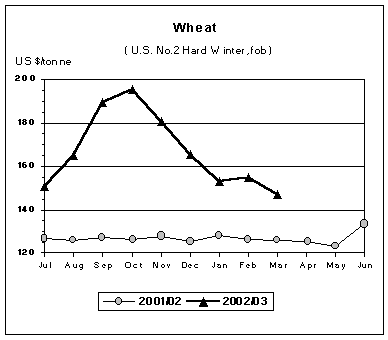 International wheat prices declined in March in view of generally favourable global crop prospects and continuing large exports from non-traditional exporters. Wheat prices surged earlier this season mostly because of droughts in Australia and Canada as well as tighter supplies in the United States. However, as the season progressed, a number of non-traditional exporting countries, including the Russian Federation, Ukraine and India, which had already emerged as relatively large exporters in the previous season, augmented their export sales due to unexpectedly large supplies. This prevented world prices from rising even more drastically. Nevertheless, since wheat supplies from most of these new origins are mostly lower-to-medium quality, international prices for higher quality wheat proved less susceptible to recent downward pressures. Thus, the U.S. wheat No. 2 (HRW, fob) averaged US$146 per tonne, down US$7 from January but still up by US$20 per tonne, or more than 16 percent, from a year ago.
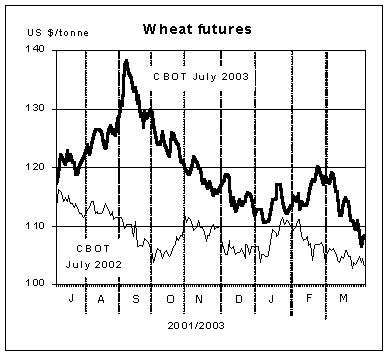 In the US futures market, wheat prices weakened considerably in recent months, especially during March, mostly in response to significant rainfalls which pointed to a possible break in near-drought conditions that prevailed for many months in major growing areas in the United States. By late March, the July 2003 futures for the soft red winter wheat contracts at the Chicago Board of Trade (CBOT) were quoted at around US$108 per tonne, representing a drop of around 20 percent since the highs in September 2002, though still up US$4 per tonne from March 2002.
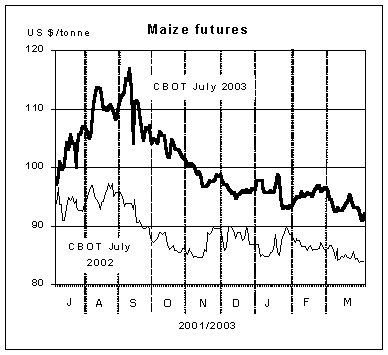
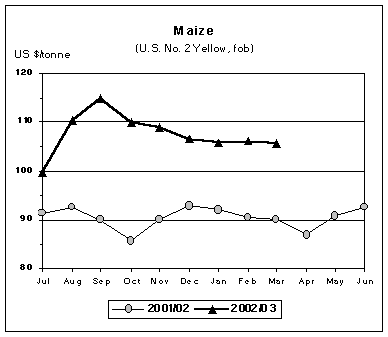 International maize prices have remained largely unchanged in recent months as downward pressure from more competitively priced low-quality wheat supplies and continuing large maize sales by China, offsetting upward price pressure from strong world import demand for maize. In March, the U.S. maize export prices (U.S. No.2 Yellow, fob) averaged US$106 per tonne, nearly unchanged from January but US$16 per tonne, or 13 percent above the previous year. By contrast, maize futures at the CBOT weakened considerably in recent weeks, mostly in response to improved weather prospects. By late March, the July futures were quoted at US$91 per tonne, up US$7 per tonne from the corresponding period last year but down nearly US$5 per tonne since January.
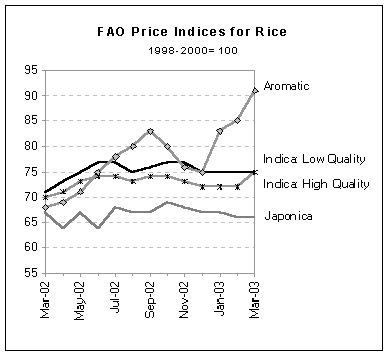
 International rice prices have moved little since the last Food Outlook, with the FAO Total Price Index (1998-2000=100) averaging 74 in March, 2 points above February and 1 point above January. The arrival of new crops in a number of markets stifled most upward pressure on prices.
Several policy developments have influenced international rice quotations since the beginning of the year. For instance, a general weakening of Thai export prices over the first weeks in March (with the exception of fragrant rice) coincided with the transition period between the close of the main crop intervention scheme at the end of February and the opening of the second crop intervention scheme on 20 March. Also, the increase in prices of rice for export by the FCI and the introduction of some restrictions that only allowed export sales from warehouses in the State of Haryana and Punjab tended to raise India’s export prices.
International prices for high quality Indica rice from different origins have moved in different directions since the last report. For example, the Thai 100% B averaged US$198 per tonne in March, down US$5 from January. By contrast, prices of the US No.2, 4% long grain staged a strong recovery from US$204 to US$257 per tonne over the same period while Viet Nam 5% quotations showed little change. The net effect of these price movements raised the FAO High Quality Indica Price Index by 3 points between January and March. By contrast, the FAO Low Quality Indica Price Index remained constant since January, as the effect of falling quotations from Thailand for 100% broken rice was offset by a strengthening of prices of 25% broken rice in Viet Nam and Pakistan. Turning to other types of rice, the FAO Japonica Price Index fell by 1 point between January and March, reflecting a further US$9 per tonne dip in prices of the US No.2, 4% medium grain. However, developments in the fragrant rice market were much more pronounced, as prices rallied in February and March, as exhibited by FAO Aromatic Price Index, which rose from 83 points in January to 91 points in March. The reasons underlying the recent strength of the Aromatic rice market are mainly related to supply constraints in Thailand and India.
 The near-term prospects for international rice prices remain highly uncertain, with the Iraq war adding even more uncertainty to the outlook. From a global perspective, available export supplies appear to be adequate to meet the expected import demand, while averting upward pressures on prices. On the other hand, the anticipated stagnation of imports to Africa and stiffer competition among exporters in markets such as Indonesia, the Philippines or the Islamic Republic of Iran but also Brazil, Iraq and Cuba, could trigger a new downward spiral of prices.
|


