

 |
 |
|
 |
||
|
|
||
|
|
|
| food outlook | |
| No. 2 | Rome, April 2003 |
|
Food Aid
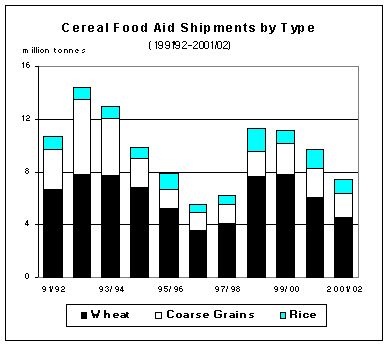
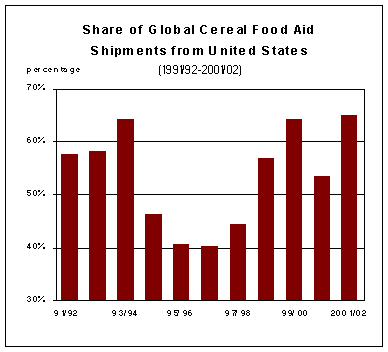
Total cereal food aid shipment in 2001/02 fell to 7.4 million tonnes, 2.3 million tonnes, or 23 percent below 2000/01 and the smallest since 1997/98 (Table 1). The decline affected nearly all regions. The overall shipments to the Low-Income Food-Deficit Countries (LIFDCs) fell to 6.3 million tonnes, down roughly 2 million tonnes from the previous season reflecting mainly smaller shipments to LIFDCs in Africa. The top 5 recipients of cereal food aid in 2001/02 were Korea, DPR (1 million tonnes), Ethiopia (560 000 tonnes), Bangladesh (452 000), Afghanistan (252 000 tonnes), and the Philippines (248 000 tonnes). The same first three countries topped the list of recipients also in 2000/01.  Regarding the major donors, shipments from the United States reached 4.8 million tonnes in 2001/02, down 400 000 tonnes from the previous season. Despite its smaller donations, the United States, was 65 percent of the world total, up considerably from 53 percent in 2000/01, essentially because other donors sharply reduced their shipments, including Australia, the EU and Japan.  Cereals - Food Aid Shipments by Destination- (July/June)
Source: WFP
Note: Totals computed from unrounded data.
Among the major cereals, wheat accounted for 4.5 million tonnes of food aid shipments in 2001/02, down 1.5 million tonnes from the previous season, but still representing over 60 percent of total cereal food aid. Coarse grain shipments totaled 1.9 million tonnes, while rice shipments reached 1 million tonnes, both also down slightly from the previous season.
Based on the latest information from WFP3/ , total food aid shipments in the form of non-cereals reached 1.5 million tonnes in 2001, up 200 000 tonnes from the previous year but well below the record of nearly 2 million tones in 1993. Pulses, vegetable oils, skimmed milk (evaporated) and sugar accounted for the bulk of non-cereal shipments. Shipments from the United States were around 1 million tonnes, representing more than 70 percent of the total. After the United States, the EU and its individual member countries were the second largest donors, with a combined shipment of about 250 000 tonnes. Other major donors included Canada and Japan, while shipments from Australia remained small and well below the average of recent years. Non Cereals - Food Aid Shipments by Destination
Source: WFP
Note: Totals computed from unrounded data.
In 2001, Pakistan was the leading destination of non-cereal food aid, at about 254 000 tonnes (mostly pulses and vegetable oils). Other major recipients included Peru, with about 82 000 tonnes (mainly vegetable oils), the Philippines, 68 000 tonnes (mostly pulses), the Russian Federation, 64 000 tonnes (vegetable oils and pulses), Uzbekistan 57 000 (only pulses) and the Korea, DPR, 55 000 tonnes (pulses, vegetable oils, and sugar). Among the non-cereals commodities, pulses accounted for the bulk of the shipments, at 778 000 tonnes, up 155 000 tonnes from 2000 but well below 1.2 million tonnes shipped in 1999. Shipments of vegetable oils also rose in 2001, to 512 000 tonnes, up 89 000 tonnes from 2000. Other non-cereals in 2001 included sugar (80 000 tonnes), milk (45 000 tonnes), meat and products (18 300 tonnes), fish and products (11 200 tonnes), and edible fats (5 500 tonnes). Non Cereals - Food Aid Shipments by Type
Source: WFP
Note: Totals computed from unrounded data.
Total cereal food aid shipments in 2002/03 (July/June) could remain at the 2001/02 level of around 7.4 million tonnes (in grain equivalent) 4/. Shipments from the United States are forecast to remain large, albeit smaller than in the previous season in view of higher international prices and tighter domestic wheat supplies. Shipments from most other major donors are also anticipated to decline slightly. By contrast, India is seen to emerge as an important food aid donor in 2002/03. In December 2002, India pledged 1 million tonnes of wheat to the United Nations. This was initially targeted for Afghanistan but later expanded to cover other regions, including famine-stricken countries in southern Africa. Besides India, a number of other non-regular donor countries had also stepped up their pledges, including China, Oman, the Republic of South Africa and the Russian Federation.
According to WFP, emergency needs in 2003 continue to grow the fastest in light of worsening food problems in many countries across the globe. In 2003, the requirements for Protracted Relief and Recovery Operations (PRROs) are also expected to be at much higher levels than in 2002. As of early March 2003, the projected needs for all WFP-assisted development projects and relief operations were estimated at about 5.3 million tonnes. With as many as 36 WFP-assisted operations worldwide, this year’s requirements are forecast at 1.86 million tonnes, up substantially from 1.21 million tonnes in 2002. By contrast, total estimated food aid needs for approved and planned development projects in 2003 amount to roughly 846 000 tonnes, which would be 30 percent smaller than the requirements in 2002. Confirmed contribution to WFP totaled US$1.808 billion by March 2003. This amount represented the second-highest level of contributions received by WFP. However, even this high level of support came short of meeting WFP's operational requirements to assist people facing food crises. Only three-quarters of the US$2.415 billion required was committed in new contributions. Of the total contributions, a record US$1.049 billion was received for emergency operations, plus US$13 million for the Immediate Response Account, which met 76 percent of the cash requirements approved for emergency operations. Support for PRROs remained high, with 96 percent of needs met by the US$470 million contributed by donors.
In December 2002, the Food Aid Committee (FAC) extended by one year the Food Aid Convention 1999, from July 2002 to June 2003. The Committee also agreed, in principle, that the Convention be further extended for two more years, pending confirmation by the Committee during its next meeting in June 2003. According to the FAC, as of December 2002, total food aid shipments in 2001/02 (in wheat equivalent) 5/, were estimated at around 10 million tonnes, slightly below the level in 2000/01. Nearly 70 percent of total shipments were in the form of cereals or cereal products. Total shipments in 2001/02 were still above the members’ combined minimum annual commitments of over 5 million tonnes. More than 3.5 million tonnes of Members’ aid were channeled multilaterally, mainly through the WFP.
The United States is the largest food aid donor and the P.L. 480 Title II is the principal mechanism for direct donation of agricultural commodities for emergency relief and development through WFP and private voluntary organizations 6/. For the fiscal year 2003 (October-September) 7/3/, the legislative authorities in the United States allocated about US$1.18 billion for food assistance under P.L. 480 Title II, up from roughly US$959 million in fiscal year 2002. Nearly half of the allocated amount is designated for emergency situations. In spite of higher allocated spending, however, the amount of food aid in terms of tonnage under this Programme could still fall below the previous year’s level because of the increase in food commodity prices during the first half of the 2003 fiscal year. Under the fiscal year 2004 budget request, announced in February 2003, the food assistance budget allocated to P.L. 480 is requested to be kept unchanged, at US$1.8 billion. However, a new fund, named the Famine Fund, has also been proposed which, if approved, would authorize the release of an additional US$200 million for food emergencies. This commitment, according to official sources, would reflect the largest increases in programmes in the proposed 2004 budget and would represent a 15 percent expansion in the overall food assistance (in monetary terms) by the United States. 1. More detailed statistics on cereal and non-cereal food aid shipments are available on the Internet as part of the FAO World Wide Web at the following URL address: http://www.fao.org under Statistical Database and then All Databases 2. While cereal shipments are reported on a July/June basis, non-cereals food aid is reported on a calendar year basis. 3. As of February 2003 4. Processed and blended cereals are converted into their grain equivalent to facilitate comparisons between deliveries of different commodities. Under the FAC rules, all food aid contributions are evaluated and counted in terms of their commercial value relative to wheat, i.e. “in wheat equivalent”.
6. Title II of the Agricultural Trade Development and Assistance Act of 1954 (Public Law 480, also known as “Food for Peace”) is requested by the Department of Agriculture and administrated by USAID. 7. The fiscal year 2003 in the United States covers the fiscal year beginning October 1, 2002. |
||||||||||||||||||||||||||||||||||||||||||||||||||||||||||||||||||||||||||||||||||||||||||||||||||||||||||||||||||||||||||||||||||||||||||||||||||||||||||||||||||||||||||||||||||||||||||||||||||||||||||||||||||||||||||||||||||||||||||||||||||||||||||||||||||||||||||||||||||||||||||||||||||||||||||||||||||||||||||||||||||||||||||||||||||||||||||||||||||