

 |
 |
|
 |
||
|
|
||
|
|
|
| food outlook | |
| No. 2 | Rome, April 2003 |
|
Cereal Import Bills
The overall cost of purchasing cereals from world markets in 2002/03 is expected to rise to US$39 billion, up US$6 billion, or 20 percent, from the previous season and the highest since 1996/97. Considering that world cereal trade volume is likely to fall this season and food aid, in terms of cereals, to remain unchanged at the previous season’s level, the main reason for this sharp increase is the rise in world cereal prices. Trends in Cereal Import Bills 1/
Note: Totals computed from unrounded data.
1/ The Same countries may appear in more than one special country grouping. For definitions of country groupings see the Statistical Note on the last page of this report.
2/ Based on the per unit cost of total imports.
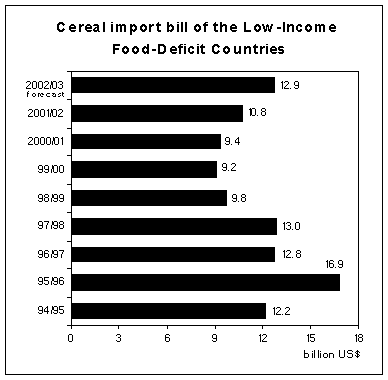
The cereal import bill of the developing countries could increase by nearly US$5 billion to US$28 billion, representing nearly 73 percent of the world total. In the Low Income Food Deficit Countries (LIFDCs), cereal imports are forecast to approach 79 million tonnes, nearly the same as in the previous season. However, with prices much higher, specifically wheat and maize prices, the cereal import bill of the LIFDCs is expected to increase by almost US$2 billion in 2002/03 to a 5-year high of around US 13 billion. The cost of wheat purchases by LIFDCs would be highest compared to other major cereals; approaching US$7 billion, up 29 percent from 2001/02. Also for coarse grains, the cost is seen to increase by 22 percent to roughly US$3 billion, while for rice there is a possibility of a slight decline, to about US$2.7 billion, reflecting a small decline in the volume of imports and more subdued rice prices this season.  As for the Least-Developed Countries (LDCs) and the Net-Food Importing Developing Countries (NFIDCs) categories, which include a list of countries agreed by the World Trade Organization (WTO) to qualify as beneficiaries under the “Marrakesh Decision on the Possible Negative Effects of the Reform Programme on Least-Developed and Net-Food Importing Developing Countries”, their combined cereal import bill in 2002/03 is forecast to reach US$8.6 billion, up nearly US$2 billion from 2001/02. This represents a change in direction from the last 3-4 years when total cereal import bills of LDCs and NFIDCs stood closer to US$6 billion. The increase in their cereal import bill in 2002/03 would be due to both quantity and price factors. The volume of their cereal imports is forecast to increase modestly, by some 1.2 million tonnes, while the price hikes are seen as more pronounced, particularly for wheat, which between July 2002 and March 2003 rose by some 30 percent compared to the previous season. Export subsidies or even credits appear to be of limited importance to LDCs and NFIDCs this season. The largest exporter, United States, is not using grain export subsidies. The EU exported wheat with little or no restitutions (subsidies) during the first half of the current marketing season, but with the Euro gaining ground against all the major currencies, including the US dollar, higher restitutions may be needed in the coming months. Other major grain exporters, such as Canada and Australia, have had less reason to resort to credits to promote sales this season, in view of their own tight supplies caused by drought-reduced production. Cereal food aid shipments to LDCs and NFIDCs in 2002/03 are expected to remain close to the level reached during 2001/02. Food aid continues to be a very important source of supply for LDCs, accounting for about 16 percent of their total cereal imports this season, though considerably less than in earlier years. In the case of the NFIDCs, food aid in cereals is less important, accounting for about 2 percent of their total cereal imports, which is slightly below the average of the past decade. Changes in Cereal Import Bill of LIFDCs by Region and Commodity
1. For definitions of the special country and economic grouping see Statistical Note on the last page of this report. |
||||||||||||||||||||||||||||||||||||||||||||||||||||||||||||||||||||||||||||||||||||||||||||||||||||||||||||||||||||||||||||||||||||||||||||||||||||||||||||||||||||||||||||||||||||||||||||||||||||||||||||||||||||||||||||||||||||||||||||||||||||||||||||||||||||||||||||||||||||||||||||||||||||||||||||||||||||||||||||||||||||||||||||||||||||||||||||||||||||||||||||||||