Access
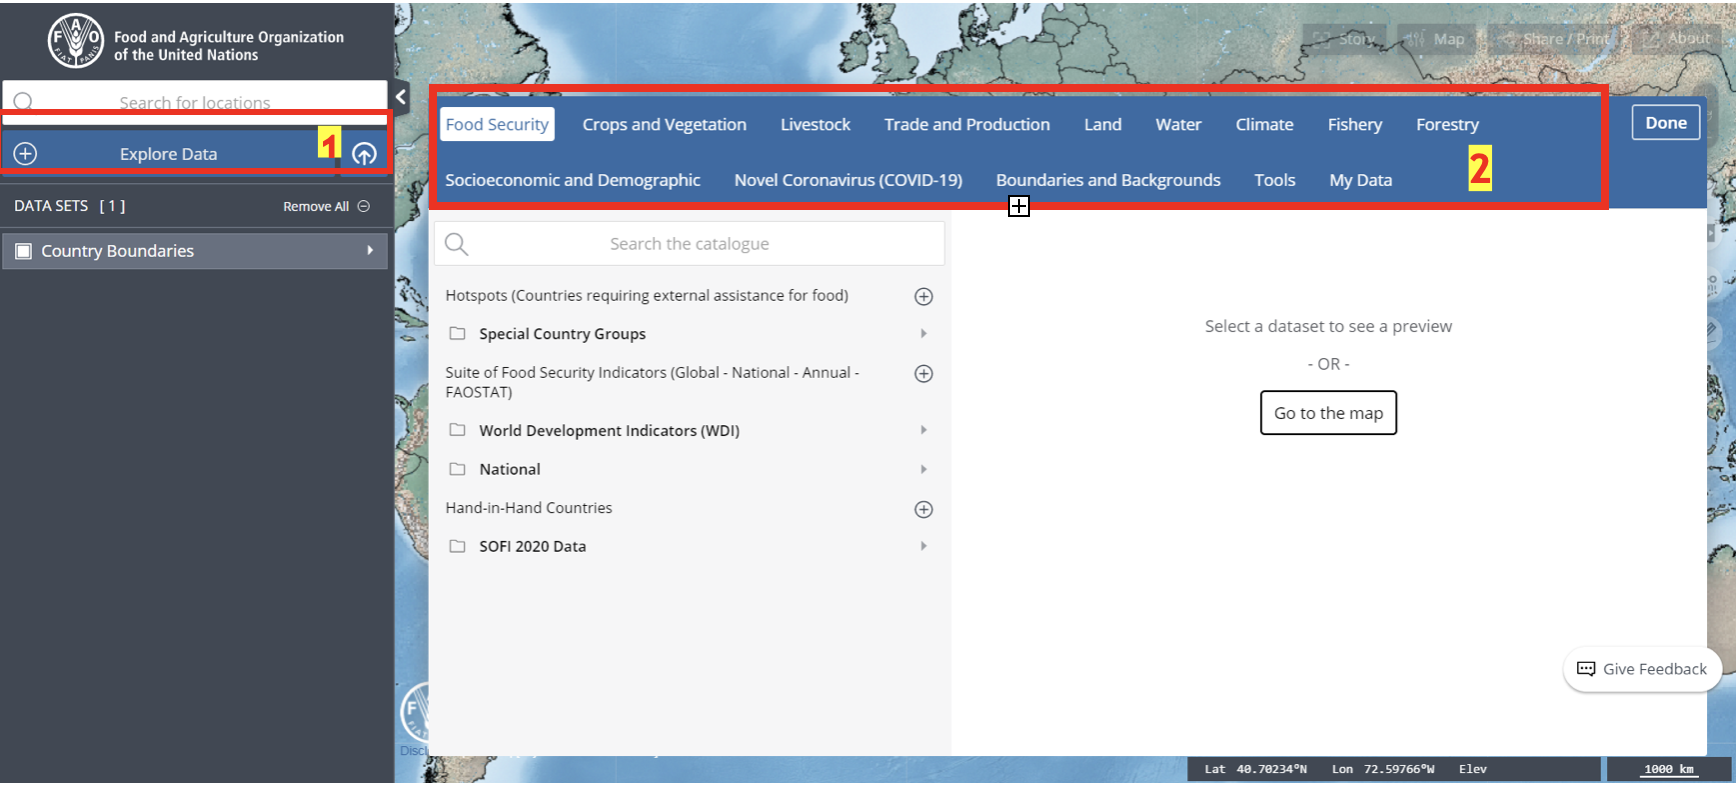
When you first access the Platform, you will see the below screen from where you will be able to access and start exploring the platform and its sound features.
- Explore Data – click this button to access the data catalogue;
- Data Catalogue - categorized list of domains will allow to browse and apply data layers and datasets to the visualized map.
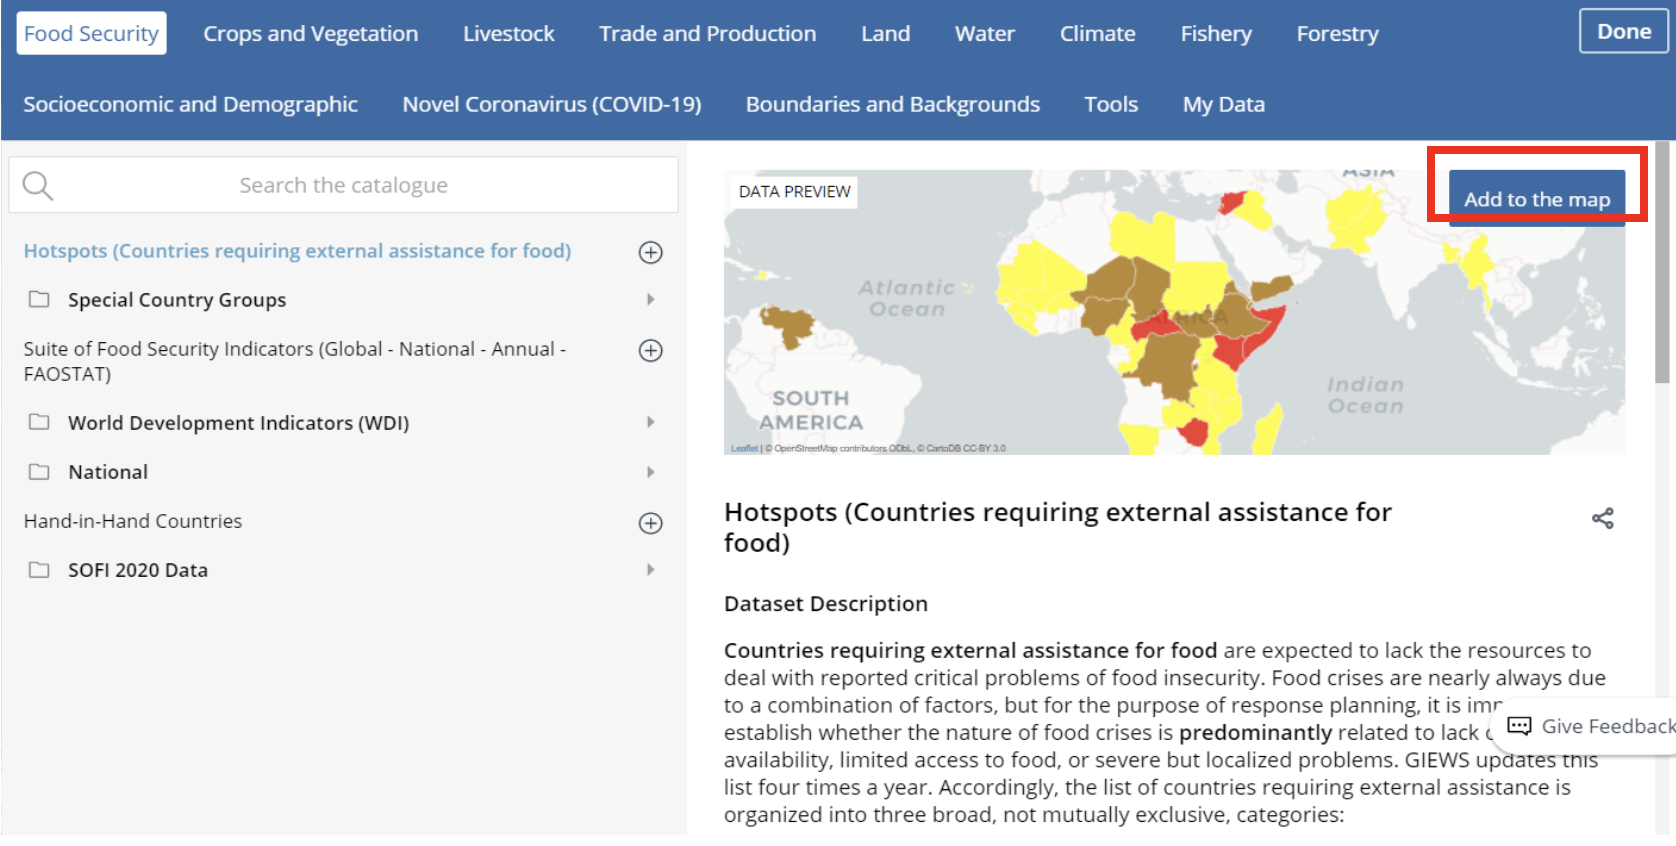
Data Catalogue
To view a data catalogue and related data set:
- Click on a data set of interest
- You will then be able to see its corresponding description
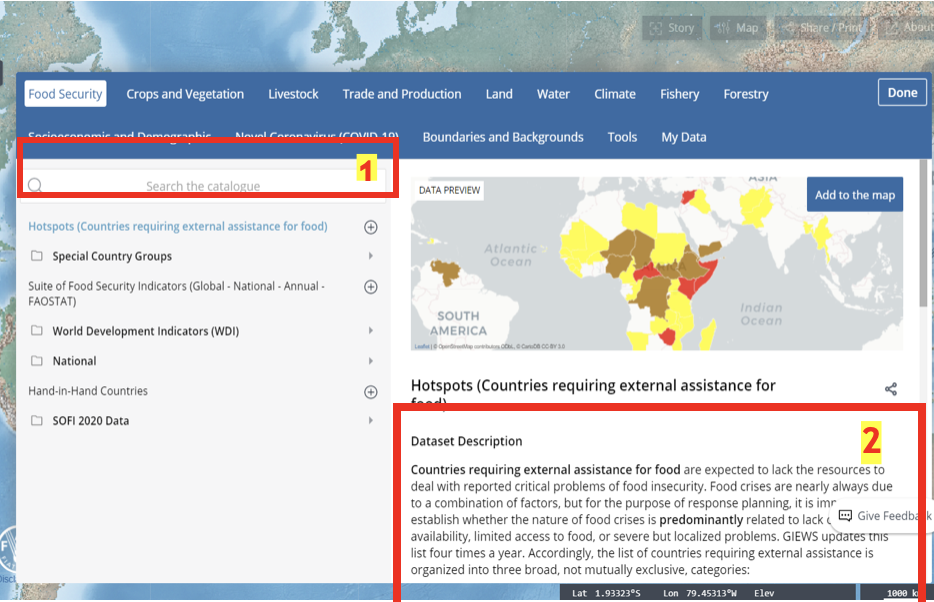
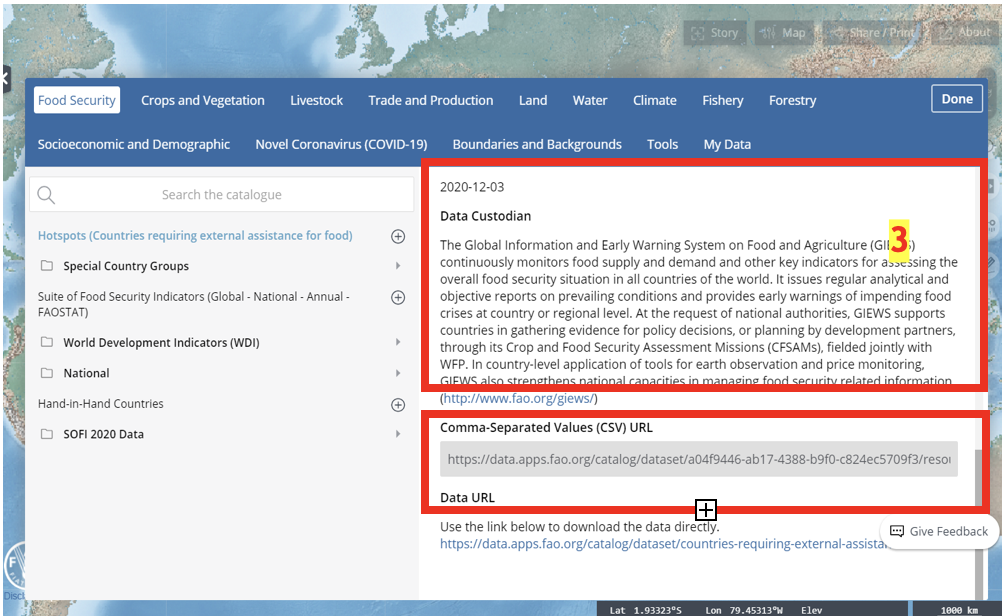
- View useful information, including the custodian
- See links to the data catalogue and reference to the source
Viewing Dataset
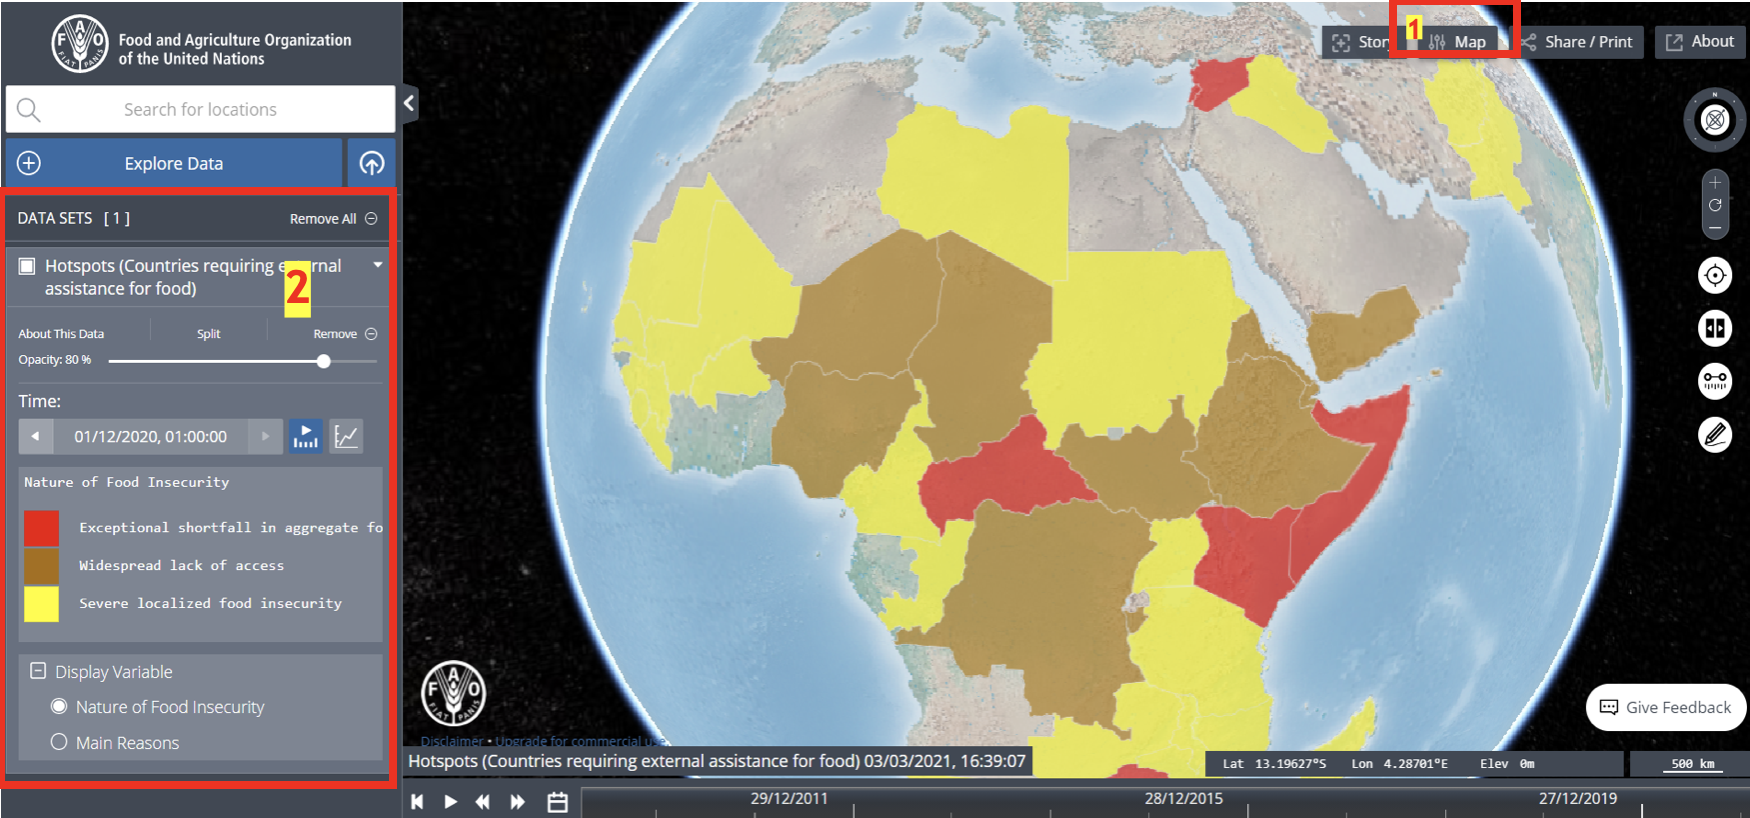
Once your added data set is reflected into the map, you can easily customize your search by applying multiple features, parameters to suit your needs such as:
- Map View - change from 2D to 3D Terrain, modify the type of overlay, apply image optimization and regulate Raster Map Quality.
- Workbench with Legends – helps you refine your search criteria for the added datasets by adjusting the opacity of the colors, selecting the time-frame, changing the variables, among others.
Applying Dataset
If you wish to reflect and visualize your selected Data set into the map, you will need to click on the Add to the Map button:
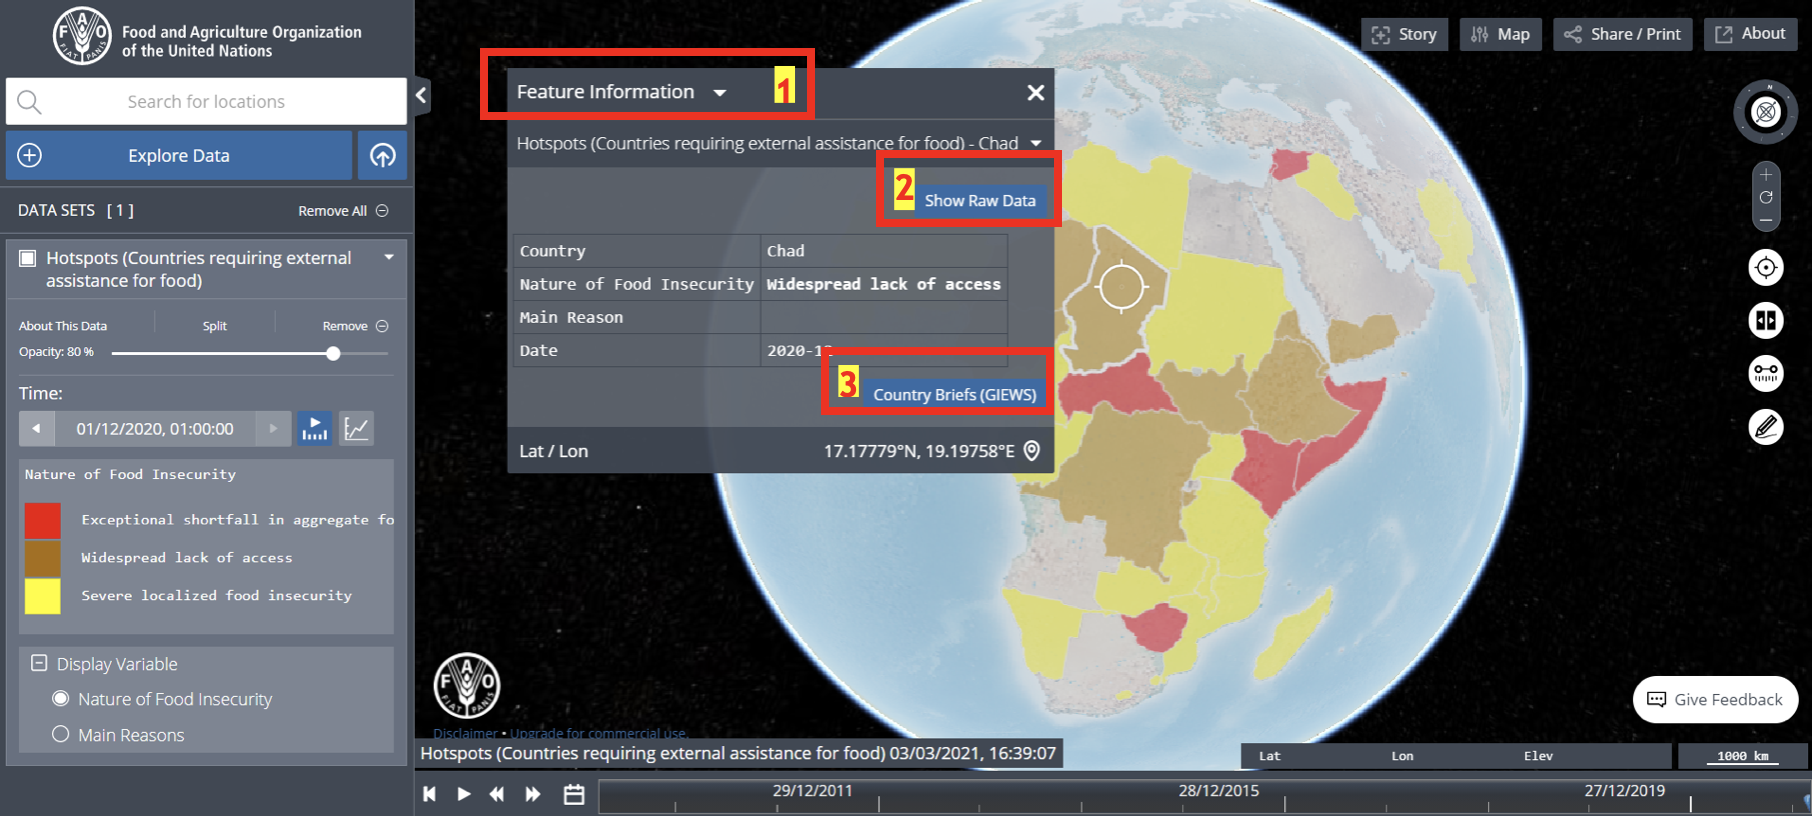
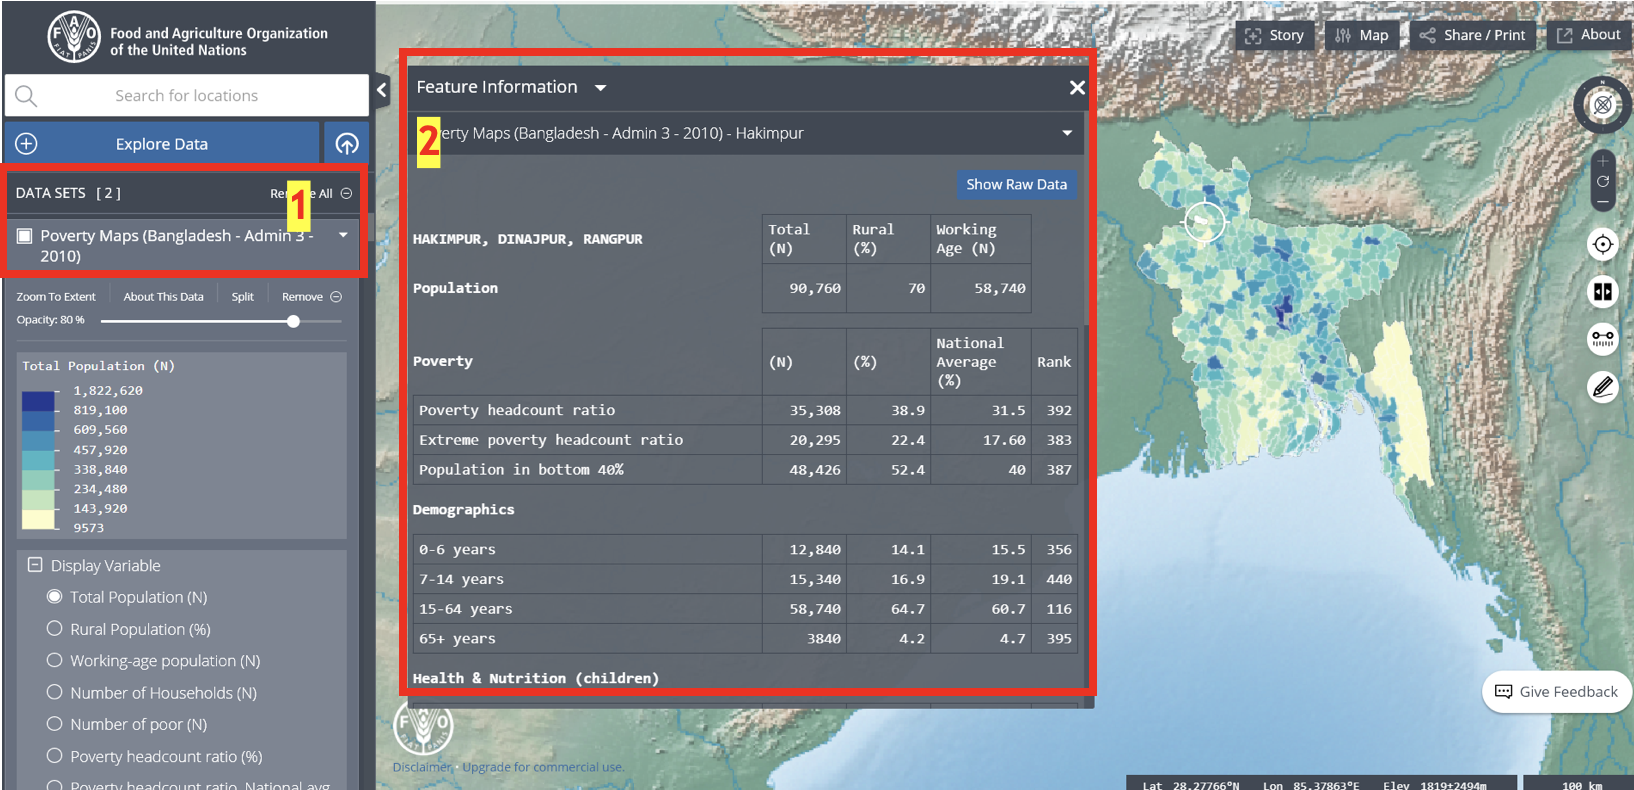
Feature Information
Clicking on any country in the map will provide specific information about a country such as nature of food insecurity, latitude and longitude:
- Feature Information
- Show Raw Data
- Country Briefs
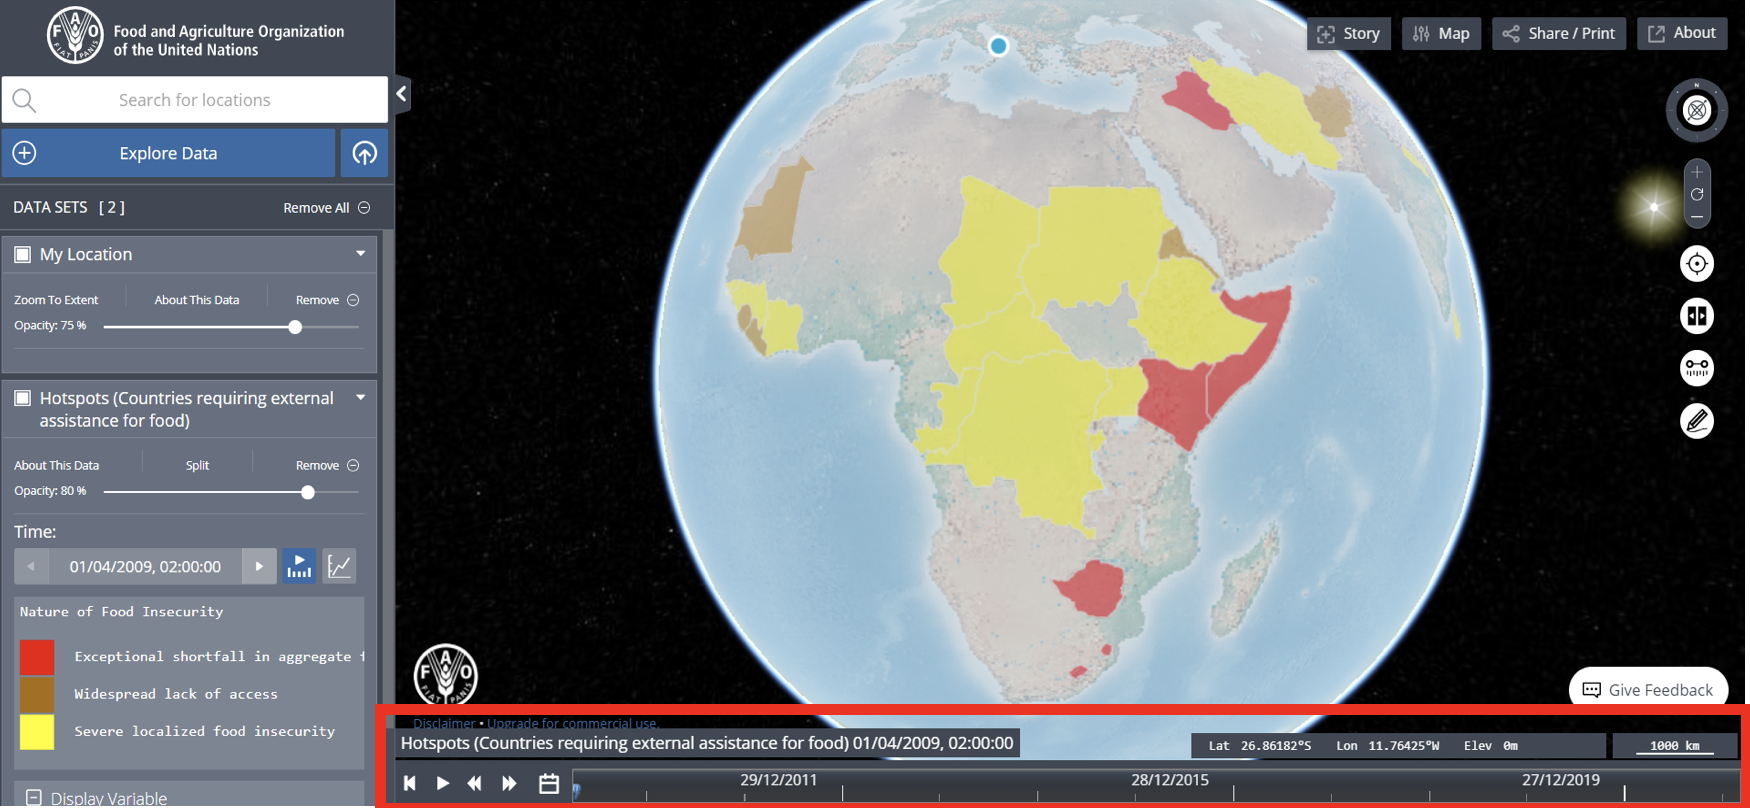
Feature Adjustment
The slider below allows you to see the change dynamics over time for the selected data set. It can be displayed either by clicking the Play button – to see the chronological change, moving the slider manually, or by setting a fixed time-frame.
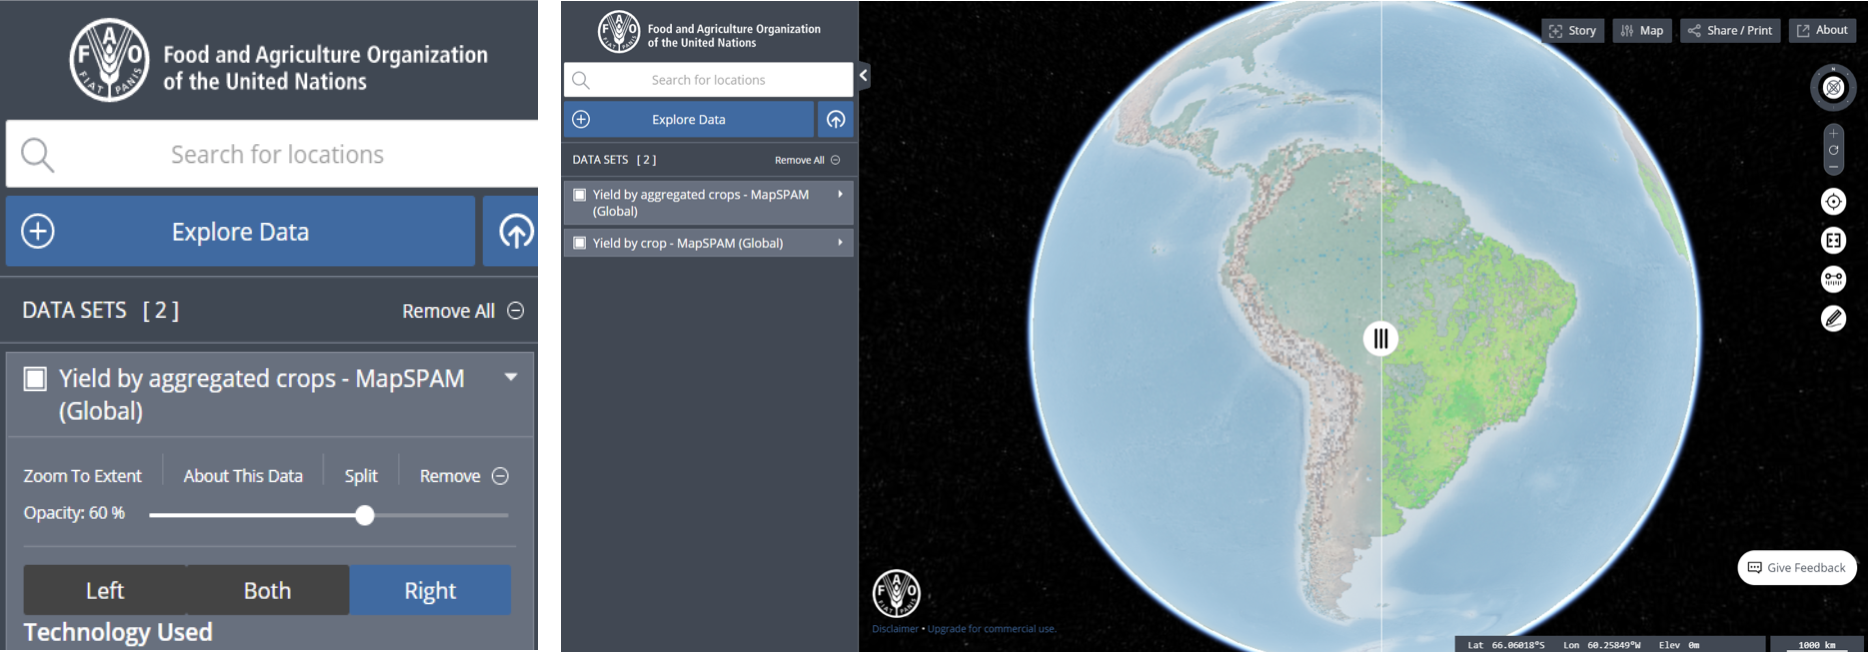
Compare Datasets
The 'Split' Function
After adding two or more datasets to the map, you will be able to see a comparison between the datasets visualized in the map:
- Split - click on this button after adding your to-be compared datasets
- Click on a data set to select right or left, to set the comparison
- Cursor - move the cursor to the right and left to visualize the comparison.
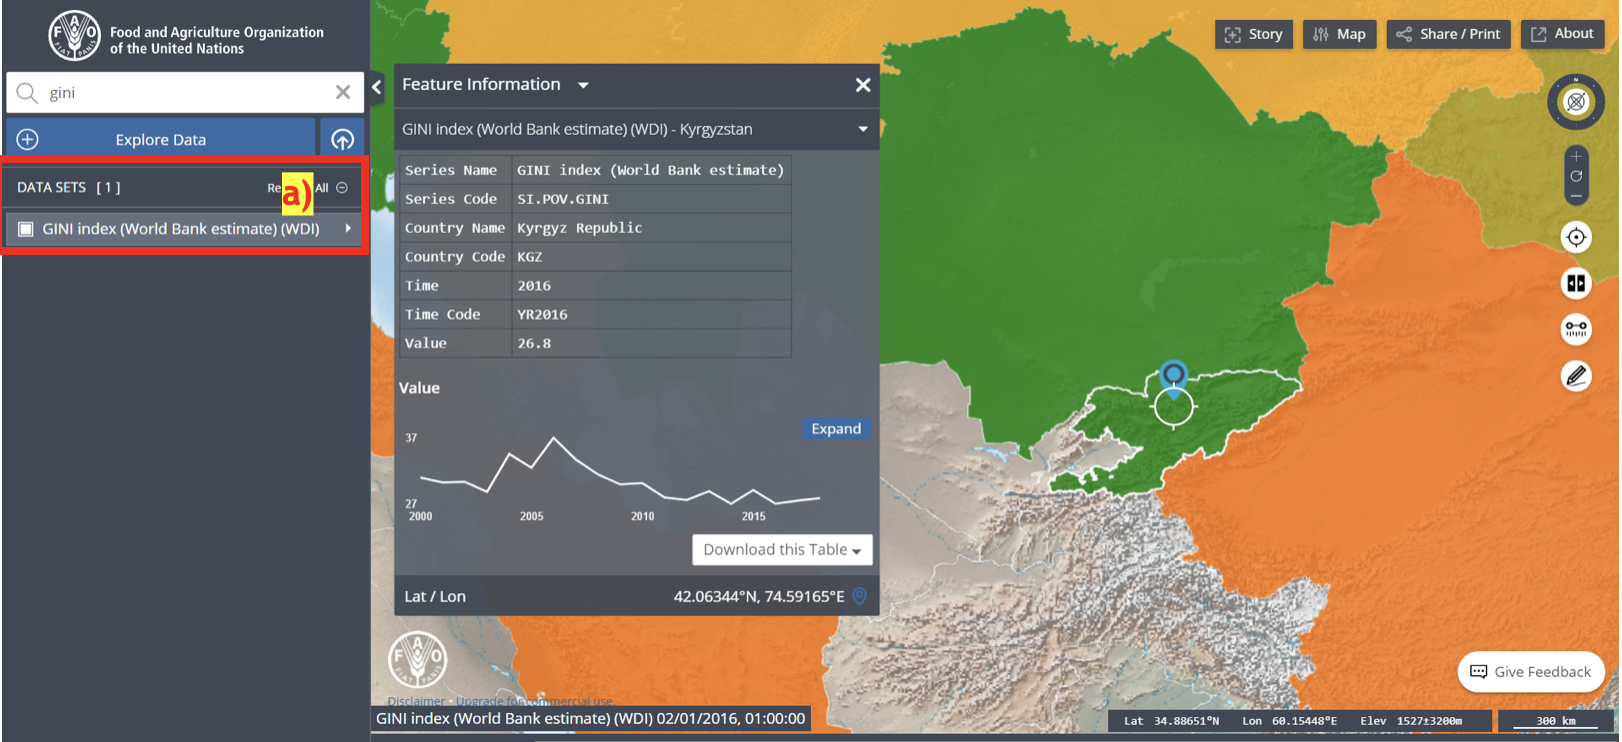
Compare External Data
The Platform also contains wealth amount of data from leading external agencies with data collection capabilities. This helps facilitate generation and comparison of cutting-edge maps with cross-sectoral data, thus, prompting a solid analysis of agriculture-related maps from various perspectives.
Example :
- Added GINI index (World Bank dataset )
- With a selected country in the map
- Features information from external dataset
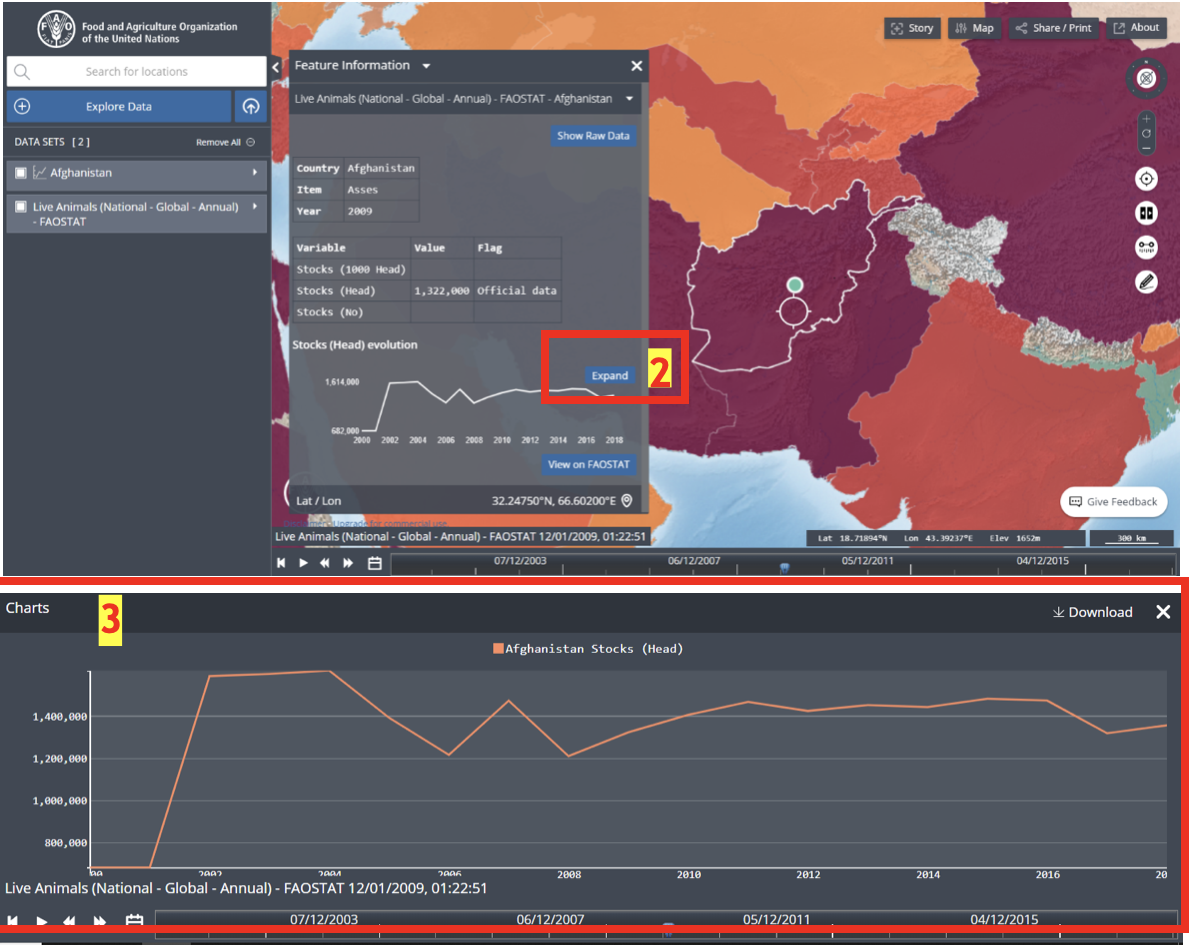
Viewing FAOSTAT
In addition to its massive data catalogue, the Platform pulls data directly from FAOSTAT by generating near real-time analytical charts and tables with time-series:
- Select Datasets of interest from the Explore Data catalogue
- Click Expand from Feature box
- You will see the time-series Chart for analysis.
Adding Data
With the use of Database of Global Administrative Areas (GADM) for sub-national boundaries, the Platform integrates publicly available national data. To add your private data of sensitive nature, click:
1) Explore Data > 2) My Data > 3) Upload your data using preferred method and format: 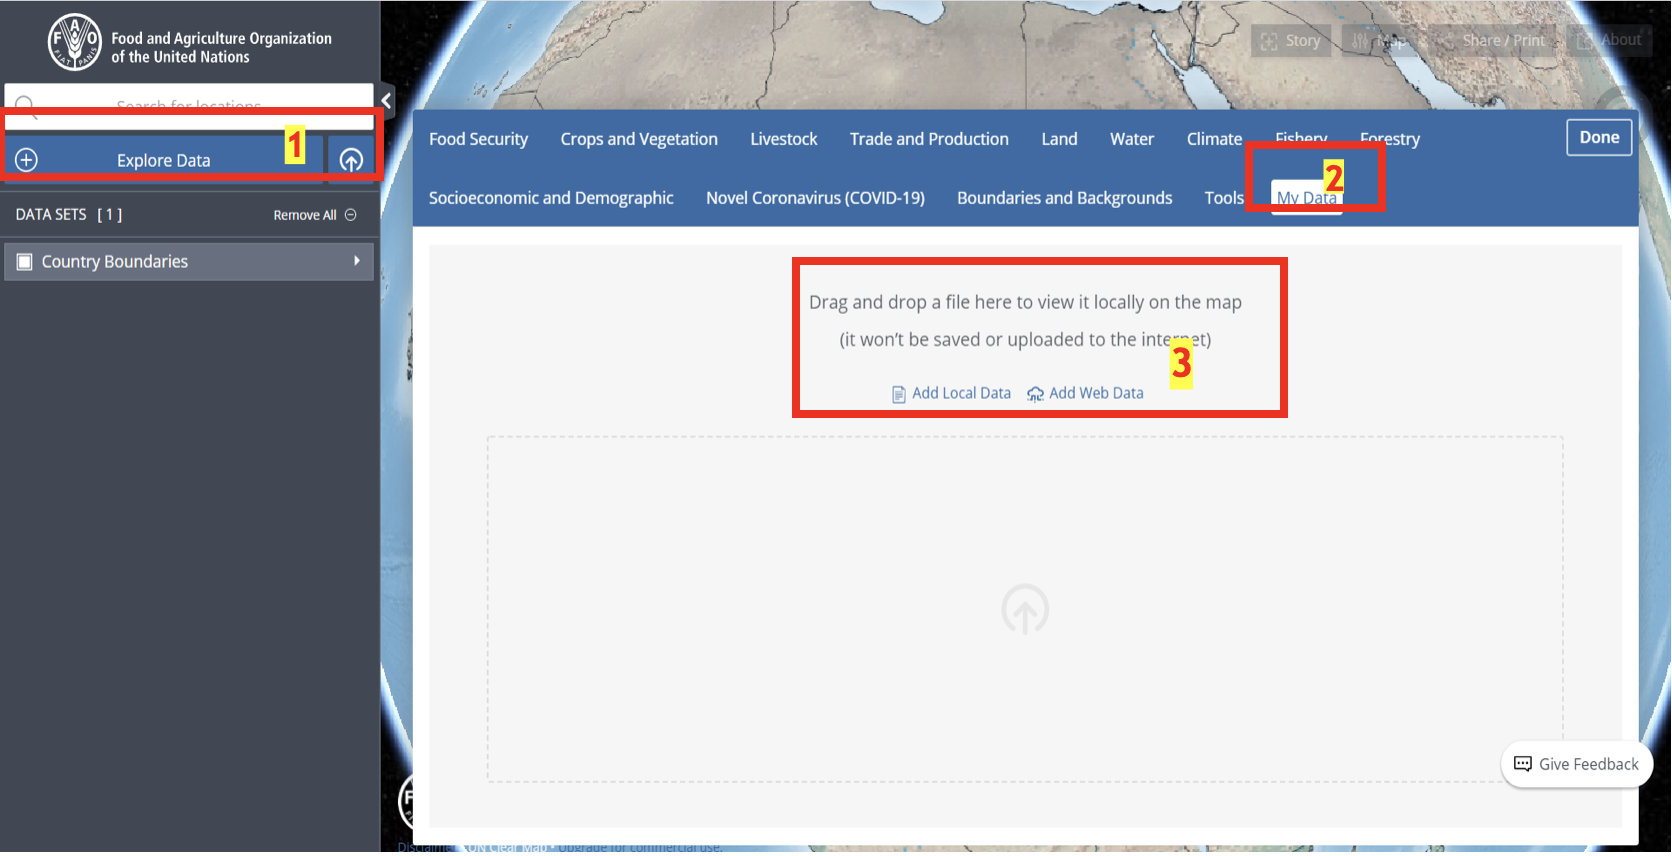
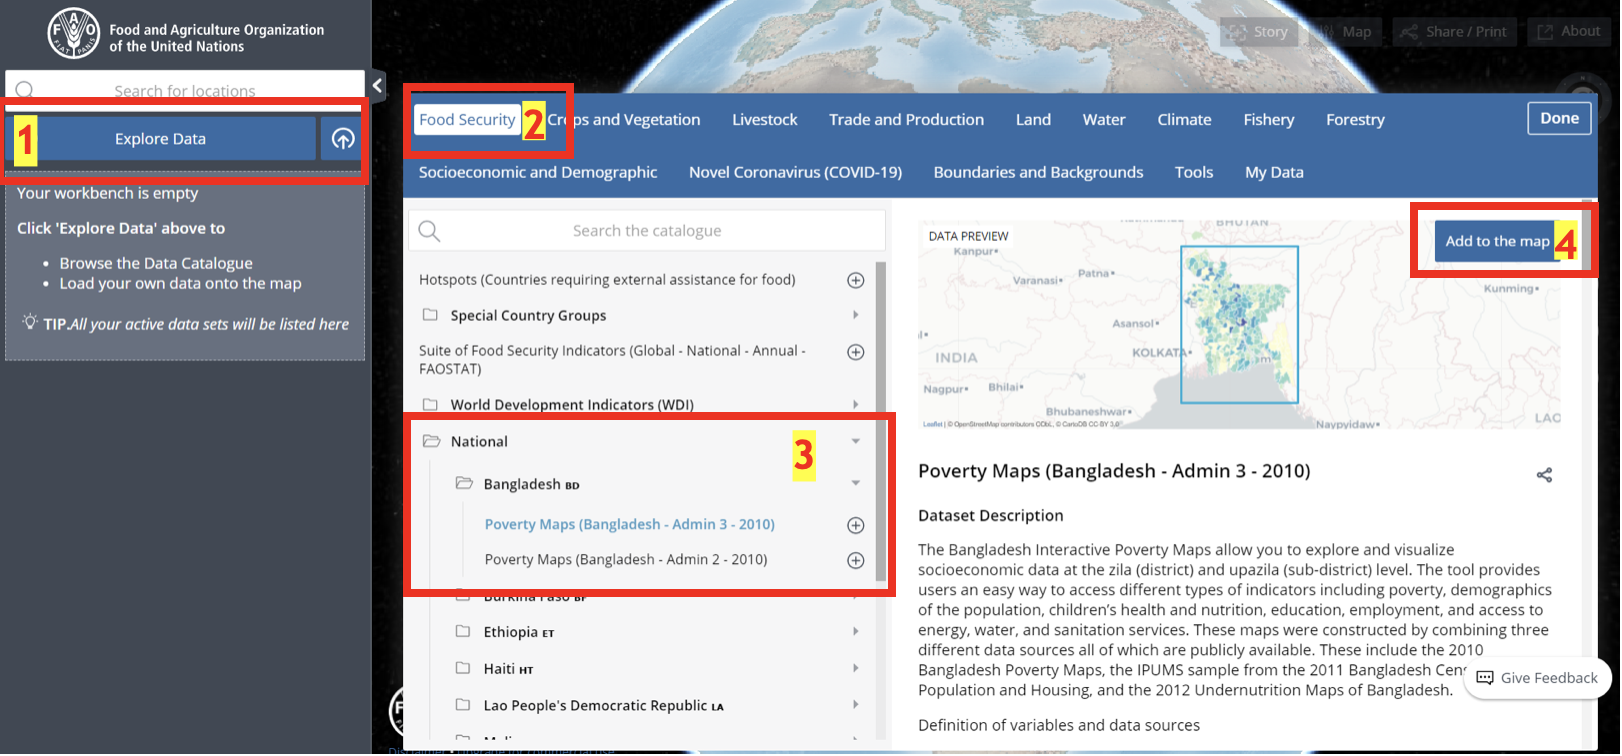
National Data
Adding a national and sub-national data at different admin levels helps you view a more localized information. This will ensure the accuracy of information and help generate solid country reports.
A more localized and accurate data at different admin levels looks as demonstrated in the below example: 1. Explore Data > 2. Food Security > 3. National (select country of interest) > 4. Add to the Map
Viewing National Data
Adding the National Data set to the Map (1) will Feature Information (2) and provide comprehensive data for analysis both on national and sub-national levels:
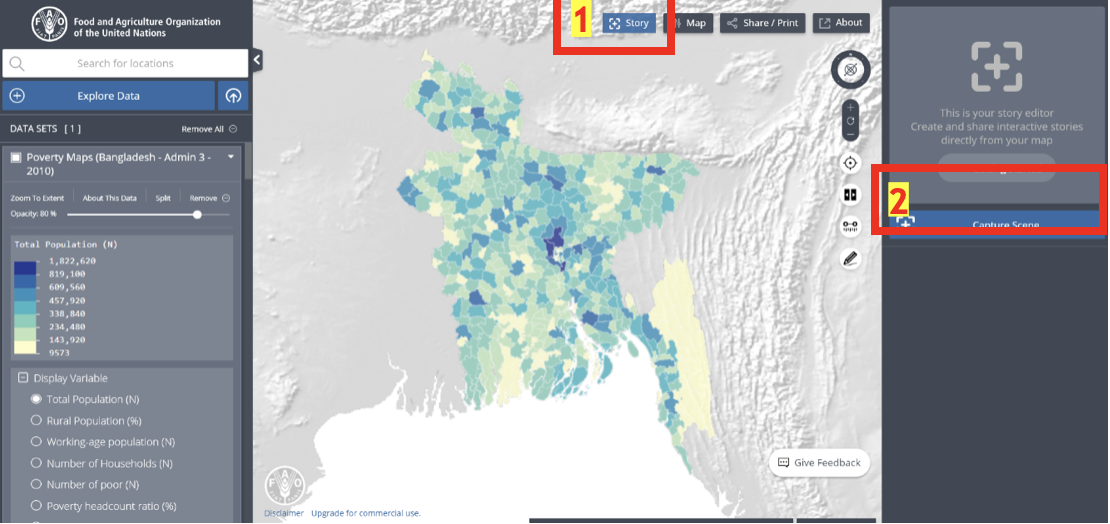
Add Impact Story
The Platform´s 'Story' functionality allows you to create interactive stories within the map, and then create and share your case:
- Select Story once the data set is reflected into the Map
- Click Capture Scene on a selected area of interest
- Type in the corresponding Title and Description to your story, and then click on the Save button
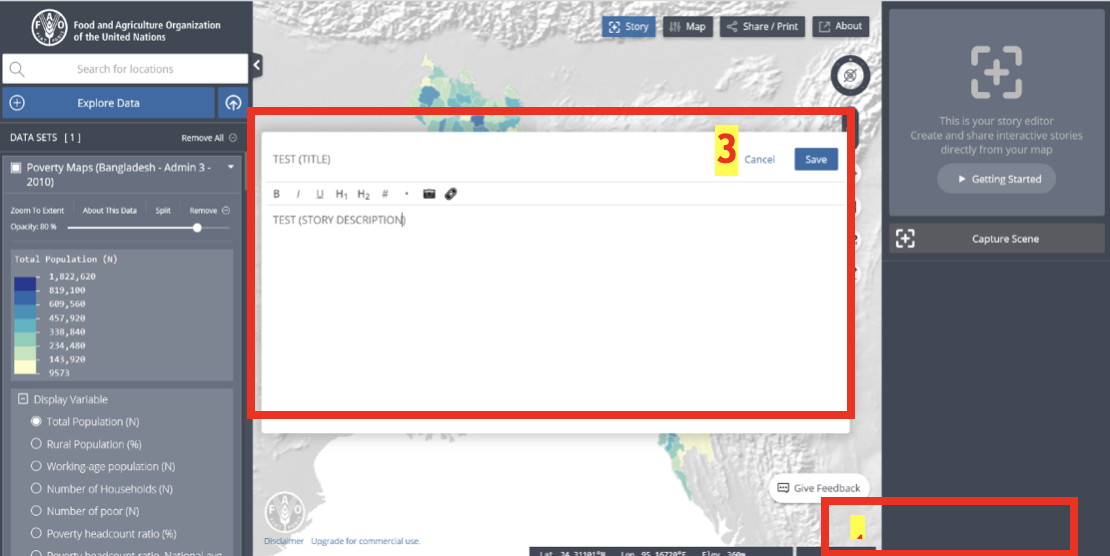
- After saving the Story, click on the Play Story button
- You should then be able to see your created data-map story and share it online or print it.
FAOSTAT provides free access to food and agriculture data for over 245 countries and territories and covers all FAO regional groupings from 1961 to the most recent year available.