
Guidelines
I&V assessments illustrate the types of impacts that have been and are likely to be experienced by vulnerable units in the system. The stages of the I&V assessment answer the sequence of questions that ultimately lead to the definition of how vulnerability could be addressed to mitigate the impacts.
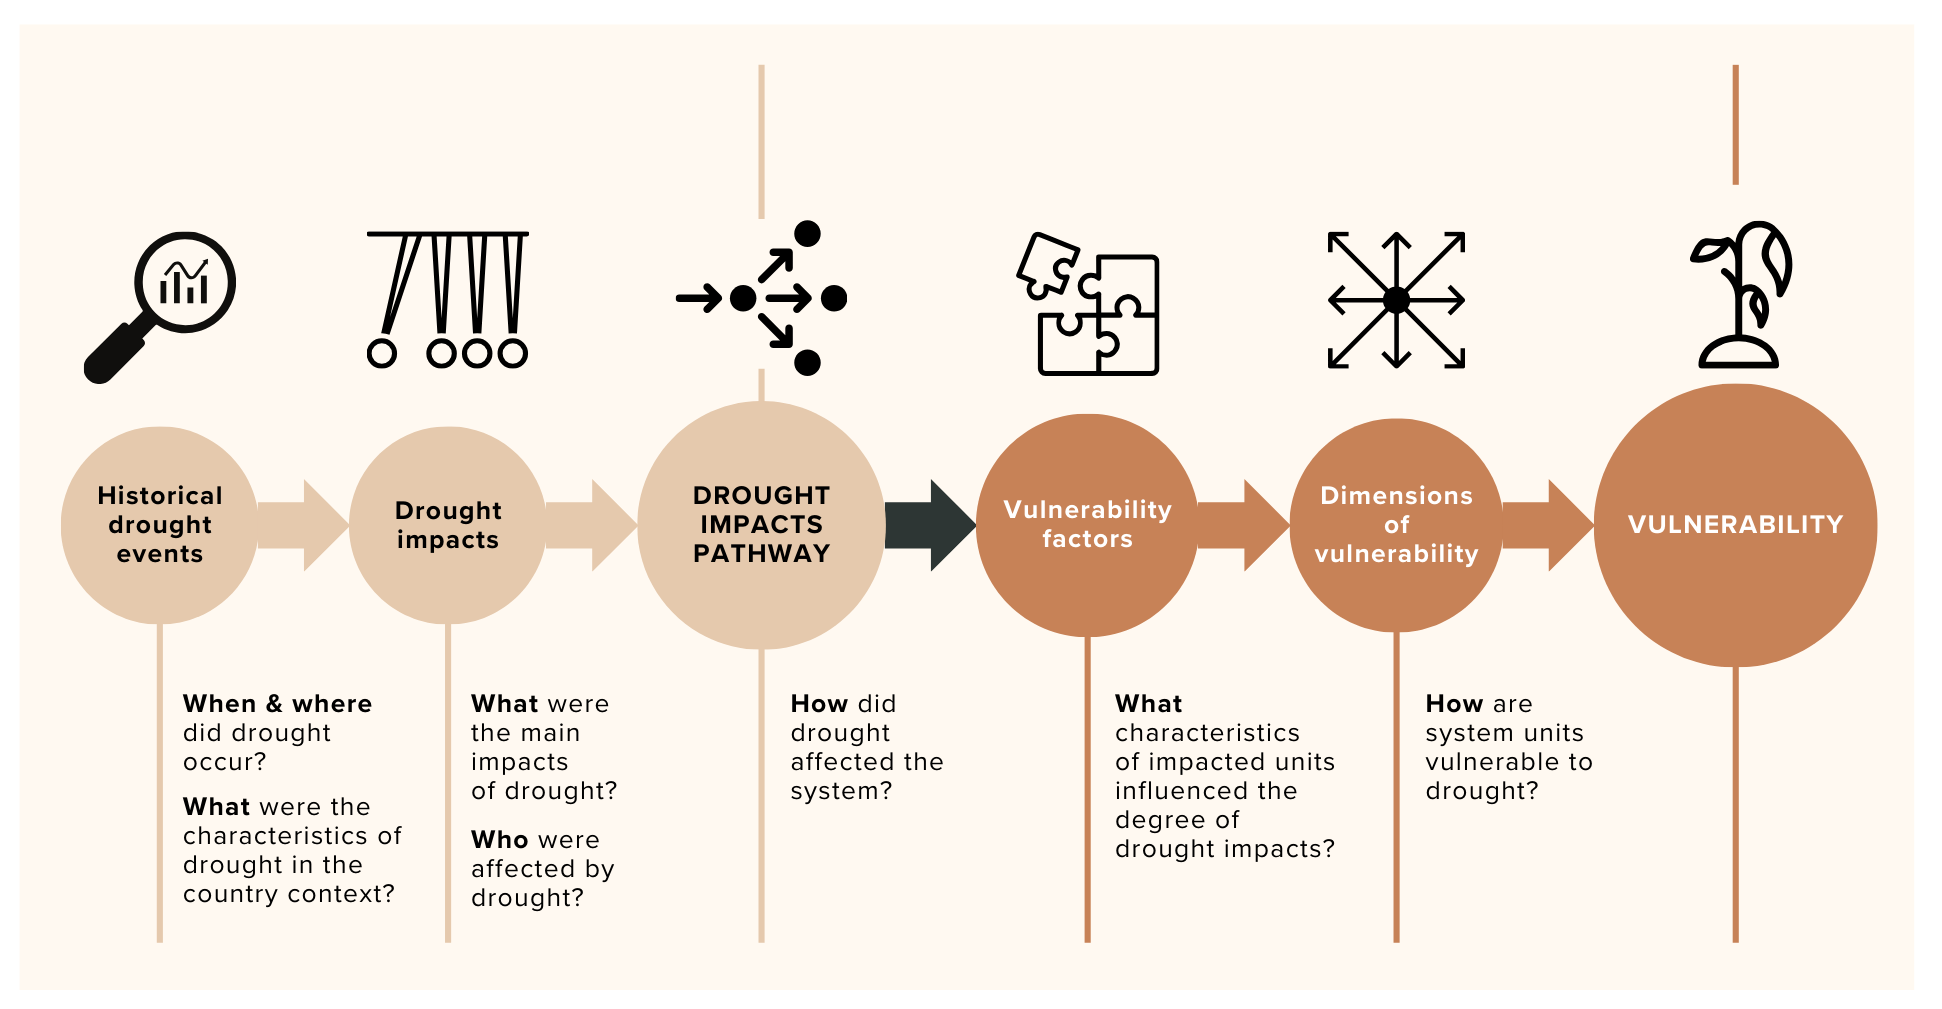
HISTORICAL DROUGHT EVENTS – The first stage in the I&V assessment entails understanding the drought hazard. The types, characteristics, and properties of the drought events that the country experienced are explored, as well as the areas where drought occurred. Historical information on drought events is the springboard for data collection. The activity can begin with listing the drought events in the country, from the earliest to the most recent records. The collection of data can be guided by the questions:
- When and where did drought occur?
- What were the characteristics of the drought events that occurred in the country?
DROUGHT IMPACTS – This stage aims to improve the understanding of the extent of damages and losses experienced from the various types and intensities of droughts that occurred. Even though future drought events may differ from past experiences, the analysis sets a baseline for possible future drought impacts. The collection and analysis of data should answer the following questions:
- What were the main impacts of drought?
- Where were the impacts of drought experienced?
- Who was affected by drought?
The economic, social, and environmental losses and damages recorded in each identified drought event should be collected and analyzed. Some drought impacts are not readily observed and should be teased out from various datasets. In this case, annual data covering the drought and non-drought years for various indicators that can represent the economic, social, and environmental characteristics of the country can be collected.
Covering both drought and non-drought years is important to determine whether there are changes in the values of the indicators during the periods when droughts were reported. This activity is an exploration of drought impacts through system linkages. It is an iterative process, repeated until drought impacts are teased out from various datasets. The exercise also helps in determining the drought impact pathway. This early in the process, gender considerations, especially concerning social impacts and, to some extent, economic impacts, must be given attention.
DROUGHT IMPACT PATHWAY – Generating drought impact pathways entails the analysis of notable data points, comparing significant events or scenarios, and identifying system linkages. Conducting such analyses will answer the question “How did drought affect the system?” Drought impact pathways or the causal chains of drought impacts are a series of drought impacts and their knock-on effects on different groups, areas, or sectors created through interconnections of industries or parts and units comprising the system. Information on the drought impact pathways can be demonstrated through flow diagrams, concept mapping, or systems mapping. The concept of drought impact pathway is similar to the indirect cost of inaction presented in the Economic assessment of drought risk management publication of FAO.
Drought impact pathway from the reduction in wheat production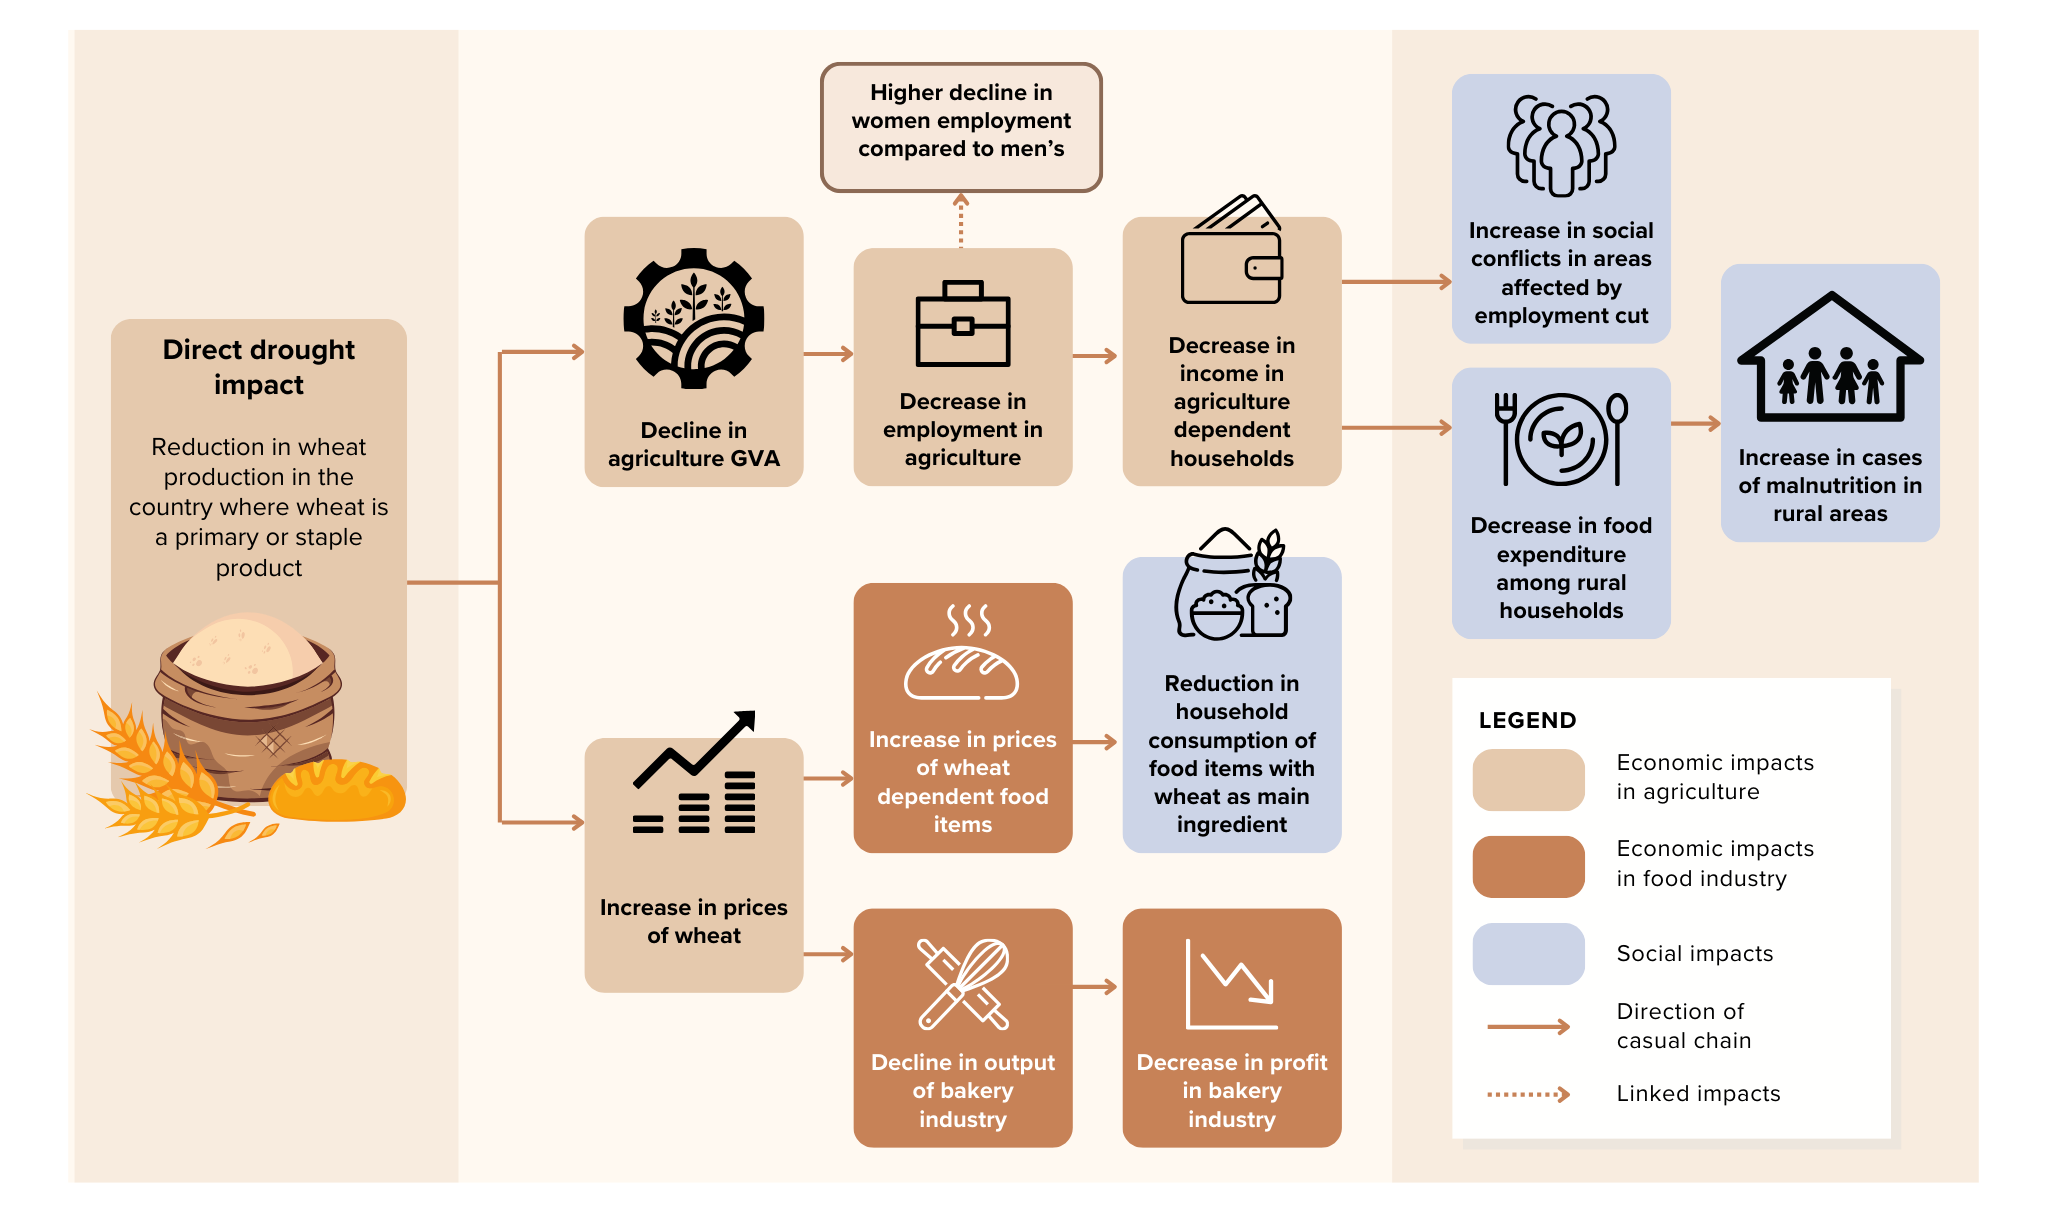
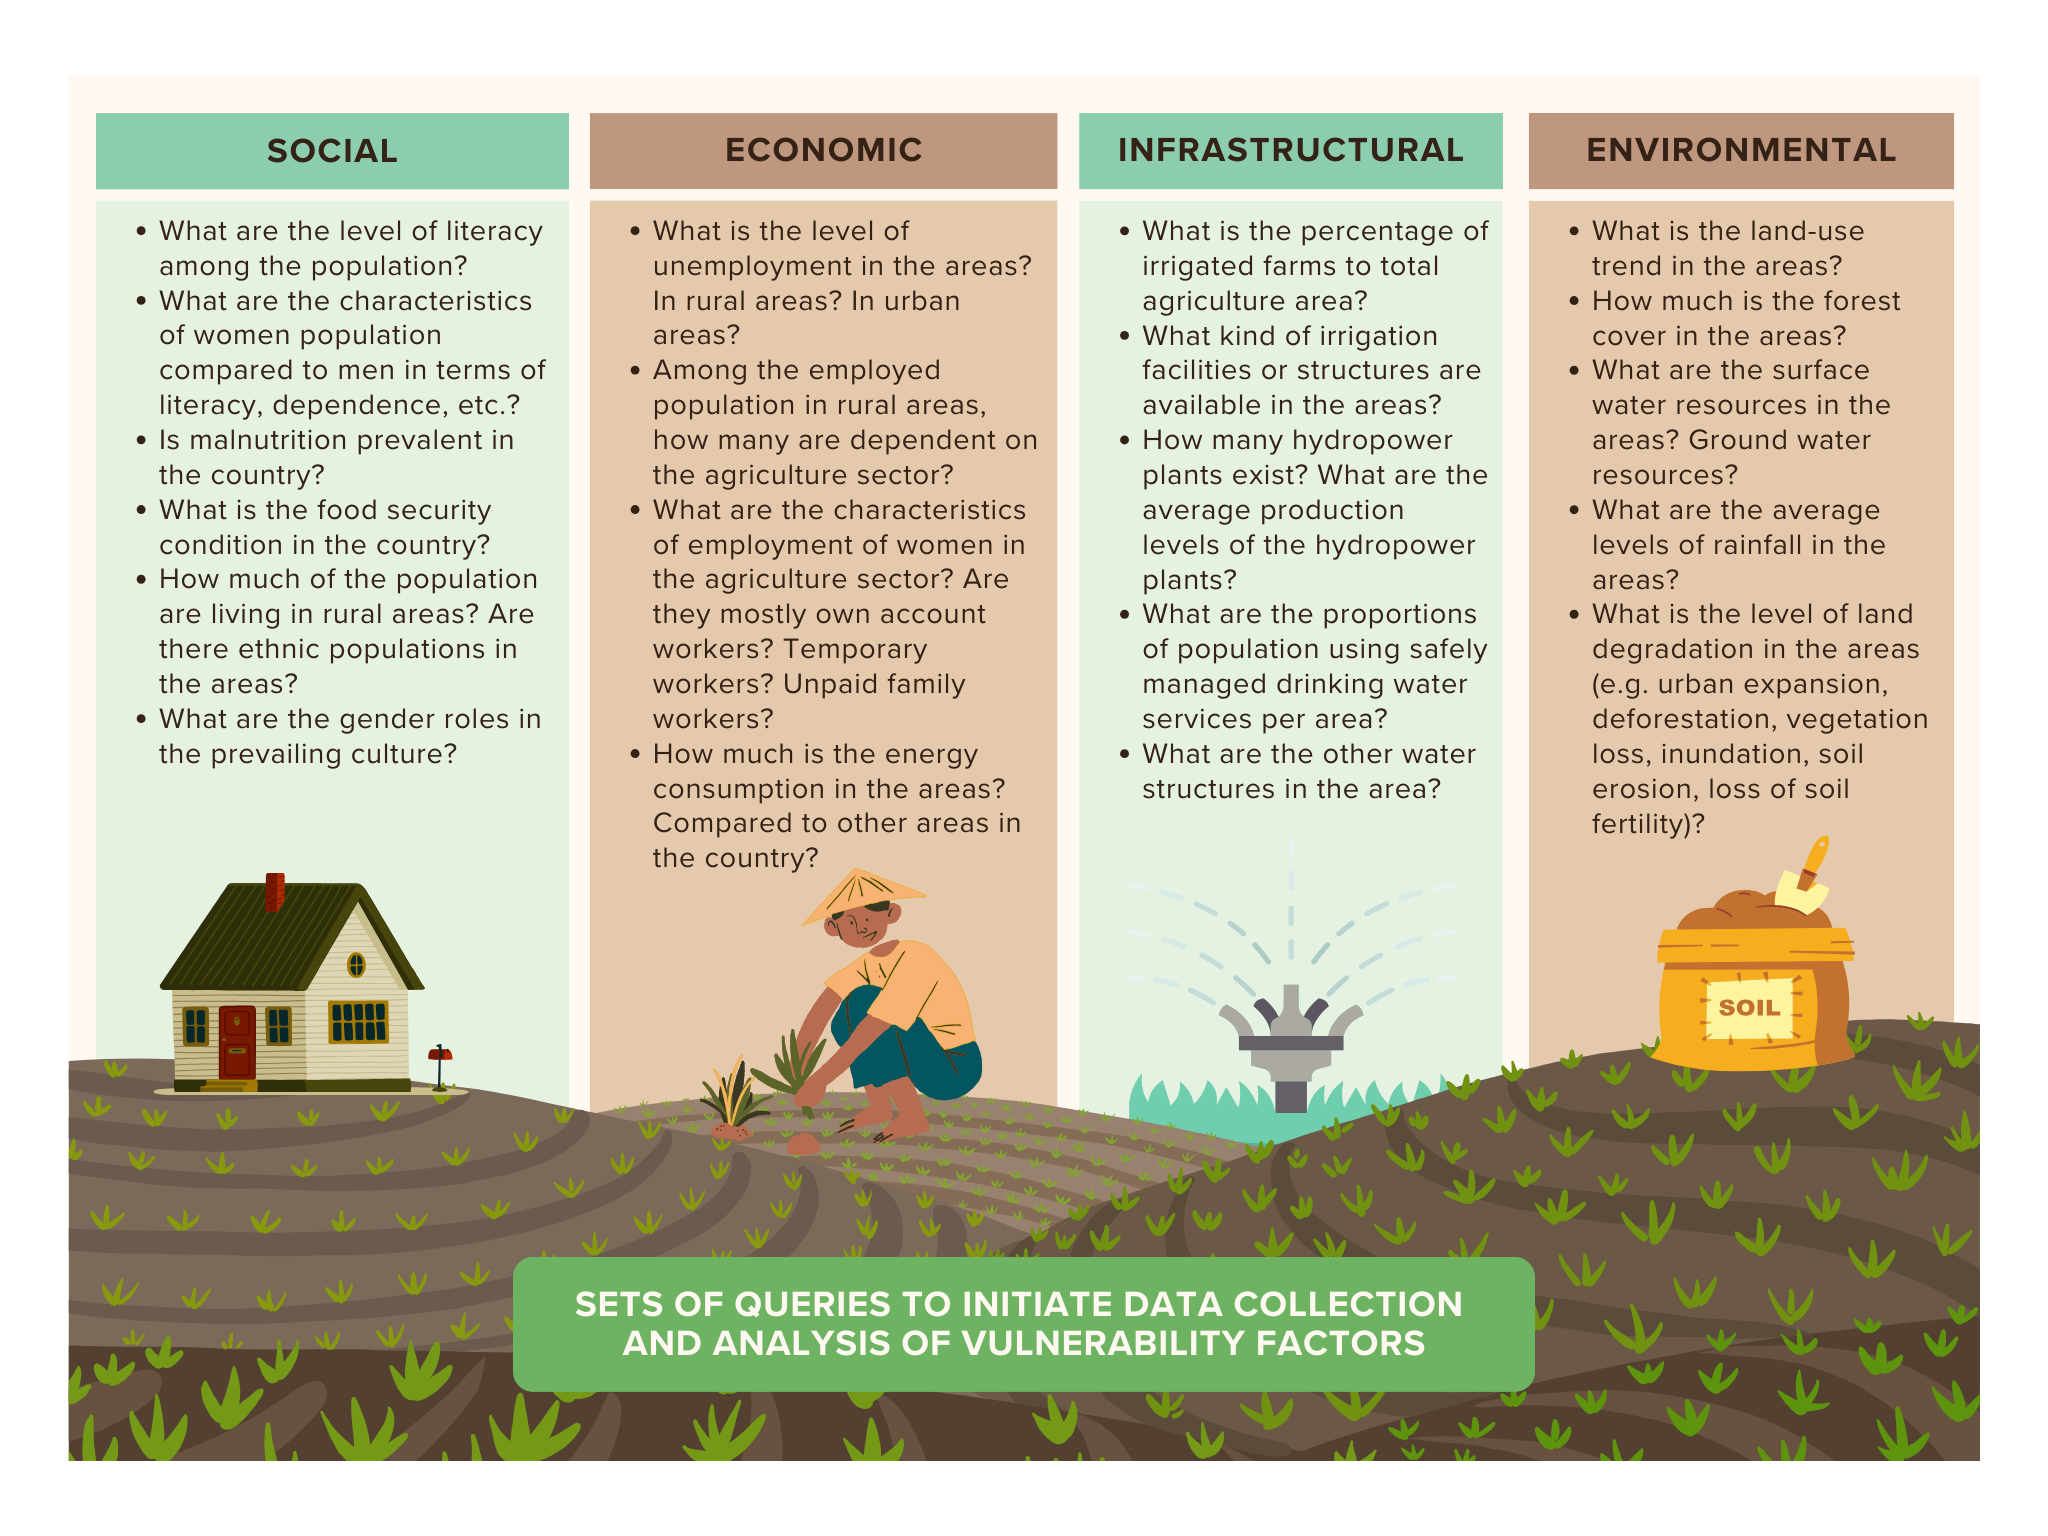
Determining the vulnerability factors involves identifying the social, economic, infrastructural, and environmental characteristics of the system units impacted by drought. The factors that influence the degree of drought impacts can be explored from these characteristics of impacted populations, areas, sectors, and ecosystems (i.e. system units). These may include gender, age, educational background, occupation, resource dependence, poverty incidence, employment sources, and infrastructures, among many others. Analyses can range from simple trends to more intensive statistical analyses (e.g. correlation, regression) and other available methods. Being an iterative exercise, the analysis is repeated until the vulnerability factors are identified.
In recent years, indicator- or index-based approaches have been promoted as useful tools for assessing, comparing, and monitoring the complexity of drought vulnerability. This method of vulnerability assessment is based on organized and systematic combinations of indicators to generate an index that can evaluate the levels of vulnerability. The components of these vulnerability indices are factors that can be utilized as baseline indicators of vulnerability. The baseline indicators are those identified in the UNCCD’s Good Practice guidance for national reporting on UNCCD strategic objective 3, for computing the social, economic, and infrastructural dimensions of vulnerability. Nevertheless, the guidance was established to support harmonized and standardized reporting on drought resilience-building at the global level. This means that the proposed indicators must be easily computable in all countries. Consequently, highly sophisticated data-intensive indicators are not proposed in the UNCCD guidance. This does not imply that an I&V assessment for planning purposes should be limited to these indicators. Just the other way around, a rigorous assessment should be contextualized and tailored to the country's context. Vulnerability differs spatially and is place-specific; while some generic indicators may represent vulnerability factors in the country context, others may not. Own investigation is still required even if there are available generic indicators.
DIMENSIONS OF VULNERABILITY – This stage focuses on the development of social, economic, infrastructural, environmental, and institutional dimensions of vulnerability. This entails integrating and summarizing the data gathered, the indices computed or collected, and the results of analyzing vulnerability factors.
The dimensions of vulnerability need to illustrate the state of play at the national and sub-national scales. The analysis identifies the vulnerable system units to drought to determine the focus of drought risk management efforts. It also answers the questions relating to “how” the system units are vulnerable to drought, such that drought risk management measures can be effectively designed.
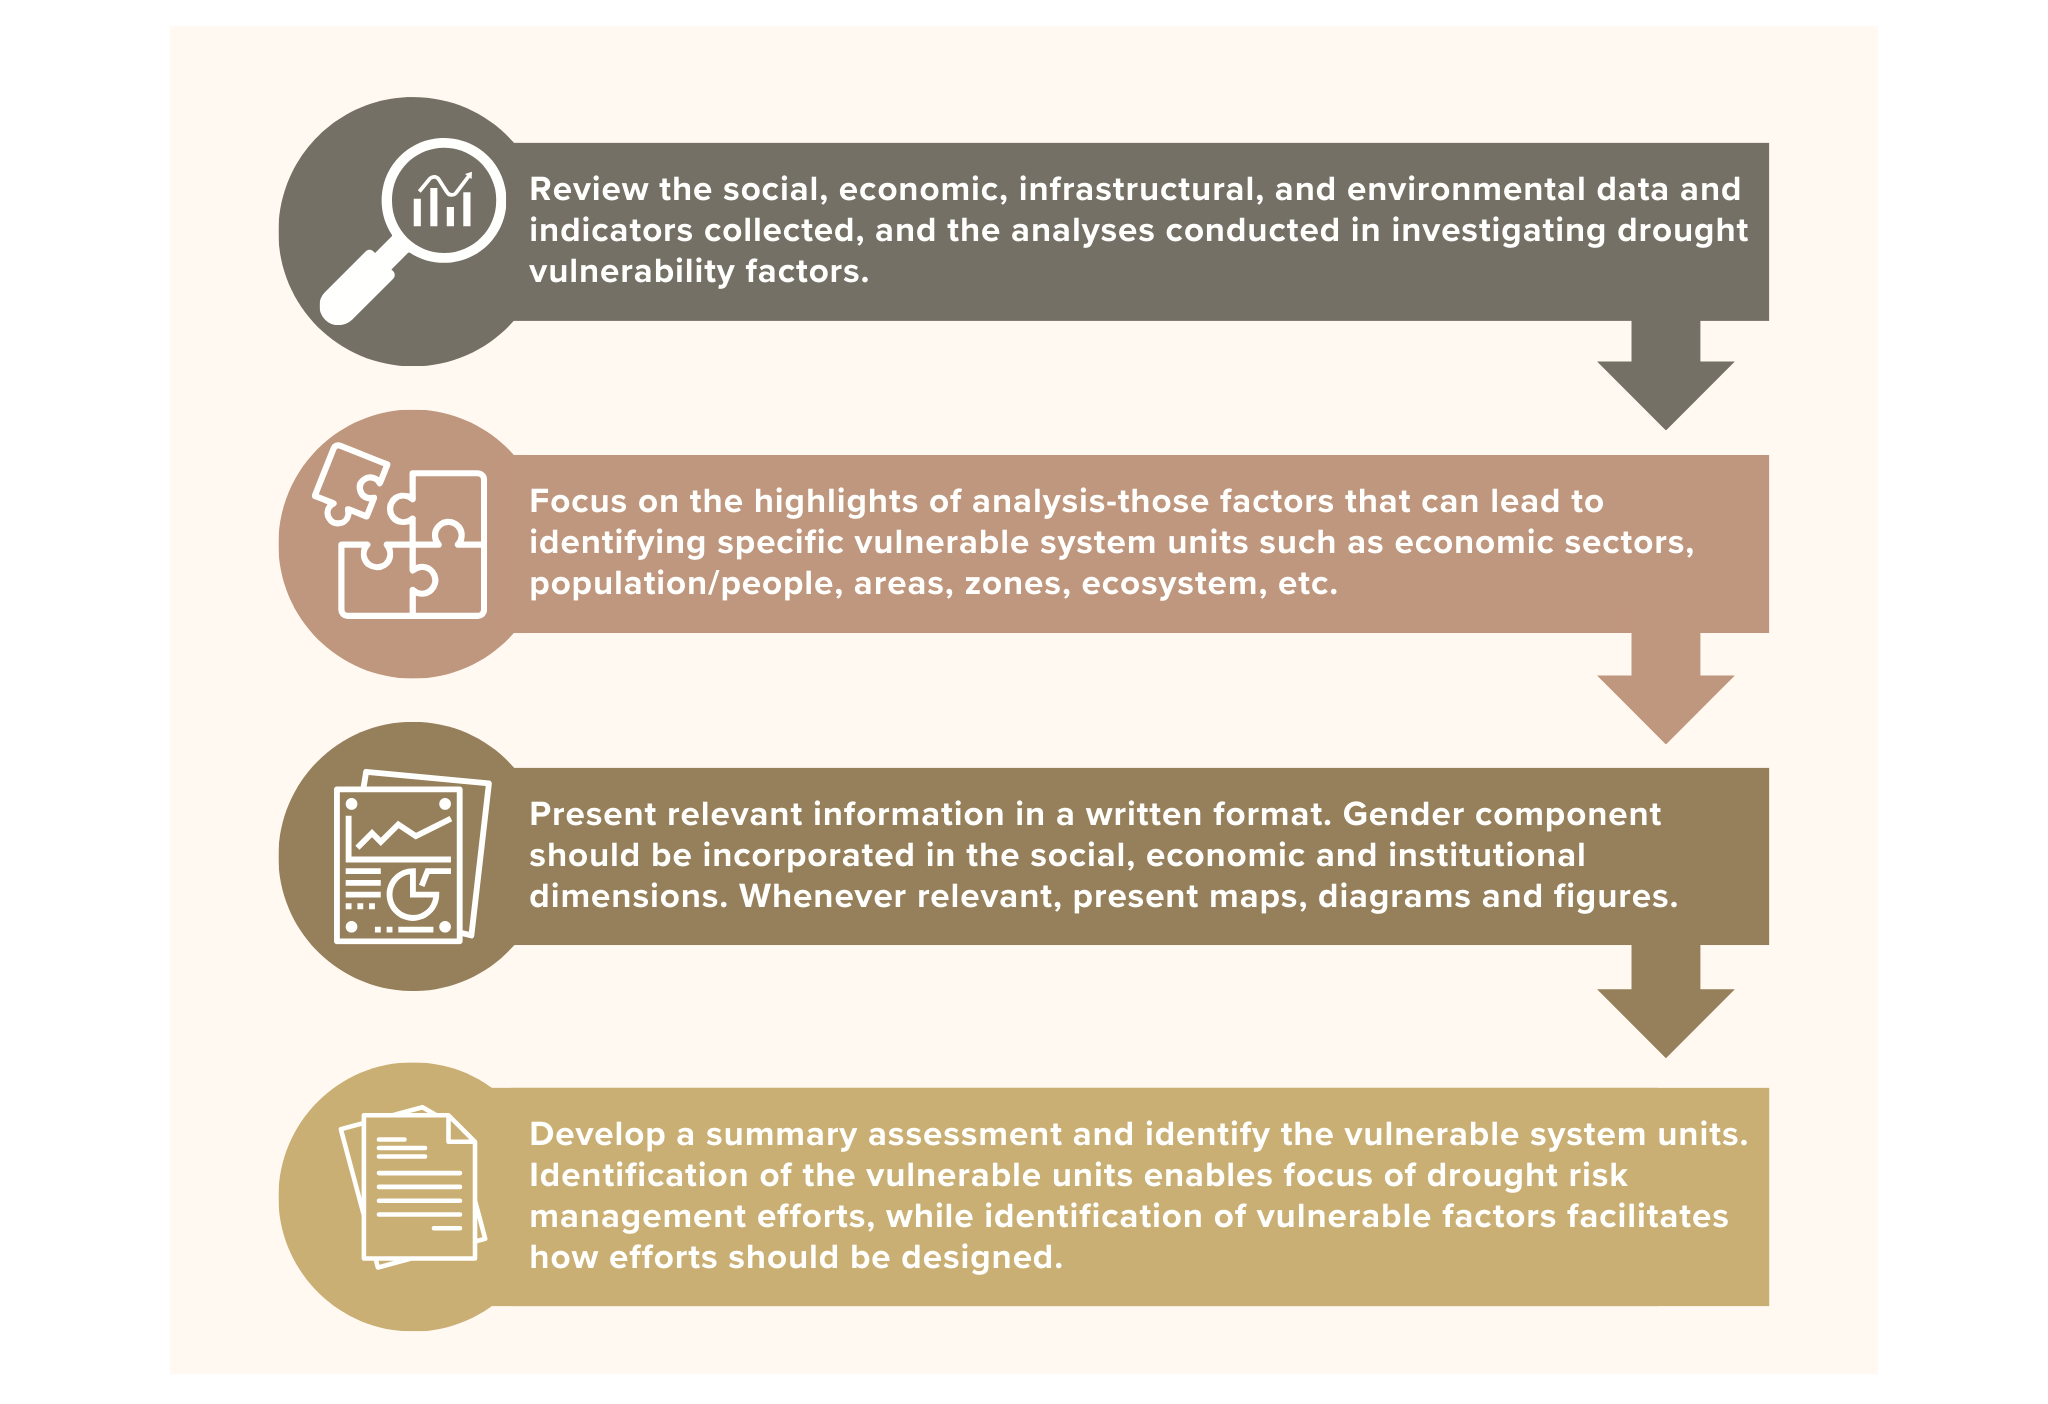
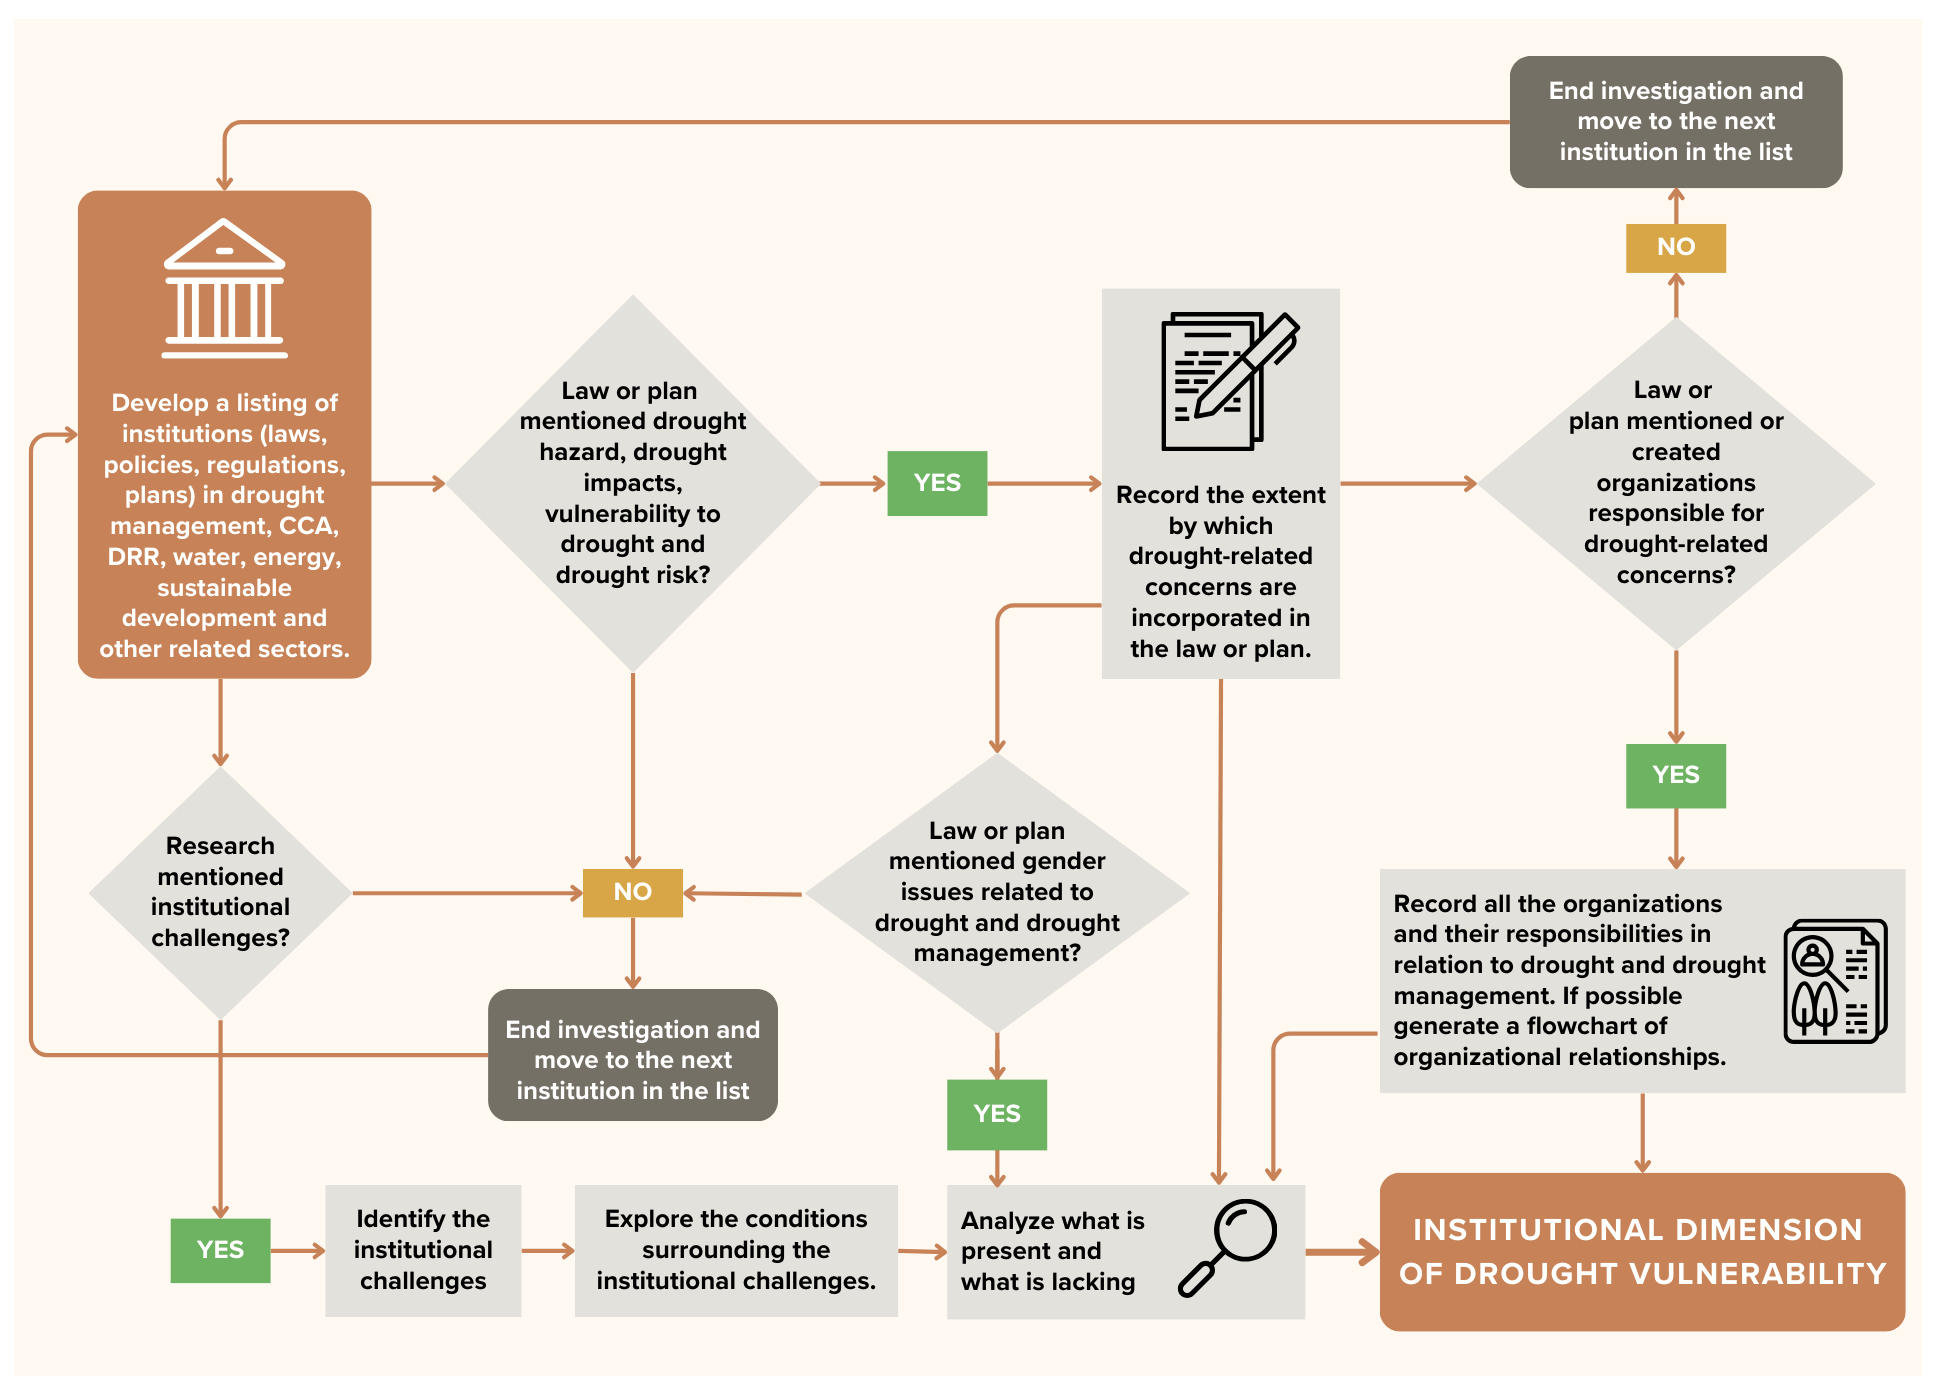
INSTITUTIONAL DIMENSION – Data and information to discuss the social, economic, infrastructural, and environmental dimensions of vulnerability would already be at hand. The factors that characterize these dimensions are inherent characteristics of the system, and they would have already been collected during the stage of investigating drought vulnerability factors.
Investigation of the institutional dimension is different. Unlike the other dimensions, the institutional dimension is not comprised of the innate characteristics of the system. Drought concerns are internalized in the system through the institutional framework, either by creating new institutions or building the capacities of existing ones. New sets of information will need to be gathered, and additional investigation needs to be conducted to develop the institutional dimension of vulnerability. Investigating institutions is an iterative process that is repeated until the information collected is sufficient to illustrate what is present and what is lacking in the institutional environment concerning drought risk management.
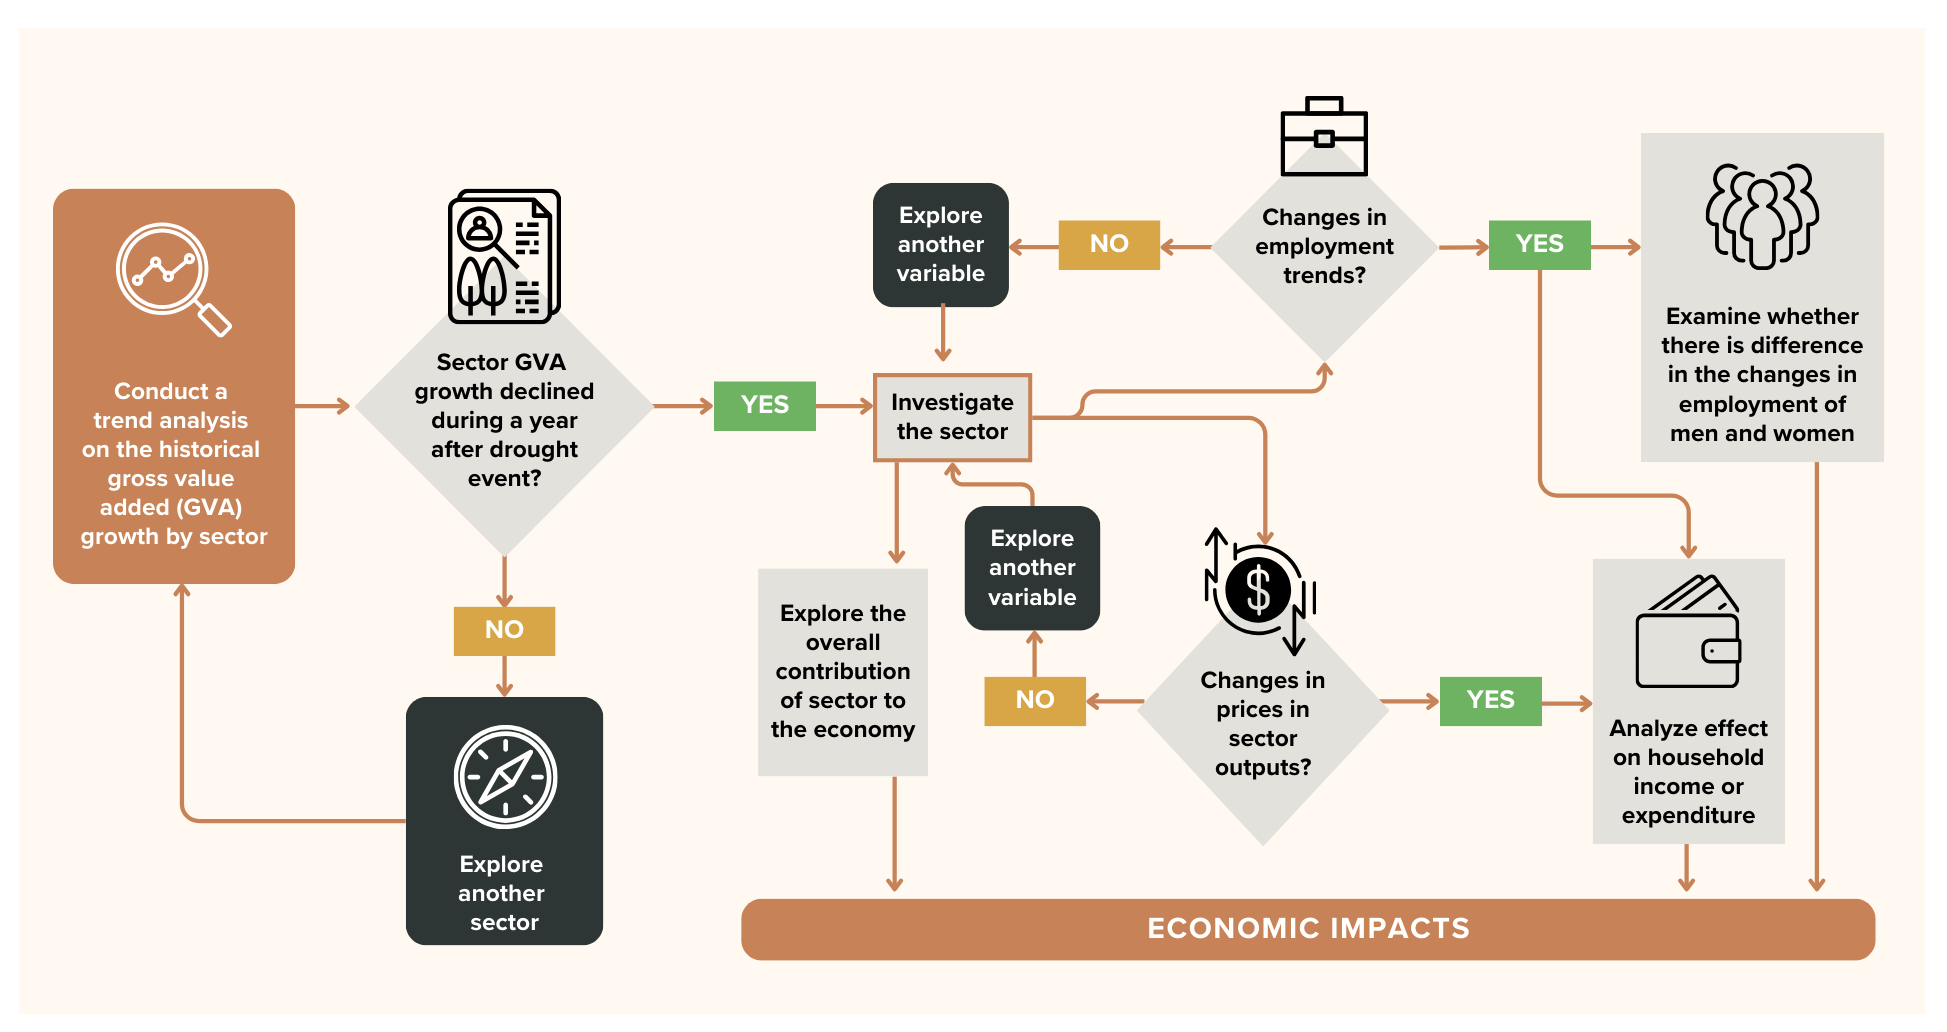
If there is a trend of declining agricultural employment during droughts, investigate whether there is a difference between the severity of employment reduction between men and women. If there is an increase in the number of unpaid family workers during droughts, explore the difference between the number of male and female unpaid family workers during the years with and without droughts.