
Indicators and data sources
Investigating the extent of damages and losses experienced from the various types and intensities of droughts entails collecting data on the economic, social, and environmental impacts of drought events. 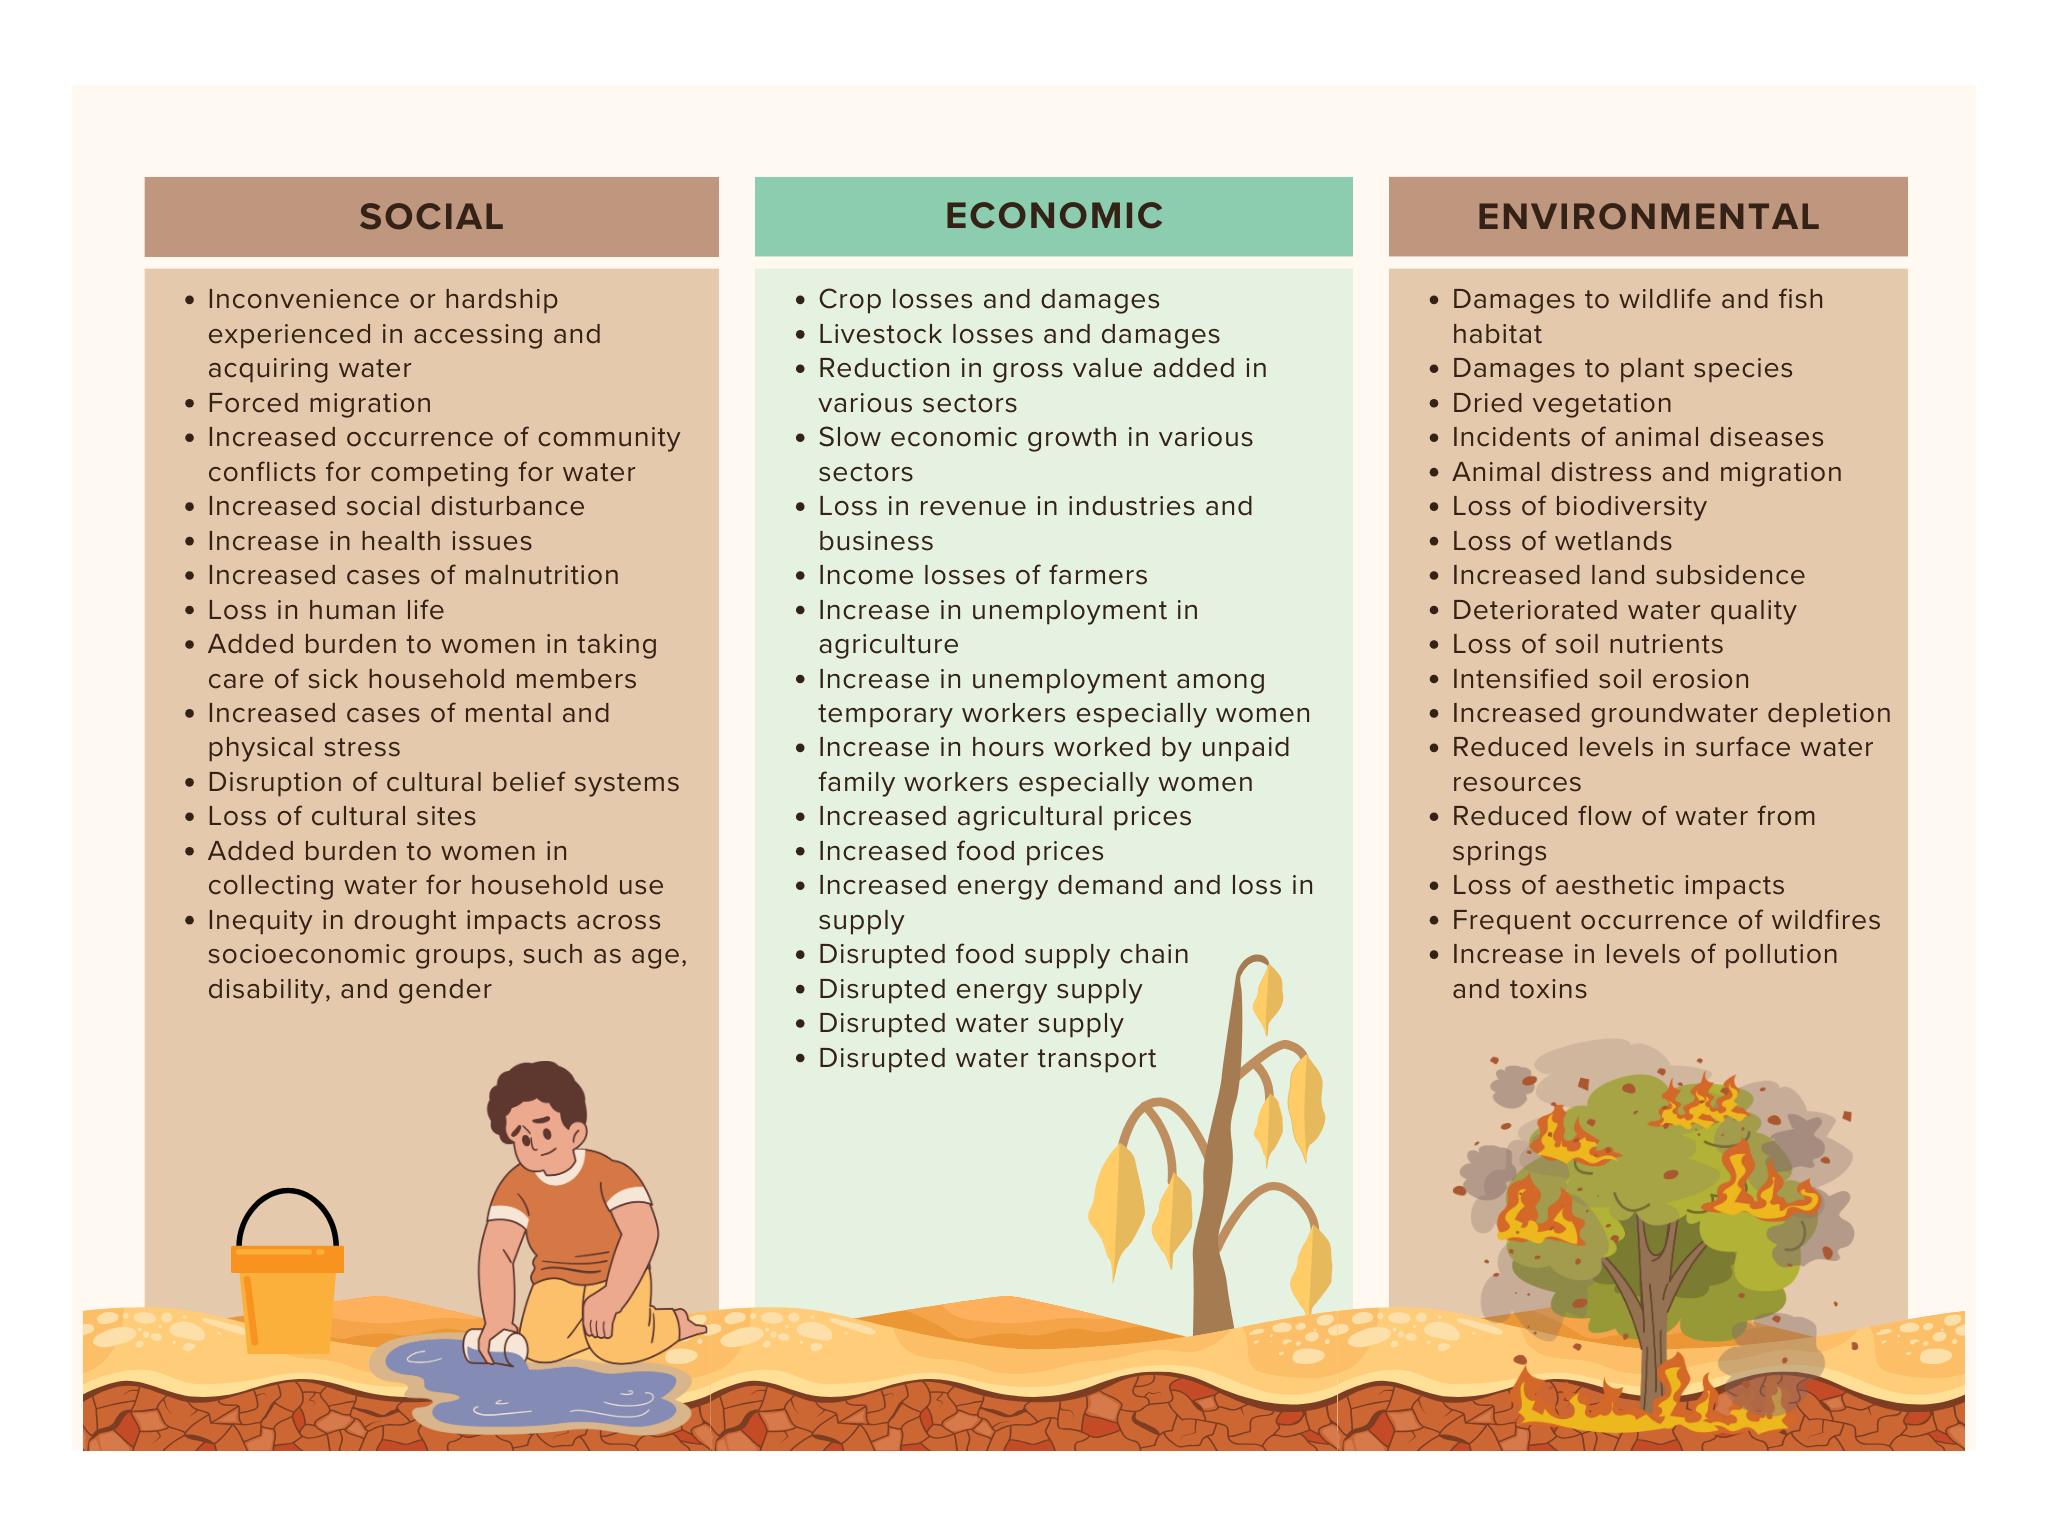 Both quantitative and qualitative information should be collected. While quantitative data provide a certain degree of measurement, qualitative data illustrate on-ground conditions. The FAO’s Economic assessment of drought risk management is a helpful knowledge product in conducting economic assessments of drought impacts. In the report, drought impacts are classified as direct, indirect, and intangible costs of inaction.
The inclusion of gender concerns in the I&V assessment begins at this stage. Helpful materials for incorporating gender concerns include:
- The Differentiated Impacts of Desertification, Land Degradation and Drought on Women and Men (UNCCD)
- Manual for Gender-responsive Land Degradation Neutrality Transformative Projects and Programmes (UNCCD)
- Methodological note: Trends in populations exposure to land degradation. A disaggregate approach by gender (UNCCD)
- Gender and adaptation (UNDP)
- Gender-Sensitive Climate Vulnerability and Capacity Analysis (CARE)
- Women's empowerment in agriculture index (IFRI)
It is vital to determine the interconnections of industries and sectors or other parts of the system in creating the drought impact pathway. Quantitative indicators are effective tools for exploring these system linkages. Some drought impacts are not readily observed and should be teased out from various datasets. Helpful materials in this investigation include the World Bank’s Framework for the Assessment of Benefits of Action/Cost of Inaction (BACI) for Drought Preparedness and FAO’s Economic assessment of drought risk management. More specific and complex assessment can be found in the European Drought Risk Atlas, which depicts impact chains through different sectors.
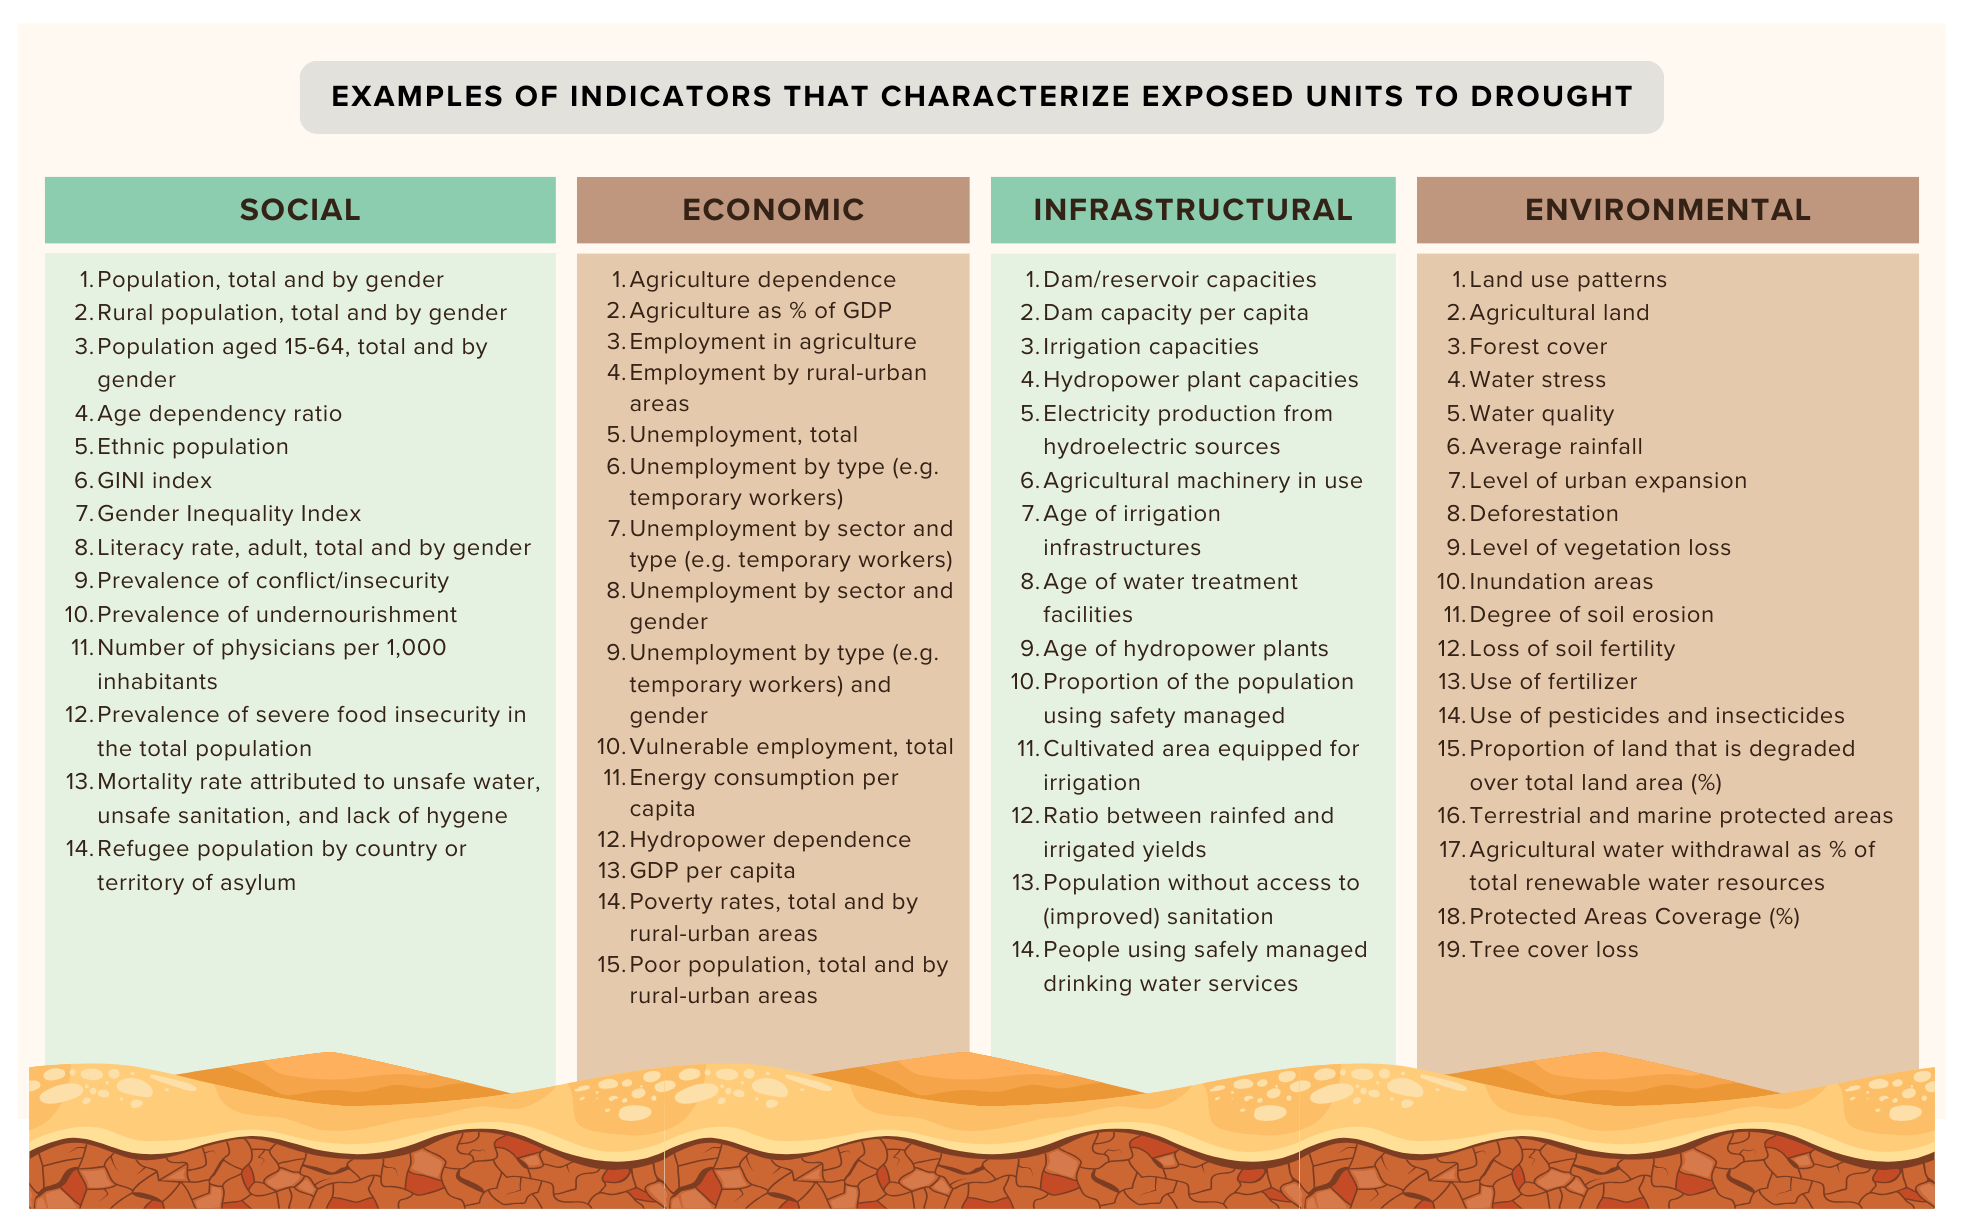
At this point, the drought impact pathway has been constructed and can be used to narrow the indicators to be investigated. The main objective of this stage is to identify the characteristics of system units that have been impacted by drought. These characteristics are typically represented by indicators in the following dimensions:
This is the beginning of the deep dive into various parameters that may represent system vulnerability. It is an iterative process that is repeated until the vulnerability factors are identified. Helpful material in this investigation includes the UNCCD’s Drought Resilience, adaptation, and management policy framework: supporting technical guidelines.
Vulnerability indices also can be used in describing the vulnerability dimensions. These indices can be computed based on the many available methodologies. Alternatively, vulnerability indices estimated and made available by various studies, research, or databases can be utilized. It is critical to verify that the values of selected available vulnerability indices complement the results of the I&V assessment. Given the differences in data sources and sets of indicators used in computing the index and analysing country settings for the I&V assessment, the available index may not entirely reflect recent country conditions.
This stage is a synthesis of the vulnerability factors by grouping the identified indicators under the five dimensions. It is built on derived information but the logical order is important to construct the dimensions. The number of indicators under the dimensions is less decisive than the dimension-specific trend of the indicators. Indicators that show mostly negative results for a dimension may indicate its relative vulnerability compared to other dimensions.
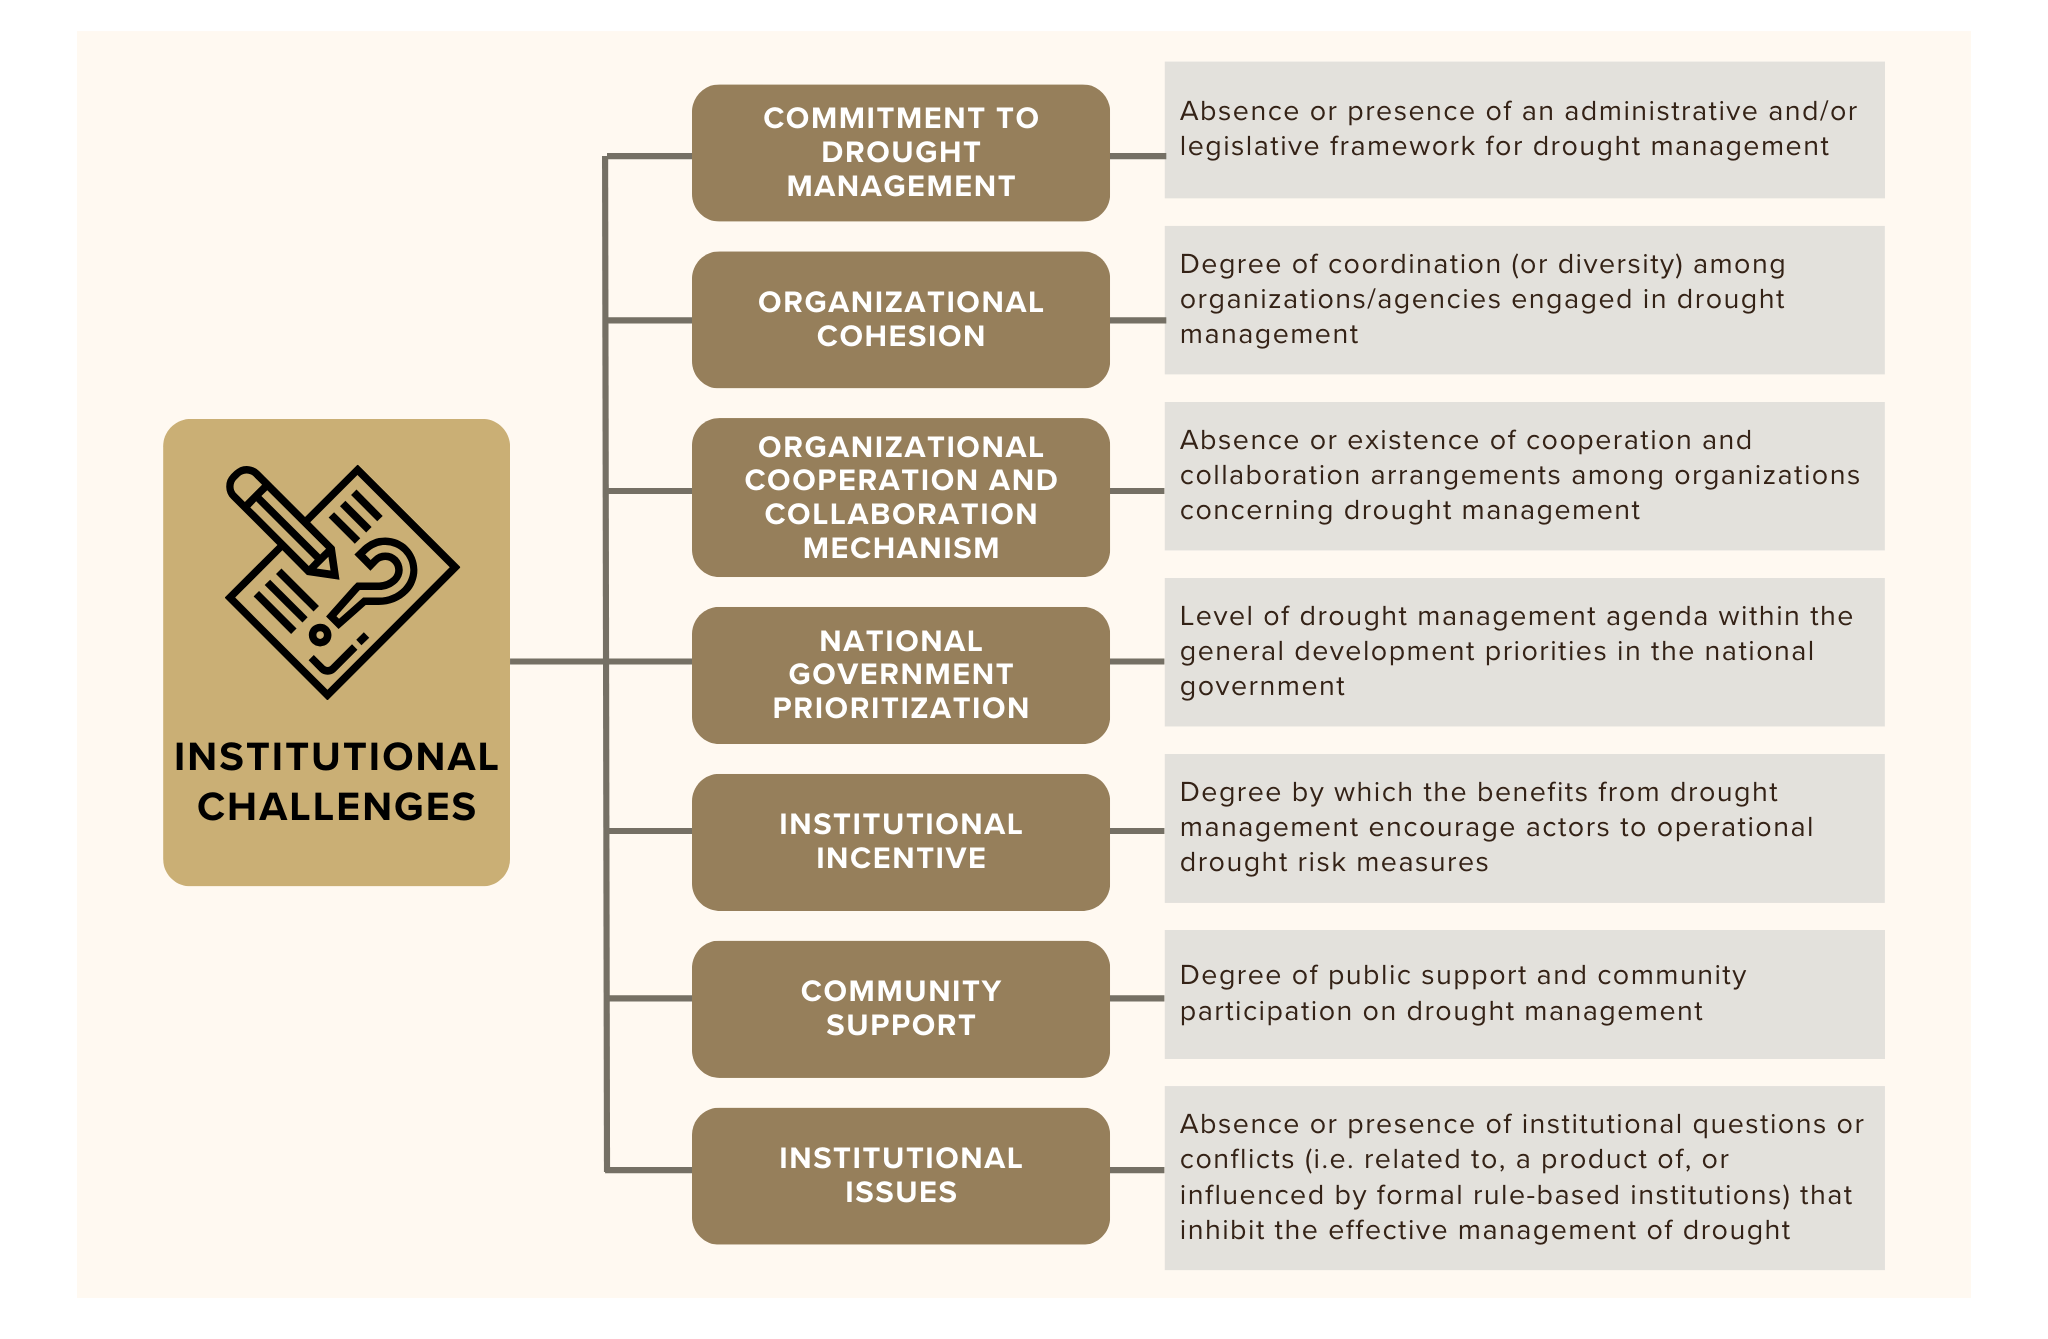
THE INSTITUTIONAL DIMENSION – At this point, almost all the information needed to complete the definition of vulnerability dimensions is available, except for the institutional dimension.
It constitutes of the rule-based (e.g. legislation, laws, policies, regulations, plans), organizational (e.g. government ministries and agencies, private sector entities, community organizations), and social structure-based (e.g. traditions, customs, norms) and their institutional arrangements that guide actions concerning drought management.
An important aspect of institutional analyses is the identification of institutional challenges and understanding of the conditions surrounding the challenge in the country’s context. Country sources are the best source of information to complete the discussion. There are also repositories of laws, plans, regulations, and other institutional factors that can help describe the institutional dimension.
Primary inputs for I&V assessments are numerical data, indicators, indices, descriptive information of drought events, and characteristics of the system units being investigated (areas, people, sectors, etc.). National statistics agencies, meteorological agencies, and other government offices are the best sources to retrieve such information. In case country sources are insufficient, databases, websites, and other information platforms of international organizations are also good data sources.
SAMPLE Data sources for investigating and analysing drought impacts and vulnerability
There are existing tools that provide quantitative estimates of vulnerability, such as the UNCCD’s Drought Risk Assessment Visualization Tool of the Drought ToolboxWhile this tool primarily caters to risk assessment, it presents vulnerability estimates at the subnational level that may be helpful in the I&V assessment. The tool also presents information in spatial maps useful for visualization of vulnerable areas. It is crucial to verify that the vulnerability estimates in the tool complement the results of the I&V assessment. There is a possibility that the index values in the Drought Risk Assessment Visualization Tool may not match the conditions described by the data and analyses in the I&V assessment. The difference may be due to varying reasons such as the updated data used in I&V assessment, the differences in the data sources, and types of indicators collected.